
Abstract
Introduction
Breast cancer is the most common form of cancer worldwide and a serious threat to women. Hypoxia is thought to be associated with poor prognosis of patients with cancer. Long non-coding RNAs are differentially expressed during tumorigenesis and can serve as unambiguous molecular biomarkers for the prognosis of breast cancer.
Methods
Here, we accessed the data from The Cancer Genome Atlas for model construction and performed Gene Ontology and Kyoto Encyclopedia of Genes and Genomes analyses to identify biological functions. Four prognostic hypoxia-related lncRNAs identified by univariate, LASSO, and multivariate Cox regression analyses were used to develop a prognostic risk-related signature. Kaplan–Meier and receiver operating characteristic curve analyses were performed, and independent prognostic factor analysis and correlation analysis with clinical characteristics were utilized to evaluate the specificity and sensitivity of the signature. Survival analysis and receiver operating characteristic curve analyses of the validation cohort were operated to corroborate the robustness of the model.
Results
Our results demonstrate the development of a reliable prognostic gene signature comprising four long non-coding RNAs (AL031316.1, AC004585.1, LINC01235, and ACTA2-AS1). The signature displayed irreplaceable prognostic power for overall survival in patients with breast cancer in both the training and validation cohorts. Furthermore, immune cell infiltration analysis revealed that B cells, CD4 T cells, CD8 T cells, neutrophils, and dendritic cells were significantly different between the high-risk and low-risk groups. The high-risk and low-risk groups could be precisely distinguished using the risk signature to predict patient outcomes.
Discussion
In summary, our study proves that hypoxia-related long non-coding RNAs serve as accurate indicators of poor prognosis and short overall survival, and are likely to act as potential targets for future cancer therapy.
Introduction
Breast cancer (BRCA) remains the most frequently diagnosed malignancy and a leading cause of cancer-related death among women worldwide.Citation1 Adjuvant therapy for patients with BRCA has improved patient prognosis at certain level but the overall effects of treatment are still unsatisfactory.Citation1 While several prognostic criteria have been established, including lymphangiogenesis and lymphovascular invasion,Citation2 cyclooxygenase-2 (COX-2), epithelial cell adhesion molecule (Ep-CAM),Citation3 and Her-2/neu overexpression,Citation4 all of them have some disadvantages. Further, tumor heterogeneity and intratumor sub-clones pose tremendous challenges in the development of novel strategies for the prediction of treatment outcomes. Therefore, it is imperative to build an effective and precise predictive model, leading toward more accurate and practical immunotherapeutic development.
Hypoxia is a prognosis-related factor associated with poor survival in various cancer types. Hypoxia is related to resistance to radiation therapy and chemotherapy, and is a key microenvironmental factor that enhances the metastatic potential of tumor cells.Citation5 This is owing to dysregulated cell proliferation and structurally and functionally abnormal blood vessels characterized with tumor cells.Citation6 It has also been demonstrated that hypoxia is responsible for the hypoxia-inducible factor 1 alpha (HIF1α)-mediated increase in arginase -II protein level that enhances intracellular adhesion molecule (ICAM)-1 protein levels and monocyte-endothelial interactions, thereby boosting the production of mitochondrial reactive oxygen species.Citation7 Hypoxia biomarkers such as HIF-1α are potentially malignant and can serve as prognostic factors to assess clusters in BRCA patients.Citation8 Studies have demonstrated treatment regimens (acriflavine, digoxin, and ganetespib) that aim to inhibit HIF-1 and suppress tumor survival pathways, arrest the development and growth of primary BRCA tumors, prevent tumor vasculature formation, stop pre-metastatic niche formation, and halt local invasion in orthotopic mouse models in case of metastasis to lymph nodes and lungs.Citation9–Citation12 Their involvement in tumor metastasis and chemotherapy resistance prompted us to investigate the effect of the combination of chemotherapy and HIF inhibitors as a novel targeted therapy for BRCA.Citation13
Long non-coding RNAs (lncRNAs) are more than 200 nucleotides long. LncRNAs have nearly no or limited protein-coding capacityCitation14 but play a vital role in many life activities, accounting for the majority of the transcripts in the human transcriptome.Citation15 Abnormal expression or function of lncRNAs is closely related to the occurrence of human diseasesCitation16 such as cancer,Citation17 neoplastic diseases, cardiovascular diseases, and other serious disorders.Citation18 Under disease state, lncRNAs show abnormal sequence, spatial structure, expression pattern, and interaction with binding proteins. Therefore, lncRNA motifs could be useful as novel targets for development of new treatment or prevention strategies against different diseases.Citation19
Aberrant expression of lncRNAs and abnormal alterations in hypoxia are both common phenomena in tumor cells and are associated with tumor progression but the direct interconnection and role of are unknown and require further investigation. Though there have been studies showing the different prognostic values of hypoxia-related lncRNAs in gastric cancer,Citation20 bladder cancerCitation21 and clear cell renal carcinoma,Citation22 the prognostic markers based on hypoxia-related lncRNA expression profiles have not been studied in breast cancer. In this direction, the establishment of a hypoxia-related lncRNA prognosis model with a high prognostic value is justified. Here, we performed an in-depth exploration of the public datasets to identify and validate a robust hypoxia-related four lncRNA signature that served as a useful tool for stratifying early-stage BRCA patients according to their overall survival. Our findings indicate that targeting this hypoxia-related lncRNA signature may be an optimal approach for individualized treatment of BRCA.
Materials and Methods
Data Collection and Analysis
Female subjects only were chosen for the study, as the number of male patients was small. Transcriptome profiles in FPKM format were derived from The Cancer Genome Atlas (TCGA) database. The probes were subsequently converted into gene symbols based on the platform annotation information. These data were then classified into lncRNAs and mRNAs by the human genome (Ensemble Genome Browser 90). Likewise, detailed corresponding clinical follow-up data were available in TCGA database. Deficient data were ruled out prior to the bioinformatic analysis. The survival of patients with BRCA beyond 30 days was needed.
Hypoxia-Related Gene (HRG) Retrieval
For the hypoxia gene datasets, genes of the hypoxia-related pathway (HARRIS_HYPOXIA and WINTER_HYPOXIA_METAGENE) were downloaded from the Molecular Signatures Database (https://www.gsea-msigdb.org/gsea/msigdb/index.jsp) and all hypoxia-related genes were sorted out.
Identifying Differentially Expressed Hypoxia-Related lncRNAs (DEHR-lncRNAs)
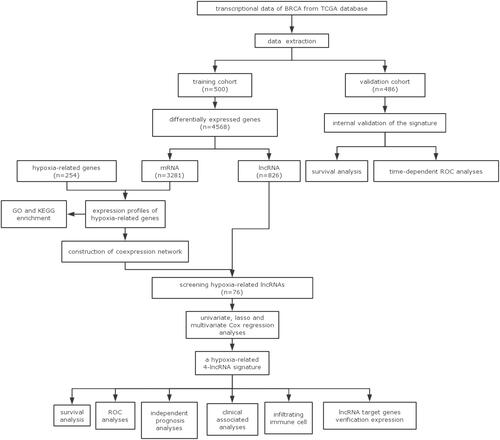
The “limma” R package was used to determine the expression of differentially expressed genes (DEGs) in training cohort with the standard of |log2FC| > 1 and P < 0.05. These DEGs included mRNAs and lncRNAs. An intersection was performed using the mRNAs and HRGs to screen out differentially expressed hypoxia-related mRNAs. Using these data, we constructed a co-expression network to demonstrate the mRNA-lncRNA interactions. Pearson’s correlation analysis with |Cor| > 0.5, and p.adj < 0.001 was employed to determine the relevance between the expression of HRGs and lncRNAs. DEHR-lncRNAs were obtained by screening with the standard |corFilter| > 0.4 and P < 0.001. A detailed flowchart is presented in . As the data were extracted from TCGA database following the publication guidelines strictly approved by TCGA, ethics committee approval was not required.
Figure 1 Flowchart.
Gene Oncology (GO) Annotation and Kyoto Encyclopedia of Genes and Genomes (KEGG) Pathway Enrichment Analysis
We performed functional enrichment analysis with GO and KEGG pathway analysis using the “clusterProfiler” package in the R software.
HR-lncRNA Prognosis Model Construction
By combining the survival signature with the corresponding DEHR-lncRNA expression, we constructed a clinical application signature to predict the clinical outcome of patients with BRCA using univariate, LASSO, and multivariate Cox regression analyses. The risk score for each patient was calculated as follows:
where N represents the number of HR-lncRNAs in the multivariate Cox regression, Ei is the expression value of lncRNA, and γi is the estimated regression coefficient of lncRNA in the multivariate Cox regression analysis. According to the prediction formula, all sample information was classified into high- and low-risk groups. The threshold value obtained here was the cut-off value for the median risk score.
Survival Analysis and Receiver Operating Characteristic (ROC) Curve
Kaplan–Meier survival analysis was used to evaluate the overall survival distribution. In addition, multivariate ROC curves were plotted to prove and test the sensitivity and specificity of the forecast signature with other clinical phenotype data related to prognosis, including age, gender, stage, tumor, metastasis, and node. To ensure the accuracy of the conclusions, incomplete clinical data were eliminated. The area under the ROC curveCitation2 was subsequently calculated using the trapezoid rule to distinguish the capability of clinicopathological characteristics.
Subgroup Survival Analysis
A good prognostic marker should be independent of the known clinicopathological prognostic factors. Univariate Cox regression analysis was conducted to determine the prognostic significance of the individual clinicopathological factors. In this study, all samples were reassigned into corresponding subgroups based on age, sex, and stage. Following this, mean risk scores were collected for different subgroups and survival analysis was conducted to verify the effectiveness of the predictive prognostic model. Kaplan–Meier survival analysis was used to compare the prognostic capability between subgroups using the Kaplan–Meier survival “survival” R package and the “survminer” R package.
Immunohistochemistry of the Human Protein Atlas (HPA)
Immunohistochemistry images were downloaded from the publicly available database, HPA (www.proteinatlas.org/).Citation23 Data regarding the expression levels of ABCB1, ALDH1A3, EGR1, HLADQB1, LEP and TAGLN in normal and breast cancer tissues was obtained from HPA.
Statistical Analysis
Strawberry PERL software (version 5.30.2.1) was employed to process the data. All statistical analyses were performed using R software (version 4.0.2). A value of p < 0.05 was considered statistically significant.
Results
Identifying Hypoxia-Related mRNAs
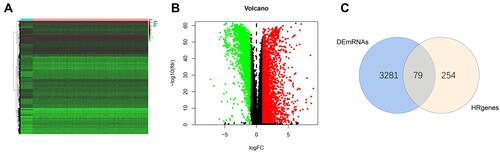
Overall, 1164 transcriptome profiling data were obtained, containing 111 normal and 1053 tumor samples from 986 patients with BRCA. We eliminated the repeated information from multiple available samples. Based on the survival data, patients with follow-up times lower than 30 days were excluded. BRCA samples were subsequently acquired from TCGA and randomly split into two groups as follows: training (n = 500) and validation (n = 486) cohorts. As presented in Supplementary Table 1, there were no obvious differences between the patients in training cohort and validation cohort. The baseline parameters of the two groups were consistent and comparable. In the training cohort, as described in , a total of 4568 DEGs met the screening criteria (|logFC | >1 and FDR < 0.05) between normal and tumor tissues. In comparison with normal tissues, tumor tissues showed 2688 upregulated and 1880 downregulated genes (). Among the 4568 DEGs, 3281 differentially expressed mRNAs and 826 lncRNAs were identified. To determine related genes, we filtered for gene sets in GSEA and identified 254 genes associated with hypoxia. Following this, intersections of differentially expressed mRNAs and HRGs revealed 79 hypoxia-related mRNAs ().
Figure 2 Screening different expressed hypoxia-related genes. (A) Heatmap of significantly different expressed genes (DEGs). (B) Volcano map; green represents down-regulated of genes, and red represents up-regulated of genes. (C) Venn plot.
Functional Analysis
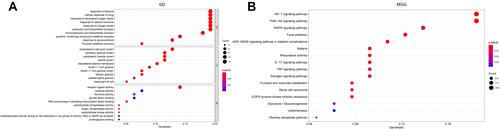
For functional analysis, GO and KEGG enrichment analyses were conducted using the “clusterProfiler” package in the R software. The mRNAs were further analyzed according to GO functional enrichment analysis, and 16 significant GO terms were identified (P < 0.01). “Response to hypoxia,” “cellular response to drug,” “response to decreased oxygen levels,” “response to steroid hormone,” and “response to oxygen levels” were the top five GO terms (). In addition, 13 KEGG pathways were identified to be statistically significant at P < 0.01. Of them, the two most significant pathways were “HIF-1 signaling pathway” and “PI3K-Akt signaling pathway” ().
Figure 3 GO and KEGG pathway enrichment. (A) Gene oncology (GO) and (B) KEGG pathway analyses.
Construction of the HR-lncRNA Signature
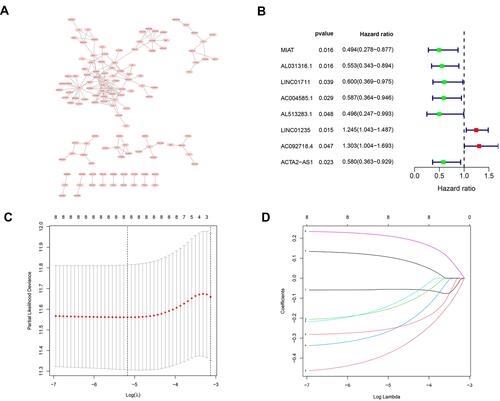
Accumulating evidence suggests that lncRNAs play a major role in transcriptional and post-transcriptional regulation of several genes. The high specificity of the distribution and expression of lncRNAs enables them to be potential biomarkers for BRCA prognostic assessment. The information on the expression of lncRNAs and mRNAs was extracted from the training cohort dataset. The Pearson’s coefficient was used to estimate the correlation between lncRNAs and hypoxia-related mRNAs with the conditions of |corFilter| > 0.4 and P < 0.001 (Supplementary Table 2). A co-expression network was constructed by selecting the significantly co-expressed lncRNAs and mRNAs (). A total of 76 HR-lncRNAs were identified. In this study, a univariate Cox regression analysis was performed to identify eight significant prognostic DEHR-lncRNAs (). In addition, LASSO regression analysis was performed to avoid overfitting and screen eight appropriate DEHR-lncRNAs ( and ). We implemented multivariate Cox regression and constructed a four HR-lncRNA model containing AL031316.1, AC004585.1, LINC01235, and ACTA2-AS1 as predictors of survival in patients with BRCA. The specific details regarding the predictors are presented in . The risk score was then detected based on the expression levels of these four HR-lncRNAs in each sample. Risk score = −0.469639133∙expression of AL031316.1–0.370604921∙expression of AC004585.1+0.277100812∙expression of LINC01235-0.485278878 ∙ expression of ACTA2-AS1.
Table 1 4-lncRNA Signature Identified by Multivariate Cox Regression Analyses
Figure 4 A prognostic risk model was constructed from the prognostic 4‐lncRNAs signature. (A) Hypoxia-related mRNA-lncRNA co-expression network (B) A forest map showed 8 DElncRNA pairs identified by Cox proportional hazard regression (C) Plots of the cross-validation error rates. (D) LASSO coefficient profiles of the 8 prognostic lncRNAs.
Model Validation
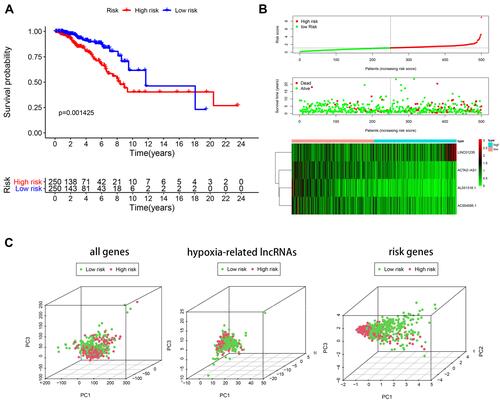
According to the hypoxia-related lncRNA signature, each sample received a risk score. The median value of the risk score was used as the threshold to categorize patients into high-risk (n = 250) and low-risk (n = 250) groups. Survival analysis was then performed to validate the survival-predicting ability of the signature. A significant difference was observed between the high-risk and low-risk groups based on Kaplan–Meier curves and Log rank test (). The HR-lncRNA expression level gradually increased in the samples along with their risk scores. The overall survival showed a dramatically decreasing trend (). PCA was performed to investigate different distributions based on all genes, HR-lncRNAs, and risk gene expression patterns ().
Figure 5 Risk score analysis of disease-specific survival related prognostic models (A) Survival curve for low-risk and high-risk subgroups. (B) Risk score distribution, survival status and expression heat map. (C) PCA maps show the distribution of patients based on the all genes, hypoxia- related lncRNAs and risk genes.
Testing in Validation Cohort
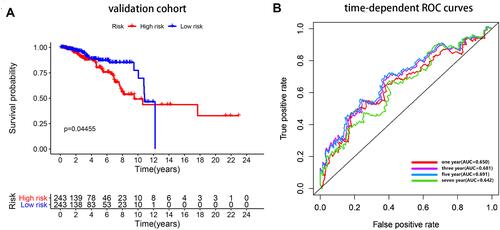
Patients in validation cohort were divided into high- and low-risk groups using the median risk score of training cohort as the cut-off. Considering the agreement with the outcomes of the training cohort, a better prognosis was observed in the low-risk group than in the high-risk group in the validation cohort (). The AUC (95% confidence interval [CI]) values of the lncRNA model based on the selected four lncRNAs at 1, 3, 5, and 7 years were 0.650, 0.681, 0.691, and 0.642, respectively (), demonstrating its good sensitivity and specificity for survival prediction.
Figure 6 Internal validation. (A) Survival curve for low-risk and high-risk subgroups in the validation cohort. (B) Time-dependent ROC curve comparison of the validation cohort. AUCs at 1, 3, 5 and 7 years were calculated.
Prognostic Performance of the Four lncRNAs
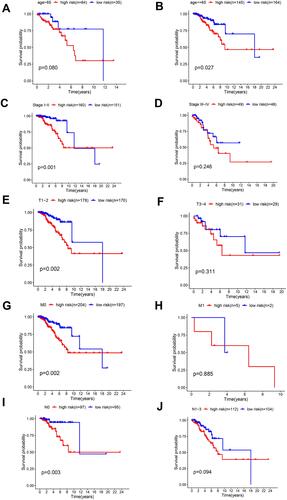
Stratified analyses were then conducted in diverse subgroups to confirm the prognosis signature. The prognostic signature was verified to be effective in subgroups aged ≤ 65 years but was not significant in the subgroup aged > 65 years. This was examined in other subgroups of studies. In addition, the prognostic signature was effective in Stage I–II subgroups, but the result was not very satisfactory in Stage III–IV subgroups. Furthermore, the prognostic signature was effective in stages T1-2, M0, and N0 subgroups but not in stages T3-4, M1, and N1-3 (). These results show that the four lncRNAs have a secure predictive effect on the prognosis of BRCA. The prognosis signature may be more applicable to early cancer.
Figure 7 Performance of the 4-lncRNA-based model in subgroups of clinicopathological features. Kaplan–Meier curves show the prognostic prediction performance in subgroups of age (A and B), tumor stage (C and D), stage T (E and F), stage M (G and H) as well as stage N (I and J).
Internal Validation with Clinical Survival Prediction Model
Next, we assessed survival analyses by subtype clinicopathological parameters. The patients were divided into two groups according to age, TNM stage, stage T, stage N or stage M. Comparison showed that the high-risk group had worse overall survival than the low-risk group, while patients from stage N1-3, stage M1, TNM stages III–IV, and age > 65 years had significantly shorter overall survival (P < 0.05) (). Kaplan–Meier plots were generated to emphasize the prognostic value of various clinical variables and confirm that the data were reasonable and effective.
Figure 8 Confirmation of prognostic value of the 4 lncRNAs in BRCA patients and independent predictive power of the lncRNA signature in breast cancer patients. (A) Survival analysis of OS based on clinicopathological parameters in patients with BRCA (B) A comparison of ROC curves with other common clinical characteristics showed the superiority of the risk score. (C) Univariate Cox analysis. (D) Multivariate Cox analysis.
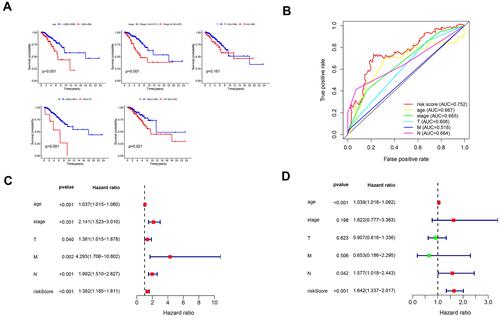
As several factors are closely related to prognosis, the AUC value of 0.752 indicates the good prognostic prediction efficacy of the model. It is no doubt significantly better than the predictive performance of conventional clinical factors such as age, tumor stage, stage T, stage M, and stage N (AUC of 0.667, 0.665, 0.608, 0.518, and 0.664, respectively) (). Univariate Cox regression analysis confirmed these observations (). The analysis explained that age, tumor stage, stage T, stage N, stage N, and corresponding risk score were considered as clinicopathological features related to overall survival. Furthermore, multivariate Cox regression analysis verified that age and risk score were independent prognostic factors associated with poor overall survival (). These results confirm that the findings of this study were based on actual signals in hypoxia-related data rather than being driven by clinical biases.
Evaluation of Infiltrative Nature of Immune Cells
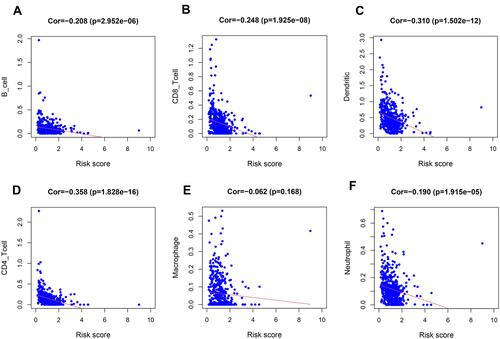
The infiltration levels of six types of immune cells were investigated to determine the relevance of the risk score and infiltrating immune cell subtypes. As expected, the high-risk group was inversely correlated with immune cell infiltration at the tumor site, such as macrophages, monocytes, and CD8+ T cells (). The negative coefficients illustrate that the lower the risk score, the greater is the immune cell infiltration. A low-risk score indicates a good chance of being accompanied by immune cell infiltration, suggesting that the prognostic signature may affect the prognosis of patients with BRCA by regulating the immune microenvironment of the tumor.
Figure 9 Relationships between the hypoxia-related prognostic model and infiltration abundances of six types of immune cells. Pearson correlation analysis was performed to determine the correlation. (A) B cells; (B) CD8+T cells; (C) dendritic cells; (D) CD4+T cells; (E) macrophages and (F) neutrophils.
Co-Expression, Correlogram, and Corresponding Expression Status
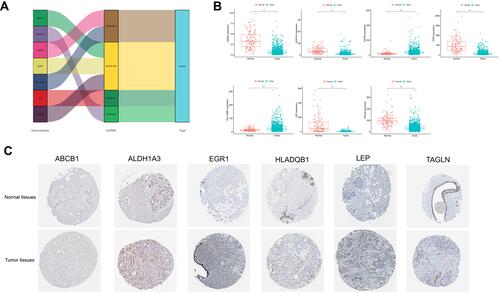
We focused on these four HR-lncRNAs to study their co-expression correlation and differential expression. Then, the Sankey plot of target lncRNAs and mRNAs was drawn (). The differential expression status of the seven HRGs comparing normal and tumor tissues, as shown in , indicates that two of seven HRGs were highly expressed in the tumor tissues and the other five were highly expressed in the normal tissues. Besides, publically available IHC staining (the Human Protein Atlas) of breast cancer and normal tissues stained with corresponding antibody were analysed: ABCB1(Antibody CAB001716), ALDH1A3(Antibody HPA046271), EGR1(Antibody CAB019427), HLADQB1(Antibody HPA013667), LEP(Antibody CAB010490) and TAGLN(Antibody HPA019467)(no data were found for CXCR4). The specific expression of the corresponding proteins in BRCA was corroborated in .
Figure 10 Verification of hypoxia-related genes expression. (A) Sankey plot (B) Hypoxia-related gene expression in tumor samples and normal tissue. (C) Validation of hypoxia-related gene expression based on the HPA database.
Discussion
Although BRCA screening methods are more commonly accepted than other screening tests, BRCA has been the most commonly diagnosed cancer in both women and men worldwide.Citation1 The metastasis and recurrence of breast tumors is the underlying cause of cancer-related fatality.Citation19 There has been a significant advancement in treatment for BRCA, including surgery and therapeutic strategies.Citation24 Metastasis is closely implicated in chemoresistance, which is a major obstacle in BRCA management. Thus, it is crucial to inhibit cancer metastasis and suppress cancer growth.
Hypoxia is a common condition reported in several cancers, with 50% to 60% of solid tumors exhibiting hypoxic regions.Citation25 This metabolic alteration acts as a driver of cancer progression. Hypoxia can enhance the expression of GLUT5, as HIF-1α is tightly associated with GLUT5 in BRCA.Citation26
The functions of lncRNAs have been debated because of their strong tissue specificity and temporal-spatial expression specificity. In recent years, lncRNAs have attracted the attention in the field of cancer research. Accumulating evidence suggests that lncRNAs are fundamental regulators of tumor development and progression.Citation27–Citation30 HIF-1α is a significant transcription factor involved in the adaptive response to hypoxia.Citation31 Several lncRNAs are regulated by hypoxia through HIF-1 α-mediated transcriptional regulation. These lncRNAs are especially sensitive to hypoxic stimulation, including the lncRNA PVT1,Citation32 lncRNA-MTA2TR,Citation30 and lncRNA HITT.Citation33 Multiple studies have shown that poor prognosis in BRCA is conducive to abnormal lncRNA expression,Citation34–Citation36 indicating the role of these lncRNAs as putative prognostic markers in BRCA.
Appropriate therapeutic decisions stem from correct judgments. At present, the classical TMN staging system is widely used to predict the prognosis of patients with BRCA.Citation37 The heterogeneity of cancer cells and the difference in tumor characteristics before and after treatment limit the efficacy of cancer prognosis prediction.Citation38–Citation40 In comparison with the TNM stage, our model can be more extensively and strongly adapted. Our retrospective study demonstrates the effectiveness and efficiency of the HR-lncRNA prognosis model in predicting the outcomes of patients with BRCA. We speculated the training group data to establish a model to predict survival, while the testing group was set up to support the theoretical activities of our model. We constructed a risk score model comprising four HR-lncRNA signatures (AL031316.1, AC004585.1, LINC01235, and ACTA2-AS1), which may favor the evaluation of BRCA prognosis with superior predictive accuracy. After controlling for clinicopathological parameters such as age and tumor stage, we proved that this biomarker signature exhibited high prediction performance. Additional information was provided from the subgroup analysis. The above analysis is suitable for early cancers but may be unsuitable for late stages.
We considered an idealized system of four molecules. The function of AL031316.1 is yet unidentified. AC004585.1 is reported to be an important component of a new optimal HR-lncRNA signatureCitation41 as well as a factor that effectively predicts survival in hepatocellular carcinoma patients with or without fibrosis.Citation42 LINC01235 is a novel lncRNA biomarker related to overall survival in gastric cancer.Citation43 Interestingly, the LINC01235-TWIST2 signalling axis plays an important role in gastric cancer metastasis, ultimately forming a positive feedback loop.Citation44 Therefore, it can be used for further development of therapeutic targets. In addition, a previous in-depth study reported LINC01235 as a cancer-related gene that mapped telomeres and centrosomes to CD274 at 9p23 in small-cell carcinoma, suggesting a possible link between LINC01235 and cancer immunoregulation.Citation45 It has been reported that lncRNA actin 2, smooth muscle antisense RNA1 (ACTA2-AS1) plays an anticancer role in liver cancerCitation46 and inhibits the progression of lung adenocarcinoma by blocking the expression of miR-378A-3P and miR-4428.Citation47 Several molecular mechanisms underlying the oncogenic role of ACTA2-AS1 have been proposed. ACTA2-AS1 is a well-known lncRNA associated with lung adenocarcinoma,Citation47 cervical cancer,Citation48 ovarian cancer, BRCA,Citation49 and liver cancer.Citation46
In summary, our study proves that HR-lncRNAs are associated with poor prognosis and short overall survival. The lncRNA landscape of BRCA reveals that these lncRNAs are likely to be potential targets for future cancer therapies. In this direction, antioxidant interventions can serve as an effective strategy for treating patients with BRCA.
There are some inherent limitations and weaknesses of this study that should be recognized. First, public databases such as TCGA are not specifically designed for prediction assessment and may lack some characteristics that result in discrepancies in model performance. Second, there was no relevant basic experiment to measure the levels of the identified HR-lncRNAs in cell lines or clinical tissues. Furthermore, no external validation was performed to support the study findings, as there was no specific clinical data in the GEO database. Whether the results can be extrapolated to other cancers is yet unclear. Therefore, multicenter studies with larger sample sizes are warranted for future clinical applications.
Acknowledgment
We would like to acknowledge the TCGA database.
Disclosure
The authors report no conflicts of interest in this work.
References
- Siegel RL, Miller KD, Fuchs HE, et al. Cancer statistics, 2021. CA Cancer J Clin. 2021;71(1):7–33.
- Schoppmann SF, Bayer G, Aumayr K, et al. Prognostic value of lymphangiogenesis and lymphovascular invasion in invasive breast cancer. Ann Surg. 2004;240(2):306–312.
- Spizzo G, Gastl G, Wolf D, et al. Correlation of COX-2 and Ep-CAM overexpression in human invasive breast cancer and its impact on survival. Br J Cancer. 2003;88(4):574–578.
- Spizzo G, Obrist P, Ensinger C, et al. Prognostic significance of Ep-CAM AND Her-2/neu overexpression in invasive breast cancer. Int J Cancer. 2002;98(6):883–888.
- Semenza GL. Hypoxia-inducible factors: mediators of cancer progression and targets for cancer therapy. Trends Pharmacol Sci. 2012;33(4):207–214.
- Liang X, Arullampalam P, Yang Z, et al. Hypoxia enhances endothelial intercellular adhesion molecule 1 protein level through upregulation of arginase type ii and mitochondrial oxidative stress. Front Physiol. 2019;10:1003.
- Harris AL. Hypoxia–a key regulatory factor in tumour growth. Nat Rev Cancer. 2002;2(1):38–47.
- Schito L, Rey S, Tafani M, et al. Hypoxia-inducible factor 1-dependent expression of platelet-derived growth factor B promotes lymphatic metastasis of hypoxic breast cancer cells. Proc Natl Acad Sci U S A. 2012;109(40):E2707–16.
- Zhang H, Wong CC, Wei H, et al. HIF-1-dependent expression of angiopoietin-like 4 and L1CAM mediates vascular metastasis of hypoxic breast cancer cells to the lungs. Oncogene. 2012;31(14):1757–1770.
- Wong CC, Zhang H, Gilkes DM, et al. Inhibitors of hypoxia-inducible factor 1 block breast cancer metastatic niche formation and lung metastasis. J Mol Med (Berl). 2012;90(7):803–815.
- Xiang L, Gilkes DM, Chaturvedi P, et al. Ganetespib blocks HIF-1 activity and inhibits tumor growth, vascularization, stem cell maintenance, invasion, and metastasis in orthotopic mouse models of triple-negative breast cancer. J Mol Med (Berl). 2014;92(2):151–164.
- Semenza GL. The hypoxic tumor microenvironment: a driving force for breast cancer progression. Biochim Biophys Acta. 2016;1863(3):382–391.
- Jathar S, Kumar V, Srivastava J, et al. Technological developments in lncRNA biology. Adv Exp Med Biol. 2017;1008:283–323.
- Kapranov P, Cheng J, Dike S, et al. RNA maps reveal new RNA classes and a possible function for pervasive transcription. Science. 2007;316(5830):1484–1488.
- Deveson IW, Hardwick SA, Mercer TR, et al. The dimensions, dynamics, and relevance of the mammalian noncoding transcriptome. Trends Genet. 2017;33(7):464–478.
- Chakravarty D, Sboner A, Nair SS, et al. The oestrogen receptor alpha-regulated lncRNA NEAT1 is a critical modulator of prostate cancer. Nat Commun. 2014;5:5383.
- Jakubik D, Fitas A, Eyileten C, et al. MicroRNAs and long non-coding RNAs in the pathophysiological processes of diabetic cardiomyopathy: emerging biomarkers and potential therapeutics. Cardiovasc Diabetol. 2021;20(1):55.
- Wapinski O, Chang HY. Long noncoding RNAs and human disease. Trends Cell Biol. 2011;21(6):354–361.
- Flemban A, Qualtrough D. The potential role of hedgehog signaling in the luminal/basal phenotype of breast epithelia and in breast cancer invasion and metastasis. Cancers (Basel). 2015;7(3):1863–1884.
- Chen Q, Hu L, Chen K. Construction of a nomogram based on a hypoxia-related lncrna signature to improve the prediction of gastric cancer prognosis. Front Genet. 2020;11:570325.
- Zhang F, Wang X, Hu H, et al. A hypoxia related long non-coding RNA signature could accurately predict survival outcomes in patients with bladder cancer. Bioengineered. 2021;12(1):3802–3823.
- Zhang H, Qin C, Liu HW, et al. An effective hypoxia-related long non-coding RNAs assessment model for prognosis of clear cell renal carcinoma. Front Oncol. 2021;11:616722.
- Uhlen M, Zhang C, Lee S, et al. A pathology atlas of the human cancer transcriptome. Science. 2017;357:6352.
- Elkin EB, Klem ML, Gonzales AM, et al. Characteristics and outcomes of breast cancer in women with and without a history of radiation for Hodgkin’s lymphoma: a multi-institutional, matched cohort study. J Clin Oncol. 2011;29(18):2466–2473.
- Laasik M, Hynninen J, Forsback S, et al. The feasibility of [(18)F]EF5-PET/CT to image hypoxia in ovarian tumors: a clinical study. EJNMMI Res. 2020;10(1):103.
- Chen WL, Jin X, Wang M, et al. GLUT5-mediated fructose utilization drives lung cancer growth by stimulating fatty acid synthesis and AMPK/mTORC1 signaling. JCI Insight. 2020;5:3.
- Zhou F, Shen F, Zheng Z, et al. The LncRNA XIRP2-AS1 predicts favorable prognosis in colon cancer. Onco Targets Ther. 2019;12:5767–5778.
- Sun W, Zu Y, Fu X, et al. Knockdown of lncRNA-XIST enhances the chemosensitivity of NSCLC cells via suppression of autophagy. Oncol Rep. 2017;38(6):3347–3354.
- Wu D, Li Y, Zhang H, et al. Knockdown of Lncrna PVT1 enhances radiosensitivity in non-small cell lung cancer by sponging Mir-195. Cell Physiol Biochem. 2017;42(6):2453–2466.
- Zeng Z, Xu FY, Zheng H, et al. LncRNA-MTA2TR functions as a promoter in pancreatic cancer via driving deacetylation-dependent accumulation of HIF-1alpha. Theranostics. 2019;9(18):5298–5314.
- Chen KC, Chen CR, Chen CY, et al. Bicalutamide elicits renal damage by causing mitochondrial dysfunction via ROS damage and upregulation of HIF-1. Int J Mol Sci. 2020;21:9.
- Wang C, Han C, Zhang Y, et al. LncRNA PVT1 regulate expression of HIF1alpha via functioning as ceRNA for miR199a5p in nonsmall cell lung cancer under hypoxia. Mol Med Rep. 2018;17(1):1105–1110.
- Wang X, Li L, Zhao K, et al. A novel LncRNA HITT forms a regulatory loop with HIF-1alpha to modulate angiogenesis and tumor growth. Cell Death Differ. 2020;27(4):1431–1446.
- Betts JA, Moradi Marjaneh M, Al-Ejeh F, et al. Long noncoding RNAs CUPID1 and CUPID2 mediate breast cancer risk at 11q13 by modulating the response to DNA damage. Am J Hum Genet. 2017;101(2):255–266.
- Sun M, Gadad SS, Kim DS, et al. Discovery, annotation, and functional analysis of long noncoding RNAs controlling cell-cycle gene expression and proliferation in breast cancer cells. Mol Cell. 2015;59(4):698–711.
- Heilmann K, Toth R, Bossmann C, et al. Genome-wide screen for differentially methylated long noncoding RNAs identifies Esrp2 and lncRNA Esrp2-as regulated by enhancer DNA methylation with prognostic relevance for human breast cancer. Oncogene. 2017;36(46):6446–6461.
- Veeratterapillay R, Simren R, El-Sherif A, et al. Accuracy of the revised 2010 TNM classification in predicting the prognosis of patients treated for renal cell cancer in the north east of England. J Clin Pathol. 2012;65(4):367–371.
- Janku F. Tumor heterogeneity in the clinic: is it a real problem? Ther Adv Med Oncol. 2014;6(2):43–51.
- Meacham CE, Morrison SJ. Tumour heterogeneity and cancer cell plasticity. Nature. 2013;501(7467):328–337.
- Aoki M, Shoji H, Kashiro A, et al. Prospects for comprehensive analyses of circulating tumor cells in tumor biology. Cancers (Basel). 2020;12:5.
- Lai J, Chen B, Zhang G, et al. Molecular characterization of breast cancer: a potential novel immune-related lncRNAs signature. J Transl Med. 2020;18(1):416.
- Ye J, Wu S, Pan S, et al. Risk scoring based on expression of long noncoding RNAs can effectively predict survival in hepatocellular carcinoma patients with or without fibrosis. Oncol Rep. 2020;43(5):1451–1466.
- Zhang X, Zheng P, Li Z, et al. The somatic mutation landscape and RNA prognostic markers in stomach adenocarcinoma. Onco Targets Ther. 2020;13:7735–7746.
- Tan YE, Xing Y, Ran BL, et al. LINC01235-TWIST2 feedback loop facilitates epithelial-mesenchymal transition in gastric cancer by inhibiting THBS2. Aging (Albany NY). 2020;12(24):25060–25075.
- Vishnubalaji R, Shaath H, Elkord E, et al. Long non-coding RNA (lncRNA) transcriptional landscape in breast cancer identifies LINC01614 as non-favorable prognostic biomarker regulated by TGFbeta and focal adhesion kinase (FAK) signaling. Cell Death Discov. 2019;5:109.
- Pan YF, Su T, Chen LD, et al. Differential expression of genes in HepG2 cells caused by UC001kfo RNAi as shown by RNA-seq. J Huazhong Univ Sci Technolog Med Sci. 2017;37(4):510–515.
- Ying K, Wang L, Long G, et al. ACTA2-AS1 suppresses lung adenocarcinoma progression via sequestering miR-378a-3p and miR-4428 to elevate SOX7 expression. Cell Biol Int. 2020;44(12):2438–2449.
- Luo L, Wang M, Li X, et al. A novel mechanism by which ACTA2-AS1 promotes cervical cancer progression: acting as a ceRNA of miR-143-3p to regulate SMAD3 expression. Cancer Cell Int. 2020;20:372.
- Li N, Zhan X. Identification of clinical trait-related lncRNA and mRNA biomarkers with weighted gene co-expression network analysis as useful tool for personalized medicine in ovarian cancer. EPMA J. 2019;10(3):273–290.