
Abstract
Background
The aim of this study was to screen and identify immunoautophagy-related genes (IARGs) in HCC patients and clarify their potential prognostic value in HCC patients.
Methods
Immune-related genes and autophagy-related gene were downloaded from public databases. Cox regression analysis was used to selected several immunoautophagy-related genes to establish a prognostic model, and patients were divided into high- and low-risk groups based on median risk score. We analyzed the overall survival and clinicopathological characteristics between two groups. Meanwhile, internal validation dataset and external ICGC dataset were used to verify robustness of the model. Associations between six immune cells infiltrates and risk score were analyzed.
Results
A prognostic model was established based on CANX and HDAC1. The prognoses of the high-risk group were worse than low-risk group in both TCGA and ICGC datasets. Multivariate Cox regression analysis showed that risk score was an independent prognostic factor for HCC patients. Results showed that the risk score in young group was higher than elderly group. Patients with poorly differentiated tumor may have high risk score and poor survival. The score was positively correlated with immune cells.
Conclusion
Our study shows that immunoautophagy-related genes have potential prognostic value for patients with HCC and may provide new information and direction for targeted therapy.
Introduction
Hepatocellular carcinoma (HCC) is the second deadliest cancer worldwide, due to its high incidence and poor prognosis. As an immune organ, liver is associated with a variety of immune cells and receives blood both the hepatic artery and portal vein. The innate and adaptive immune system play a key role in carcinogenesis of HCC by supporting tumor growth, survival, angiogenesis and motility.Citation1 The immune cells within the tumor microenvironment (TME) play important roles in tumorigenesis. Various immune cells might function as a tumor inhibitor or promoter in HCC.Citation2 The antigenicity of tumor contributes to the attraction of tumor-infiltrating lymphocytes, and immune cells also shape the antigenicity of tumors.Citation3 Given its high vascularization and immunogenicity, immune therapies such as anti-CTLA-4 (cytotoxic T lymphocyte antigen-4), anti-PD-1 (programmed cell death-1), and anti-PD-L1 (programmed death-ligand 1) strategies have shown efficacy in HCC.Citation4 While some immune checkpoint inhibitor including pembrolizumab, nivolumab failed to show expected efficacy in clinical trial.Citation5 Thus, HCC might have a complex immune status, and more studies are required to understand its underlying mechanisms.
Autophagy, or cellular “self-eating” is a highly conserved lysosomal pathway that involves in regulation of macromolecules’ recycling and maintains homeostasis and survival.Citation6 Besides, it is also involved in preventing certain types of disease, including cancer, muscular disorders, and neurodegeneration, such as Huntington’s, Alzheimer’s, and Parkinson’s diseases.Citation7 It serves as a double-edged sword in tumorigenesis and metastasis. Therefore, an optimal combination of autophagy inhibition and promotion, according to the properties of the cancer, is needed. Autophagy can be involved in innate and adaptive immune tolerance at multiple levels.Citation8 Studies found autophagy could inhibit cancer development by orchestrating inflammation and immunity.Citation9 And autophagy also plays an important role in the pathogenesis of HCC. Autophagy levels in HCC tumor tissues are noticeably higher adjacent normal tissues. What’s more, autophagy could promote HCC cell proliferation and invasion.Citation10
Thus, the combination of autophagy and immunotherapy may provide us with a promising strategy for tumor treatment, requires further study. However, few previous studies have established some prognosis model of HCC based on immune-related genesCitation11,Citation12 or autophagy-related genes,Citation13,Citation14 but no studies have explored the relationship between immunoautophagy-related genes and investigate its prognosis of HCC. With the currently available autophagy-related genes (ARGs) and immune-related genes (IRGs), and the accumulative data deposited in public databases, it is hypothesized that a prognostic signature based on the immune response and autophagy might help to identify HCC patients’ survival profile. This study aims to establish a risk prognosis model based on immune-autophagy-related genes (IARGs) in HCC so as to provide a new target for future anti-cancer therapy.
Materials and Methods
Data Collection
The RNA-seq expression data and clinical data of HCC patient samples were downloaded from the TCGA data portal (TCGA-LIHC cohort). For validation, the gene expression data and the corresponding clinical data of LIRI-JP cohort were downloaded from the ICGC data portal. All databases are open-access and the present study followed the data access policy and publishing guidelines of these databases. There was no need for ethics approval. What’s more, we downloaded the immune-related genes (IRGs) from the ImmPort database (https://www.immport.org/shared/home)Citation15 and autophagy-related genes from the Human Autophagy Database (HADb, http://www.autophagy.lu/index.html).Citation16
Identification of Differentially Expressed Gene (DEGs)
The “limma” package in R was used to normalize the data and Pearson correlation was used to calculate the correlation between the expression of DEGs in HCC patients.Citation17,Citation18 Differentially expressed genes of HCC and normal liver tissues with an absolute log2 fold change (FC) >1 and an adjusted p value < 0.05 were considered for subsequent analysis.Citation19 And they were visualized by “pheatmap”, “ggplot2” and “ggpubr” package.
Functional Enrichment Analyses
DEGs were subjected to Gene Ontology (GO) term (biological processes, molecular function, and cellular component) enrichment and Kyoto Encyclopedia of Genes and Genomes (KEGG) pathway analysis using the “clusterprofiler” package in R.Citation20 Significance was defined as P < 0.05, and data were graphically visualized by “GOplot” package.
Development and Validation of the Prognostic Signature
The DEGs expression profile and clinical datum were incorporated into the complete dataset and further randomly divided into training dataset and test dataset, using “caret” package.Citation21 The survival-related immunoautophagy related genes decided by univariate Cox analysis and Kaplan–Meier (K-M) analysis in training set were selected as candidate prognostic genes. Then multivariate Cox regression analysis was used to establish an optimal prognostic signature.Citation19 The risk score was calculated for each tumor sample based on the relative expression of each IARG and its correlation coefficient, using the following formula: Risk Score=∑i = 1 (coefi* Expr i), where coefi is the multivariate Cox coefficient of IARGsi and Expr i is the relative expression of the IARGsi.
Patients in TCGA training set, test set and ICGC dataset were divided into low- and high-risk groups based on the median value of risk score in the TCGA training set. Kaplan–Meier survival analysis was carried out,Citation22 and the prognostic value of the prediction model was evaluated based on the area under the time-dependent receiver operating characteristic (ROC) curve (AUC) using the “survivalROC” packageCitation23 and concordance index (c-index) by “Hmisc” package.Citation24
Independence of the Prognostic Signature
Univariate and multivariate Cox Regression analyses were applied to prove the independent nature of the signature with clinical characteristics such as age, sex, tumor grade and pathological TNM stage in training dataset.Citation19 The 95% confidence intervals (CIs) and the hazard ratios (HRs) were calculated and forest plots were constructed to display the relation between risk score and different clinical factor. A p -value < 0.05 was considered statistically significant.
Correlation Between the Signature and Clinicopathological Characteristics
The correlation between clinicopathological characteristics and the prognostic signature were analyzed. T-test or Kruskal–Wallis test was used to analyze statistical significance.Citation25 Statistical significance was defined as p < 0.05.
Immune Infiltrates Correlation Analysis
Associations between six immune cells infiltrates and risk score were analyzed and visualized using R.Citation26 we downloaded the abundances of immune cells in HCC patients from the Tumor Immune Estimation Resource (TIMER) online database (timer.cistrome.org).Citation27 The correlation index cor and the corresponding p -value were plotted.
Results
Identification of Differentially Expressed IARGs
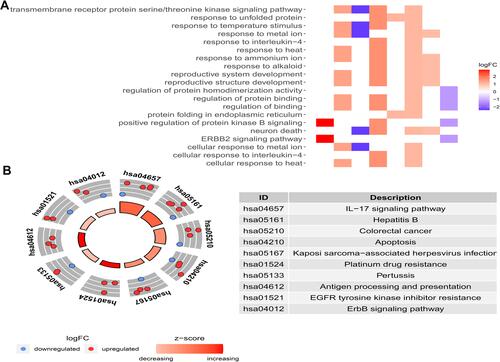
showed our article structure. RNA-seq and clinical data of 374 HCC tissue samples and 50 non-tumor samples were downloaded from TCGA. We identified 7647 DEGs, including 11 IARGs ( and ). In addition, the expression patterns of 11 differentially expressed IAR-genes in HCC and non-tumor tissues were shown in the box diagram (). From the box diagram, 9 up-regulated genes (CANX, HSPA5, HSP90AB1, IKBKE, MAPK3, HDAC1, BIRC5, NRG2, CASP3) and 2 down-regulated genes (FOS, NRG1) could be directly observed. The IARGs were mostly enriched for GO terms related to positive regulation of protein kinase B signaling and ERBB2 signaling pathway. IL-17 signaling and Hepatitis B were the most frequently identified KEGG pathway ().
Figure 1 (A) Study workflow of our analysis; (B) expression heatmap of differentially expressed IARGs in TCGA dataset. (C) Volcano plots of the differentially expressed IARGs (red and green nodes represent gene expression upregulation and downregulation). (D) Visualization of 11 differentially expressed IARGs in a box diagram.
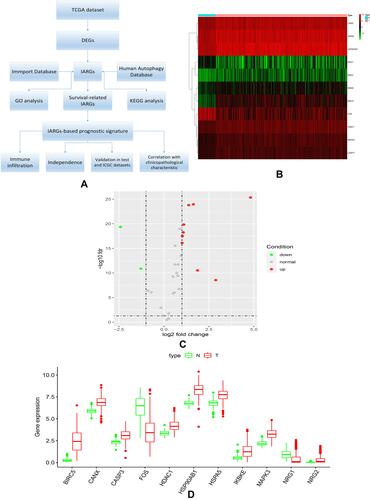
Figure 2 (A) Heatmap of the GO enrichment results. The color of each module depends on its corresponding log FC values; (B) KEGG analysis of differentially expressed IARGs. A scatter plot for each term of the log fold change (FC) of the assigned genes was shown with the outer circle. The red and blue circles indicate upregulation and downregulation, respectively.
Construction of Prognostic Signature with Two Genes
The expression data and clinical features of those IARGs were further integrated into a complete dataset and patient samples were randomly divided into training (75%, n=278) and test (25%, n=92) sets (4 patients has repetitive samples were excluded in the subsequent analysis).
Univariate Cox regression analysis and K-M analysis were performed on the data from the training set to investigate the correlation between differentially expressed IARGs and OS in patients with HCC. It was found that 7 genes were significantly correlated with OS in patients with HCC when p < 0.05. Then, multivariate Cox regression analysis was performed to construct an optimal prognostic signature. The final prognostic signature consisted of two genes. The predictive model was based on the linear combination of the expression levels of the two genes weighted by the relative coefficients in multiple Cox regression, as follows: risk score = (0.00325 × expression level of CANX) + (0.03955 × expression level of HDAC1). Both genes have high-risk characteristics since genes showed a positive coefficient in Cox regression analysis. Thus, their elevated expression is associated with shorter OS.
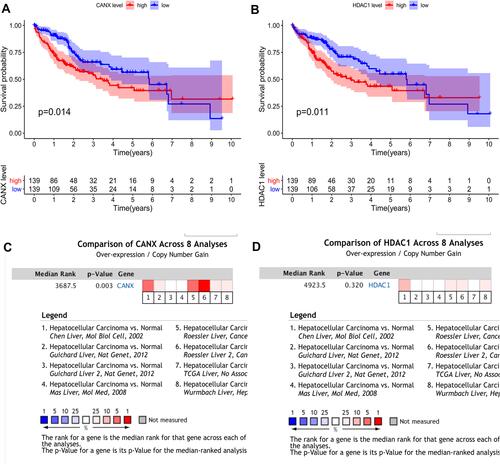
In the training set, we were divided into high expression group and low expression group by the median expression of each gene, and the K-M survival curve was plotted ( and ). K-M analysis showed that the expression of CANX and HDAC1 was closely related to OS in HCC patients (p =0.014, p =0.011). In addition, we also searched the Oncomine databaseCitation28 and found that the mRNA expression level of CANX in HCC tissues were significantly higher than those in normal tissuesCitation29 ( and ), while the difference of HDAC1 expression level was not significant. But OS of patients with elevated expression of CANX and HDAC1 were significantly lower than that of patients with low expression.
Figure 3 Differential expression of two genes and their relationship with prognosis in HCC patients in TCGA training dataset. KM survival analysis of high- and low-risk groups based on the expression of CANX (A) and HDAC1 (B). Differences in CANX (C) and HDAC1 (D) expression between HCC and normal tissues.
Validation of Prognostic Role of Gene Signature
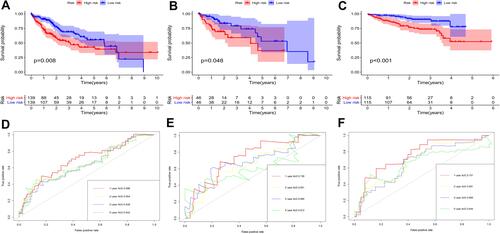
According to the signature we obtained, patients in the training set were divided into high- and low-risk groups according to the median value of risk score, and we visualized the number of patients, survival, and heatmap of the two gene expression profiles in different risk groups in the training set (). The K-M curve we draw indicating significant differences (p < 0.008, ). ROC curve analysis showed that the 1-year, 2-year, 3-year, and 5-year AUC of our signature were 0.696, 0.654, 0.639, and 0.642 (), indicating the good prognostic efficacy of the model. In the meanwhile, we used internal dataset (test set) and external dataset (ICGC dataset) to evaluate the predictive value of the prognostic signature ( and ). The 1-year, 2-year, 3-year, and 5-year ROC in TCGA test set (), ICGC dataset () were 0.728, 0.651, 0.685 and 0.612; 0.757, 0.681, 0.669 and 0.644. Corresponding with the results of the training set, high-risk group HCC patients in the test set and the ICGC dataset were related to poor OS (p =0.048, p < 0.001). The c-index of TCGA training set, test set and ICGC dataset were 0.602, 0.622 and 0.640, respectively.
Figure 4 Rank of prognostic index and distribution of groups (A), survival status of patients in different groups (B), and expression heatmap of the two genes included (C).
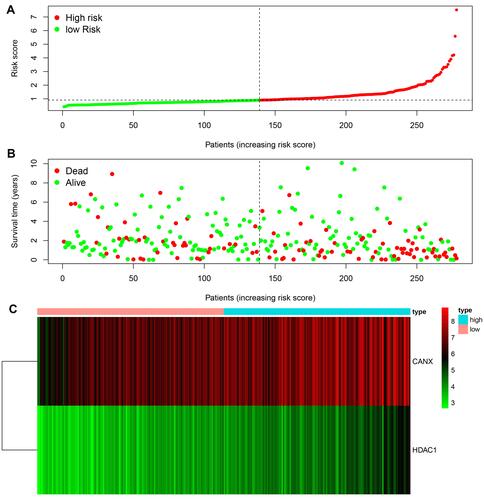
Figure 5 KM survival analysis of high- and low-risk groups in training set (A), test set (B), ICGC dataset (C); the 1, 2, 3, 5-year ROC in TCGA training set (D), test set (E), ICGC dataset (F).
Clinical Utility of the Prognostic Signature
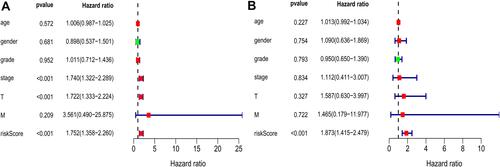
Univariate and multivariate Cox regression analyses were performed on 203 HCC patients with complete clinical data in the training set to evaluate the independent predictive value of the relative clinical data and the prognostic signature. Univariate Cox regression analysis showed that age, clinical stage, tumor size and risk score had certain prognostic value. Multivariate Cox regression analysis showed that risk score was an independent prognostic factor for OS (HR = 1.752, 95% CI, 1.358–2.260, p < 0.001) ().
Figure 6 Univariate (A) and multivariate (B) Cox regression analyses demonstrated that the prognostic model was independently associated with the OS of HCC patients.
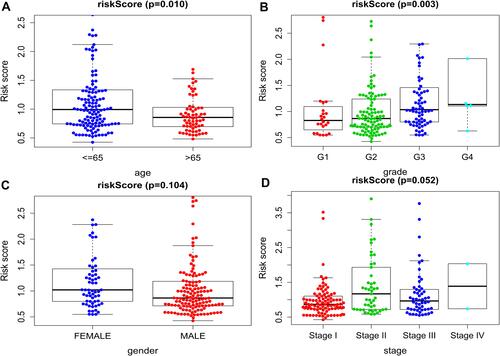
We also discussed the relationship between clinicopathological characters and the prognostic model. After divided patients into the young group (≤65 years) and the elderly group (>65 years), the results showed that the risk score in young group was higher than those in elderly group (p =0.010, ). And the score of patients with higher pathological grade was higher than that of patients with lower pathological grade (p =0.003, ). This indicated that patients with poorly differentiated tumors have poor prognosis. However, no difference was found between risk score and gender (p =0.104, ), or TNM stage (p = 0.052, ).
Figure 7 Clinicopathological correlation of risk score in HCC. Risk score according to (A) age, (B) histological grade, (C) gender, (D) stage.
Validation of the Immune Correlation
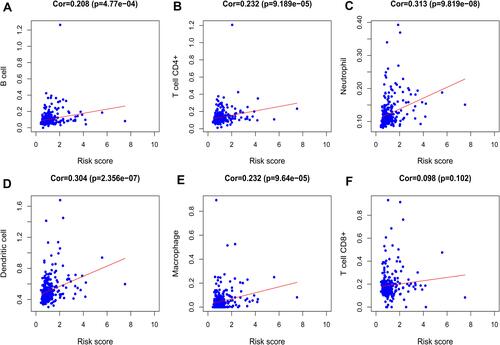
We analyzed the relationship between the signature and immune cell infiltration to determine whether it can accurately reflect the immune microenvironment of HCC. The signature was positively correlated with B cells, CD4 T cells, neutrophils, macrophages, and dendritic cells ().
Figure 8 Relationships between the signature and immune cell infiltration. Correlations were determined by Pearson correlation analysis. (A) B cells; (B) CD4 T cells; (C) neutrophil; (D) dendritic; (E) macrophages; (F) CD8 T cells.
Discussion
The occurrence of liver cancer is related to genetic, environment, lifestyle and other factors, which makes diagnosis and prevention of liver cancer become difficult. For the treatment of liver cancer, the study of the pathogenesis has become more and more important. The occurrence and development of HCC involve many aspects such as proliferation, apoptosis, autophagy and invasion. Disorders of the immune system lead to the escape of the tumor from the immune and promote tumor pathogenesis. HCC is a highly inflammation-related tumor that develops along with inflammation. Immunotherapy has appeared as an attractive option for improving outcome for advanced hepatocellular carcinoma, including Anti-CTLA-4, Anti-PD-1, Anti-PD-L1, Cytotoxic agents or combinations of these therapies.Citation4
Currently, autophagy is thought to play a dual role in HCC. During tumor initiation, autophagy inhibits the transformation of normal cells to tumor cells by removing damaged proteins, DNA and necrotic organelles. While in the advanced stages of cancer, autophagy provides a large amount of nutrients and energy for tumor cells, which enables tumor cells to withstand the harsh tumor microenvironment, resist necrosis, inflammation and pressure of chemotherapy or radiotherapy, and promote tumor cells survive and grow.Citation30,Citation31 It may promote tumor metastasis and invasion.Citation32 Thus, within the same cancer, both inhibition and promotion of autophagy may be beneficial. It also play tumor-suppression function by inhibiting the “inflammation-carcinogenesis” pathway in liver.Citation33 Autophagy can regulate inflammation and inflammatory cytokines play a different role in autophagy as well. Since the intricate relationship between autophagy and immunity, investigating the mechanism of autophagy interfere with the function of inflammation in HCC may provide a new target for immunotherapy of liver cancer.
Wang et al built a nine-gene prognostic model that showed a good performance for HCC prognosis prediction.Citation11 Another study developed an eight-gene model based on the immune expression profile.Citation12 In the meanwhile, several studies also constructed prognostic signatures for HCC overall survival prediction based on autophagy-associated genes.Citation13,Citation14 These prognostic models could serve as predictor for survival and play key roles in tumor microenvironment. In order to identify potential biomarkers, we used the TCGA database to analyze differences in immunoautophagy-related gene expression between HCC and normal tissues in our study. We first screened out 11 differentially expressed IARGs. Considering that these genes may be closely related to the development and growth of HCC, we performed GO and KEGG enrichment analyses. The results showed that the 11 DEGs were mostly enriched for GO terms related to positive regulation of protein kinase B signaling and ERBB2 signaling pathway. KEGG enrichment showed that genes were particularly enriched in the IL-17 signaling and hepatitis B pathways. As the member of human epidermal growth factor receptor (EGFR) family, Erb-B2 Receptor Tyrosine Kinase 2 (ERBB2) is subjected to an additional layer of regulation mediated by the molecular chaperone HSP90. The ERBB receptors could engage different downstream signaling modules, such as Ras/Raf/MAPK and phosphatidylinositol 3-kinase (PI3K)/AKT pathways.Citation34 The mitogen-activated protein kinases (MAPK) signaling pathway was related to the autophagy pathway in cancer,Citation35,Citation36 which provided insights for a potential therapeutic strategy. Song et al found that activated the MAPK signaling pathway could block the development of liver fibrosis by enhancing cell apoptosis and reducing autophagy.Citation37 Most HCCs (80–90%) develop on underlying chronic liver disease, the main causes include chronic hepatitis B virus (HBV) or hepatitis C virus (HCV) infections. In South-East Asia and Central Africa, the endemic prevalence of chronic HBV infections accounts for 70% of HCC.Citation38 IL-17 signaling pathway as an inflammation-related pathway, the regulatory potential of it makes it a compelling target in cancer immunotherapy.Citation39
We identified 7 survival related IARGs through univariate cox regression analysis and KM analysis. Then, we used multivariate cox regression analysis to determine two key IARGs: CANX and HDAC1, and established a prognosis model. Overexpression of CANX and HDAC1 was also found in HCC samples and elevated expression of both genes was associated with poor prognosis in HCC patients. Based on the risk score of our model, HCC patients in different datasets were divided into high-risk and low-risk groups, respectively. High-risk group patients were associated with worse prognosis. Our study demonstrated that risk score of the prognostic model was an independent prognostic factor for HCC patients. Doctor can adjust the treatment plan of patients according to the model. For patients at high risk, more aggressive treatment strategies are recommended. Further analysis found that age and pathological grade were correlated with risk score. Patients with poorly differentiated tumor may have high risk score and poor survival according this model. Abnormal differentiation is the main characteristic of tumor cells. Poorer differentiation status indicates worse prognosis of HCC patients, which is corresponded with our result.
Calnexin (CANX), an essential endoplasmic reticulum (ER) chaperone protein that prevents the aggregation and export of incompletely folded proteins from the ER, is involved in the metastatic progression of tumors.Citation40 CANX was revealed to inhibit the proliferation and activation of CD4+T and CD8+T cells, and may impair the anti-tumor immunity of CD4+ and CD8+ T Cells by upregulating the expression of PD-1 in oral squamous cancer.Citation41 Okayama et al reported that CANX played an important role in tumor invasion and metastasis, indicating poor prognosis of lung adenocarcinoma patient.Citation42 Kobayashi et al subsequently suggested CANX expression could detect early lung cancer as its level was significantly higher in lung cancer patients.Citation43 Ryan et al found depletion of Calnexin gene reduced tumor cell survival and increased colorectal cancer cells susceptibility to 5-FU chemotherapy.Citation44 Extracellular matrix (ECM) is a physical barrier to the growth of HCC. Tumor growth and invasiveness could be induced by ECM degradation. Ros et al revealed that CANX complexes in cell surface may reduce extracellular disulfide bonds and are essential for ECM degradation. And they found anti-CANX antibody could prevent lung metastasis from endogenous liver tumours.Citation45 This indicates that CANX is a potential target for HCC treatment.
Histone deacetylase 1 (HDAC1) can antagonize the acetylation of histones proteins. Studies shows that HDAC1 is over-expressed in many tumors including lung carcinoma, glioma, renal cell cancer, gastric cancer, prostate cancer and colorectal cancerCitation46–Citation50 and is associated with prognostic outcomes of patient. HDAC inhibitors could induce cell-cycle arrest, promote differentiation, sensitize cancer cells to DNA damaging therapies and stimulate tumor cell death.Citation51,Citation52 Consisting with this discovery, Zhang found that downregulation of HDAC1 inhibited cell proliferation, prevented cell migration, decreased cell invasion, reduced tumor angiogenesis and induced cell apoptosis in non-small cell lung cancer cells.Citation53 Yoo et al discovered a positive cross talk between HBx and the MTA1/HDAC 1/2 complex in stabilizing HIF-1 alpha, which may play a vital role in angiogenesis and metastasis of HBV-associated HCC.Citation54 Ler et al found that mortality was also increased with high HDAC1 expression in hepatocellular carcinoma among a South East Asian population.Citation55 While the roles and molecular mechanisms of HDAC1 in HCC is still limited. What’s more, further studies should be performed to reveal the relationship between CANX and HDAC1 in HCC.
Tumors are evolving under the pressure of TME, and interaction between tumor and the immune system plays crucial parts. To characterize the tumor immune microenvironment status, the relationships between immune-related prognostic signature and immune cell infiltration were investigated. Our study found that B-cells, CD4 T-cells, dendritic cells, neutrophil and macrophage displayed positive correlation with IARGs prognostic model, revealing that the model may serve as predictor for increased immune cells infiltration. It may be a promising way to anti-HCC by better understanding of the role of immune cells. While the clinical relevance of HCC neoantigens and their interactions with immune microenvironment still remains unknown.
However, this study also has some limitations. This study is a retrospective study with data from the TCGA and ICGC databases, so there may be selection bias. Thus, a further well-designed prospective analysis is necessary to validate the value of the novel model. And researches are needed to reveal the function of the model gene and its exact molecular mechanism.
Conclusion
Based on bioinformatics analysis of large-scale data, we identified differentially expressed IARGs in HCC, and we developed a prognostic model. This model could be used for prognostic prediction and the selection of patients for immunotherapies and targeted therapies.
Disclosure
The authors declare no competing interests.
References
- Schmidt N, Thimme R. Role of immunity in pathogenesis and treatment of hepatocellular carcinoma. Dig Dis. 2016;34(4):429–437. doi:10.1159/000444558
- Lei X, Lei Y, Li J-K, et al. Immune cells within the tumor microenvironment: biological functions and roles in cancer immunotherapy. Cancer Lett. 2020;470:126–133. doi:10.1016/j.canlet.2019.11.009
- Li Z, Chen G, Cai Z, et al. Profiling of hepatocellular carcinoma neoantigens reveals immune microenvironment and clonal evolution related patterns. Chin J Cancer Res. 2021;33(3):364–378. doi:10.21147/j.issn.1000-9604.2021.03.08
- Hilmi M, Neuzillet C, Calderaro J, Lafdil F, Pawlotsky J-M, Rousseau B. Angiogenesis and immune checkpoint inhibitors as therapies for hepatocellular carcinoma: current knowledge and future research directions. J Immunother Cancer. 2019;7(1):333. doi:10.1186/s40425-019-0824-5
- Liu Y, Zhang X, Zhang J, Tan J, Li J, Song Z. Development and validation of a combined ferroptosis and immune prognostic classifier for hepatocellular carcinoma. Front Cell Dev Biol. 2020;8:1716. doi:10.3389/fcell.2020.596679
- Jiang X, Overholtzer M, Thompson CB. Autophagy in cellular metabolism and cancer. J Clin Invest. 2015;125(1):47–54. doi:10.1172/JCI73942
- Yorimitsu T, Klionsky DJ. Autophagy: molecular machinery for self-eating. Cell Death Differ. 2005;12(Suppl 2):1542–1552. doi:10.1038/sj.cdd.4401765
- Wu Y-X, Jin S-H, Cui J. Autophagy and Immune Tolerance. Adv Exp Med Biol. 2019;1206:635–665. doi:10.1007/978-981-15-0602-4_28
- Zhong Z, Sanchez-Lopez E, Karin M. Autophagy, inflammation, and immunity: a troika governing cancer and its treatment. Cell. 2016;166(2):288–298. doi:10.1016/j.cell.2016.05.051
- Jiao S, Li G, Zhang D, Xu Y, Liu J, Li G. Anatomic versus non-anatomic resection for hepatocellular carcinoma, do we have an answer? A meta-analysis. Int J Surg. 2020;80:243–255. doi:10.1016/j.ijsu.2020.05.008
- Wang Z, Zhu J, Liu Y, et al. Development and validation of a novel immune-related prognostic model in hepatocellular carcinoma. J Transl Med. 2020;18(1):67. doi:10.1186/s12967-020-02255-6
- Xu D, Wang Y, Zhou K, et al. Development and validation of a novel 8 immune gene prognostic signature based on the immune expression profile for hepatocellular carcinoma. Onco Targets Ther. 2020;13:8125–8140. doi:10.2147/OTT.S263047
- Fang Q, Chen H. Development of a novel autophagy-related prognostic signature and nomogram for hepatocellular carcinoma. Front Oncol. 2020;10:591356. doi:10.3389/fonc.2020.591356
- Yang W, Niu L, Zhao X, et al. Development and validation of a survival model based on autophagy-associated genes for predicting prognosis of hepatocellular carcinoma. Am J Transl Res. 2020;12(10):6705–6722.
- Bhattacharya S, Andorf S, Gomes L, et al. ImmPort: disseminating data to the public for the future of immunology. Immunol Res. 2014;58(2–3):234–239. doi:10.1007/s12026-014-8516-1
- Xu J, Dai S, Yuan Y, Xiao Q, Ding K, Prognostic A. Model for colon cancer patients based on eight signature autophagy genes. Front Cell Dev Biol. 2020;8:602174. doi:10.3389/fcell.2020.602174
- Tian Z, Meng L, Long X, et al. Identification and validation of an immune-related gene-based prognostic index for bladder cancer. Am J Transl Res. 2020;12(9):5188–5204.
- Jia Y, Chen Y, Liu J. Prognosis-predictive signature and nomogram based on autophagy-related long non-coding RNAs for hepatocellular carcinoma. Front Genet. 2020;11:608668. doi:10.3389/fgene.2020.608668
- Meng L, Tian Z, Long X, et al. Prognostic autophagy model based on and expression in patients with renal cancer: independent datasets-based study. Am J Transl Res. 2020;12(11):7475–7489.
- Yu G, Wang L-G, Han Y, He Q-Y. clusterProfiler: an R package for comparing biological themes among gene clusters. OMICS. 2012;16(5):284–287. doi:10.1089/omi.2011.0118
- Miao T, Si Q, Wei Y, Fan R, Wang J, An X. Identification and validation of seven prognostic long non-coding RNAs in oral squamous cell carcinoma. Oncol Lett. 2020;20(1):939–946. doi:10.3892/ol.2020.11603
- Yao Y, Zhang T, Qi L, et al. Identification of four genes as prognosis signatures in lung adenocarcinoma microenvironment. Pharmgenomics Pers Med. 2021;14:15–26. doi:10.2147/PGPM.S283414
- Huang R, Liao X, Li Q. Identification and validation of potential prognostic gene biomarkers for predicting survival in patients with acute myeloid leukemia. Onco Targets Ther. 2017;10:5243–5254. doi:10.2147/OTT.S147717
- Ma X, Zhang L, Huang D, et al. Quantitative radiomic biomarkers for discrimination between neuromyelitis optica spectrum disorder and multiple sclerosis. J Magn Reson Imaging. 2019;49(4):1113–1121. doi:10.1002/jmri.26287
- Ma B, Shi R, Yang S, et al. DUSP4/MKP2 overexpression is associated with BRAF(V600E) mutation and aggressive behavior of papillary thyroid cancer. Onco Targets Ther. 2016;9:2255–2263. doi:10.2147/OTT.S103554
- Wang Y, Zou Y, Zhang Y, Li C. Developing a risk scoring system based on immune-related lncRNAs for patients with gastric cancer. Biosci Rep. 2020;41(1):BSR20202203. doi:10.1042/BSR20202203
- Li T, Fu J, Zeng Z, et al. TIMER2.0 for analysis of tumor-infiltrating immune cells. Nucleic Acids Res. 2020;48(W1):W509–W514. doi:10.1093/nar/gkaa407
- Rhodes DR, Kalyana-Sundaram S, Mahavisno V, et al. Oncomine 3.0: genes, pathways, and networks in a collection of 18,000 cancer gene expression profiles. Neoplasia. 2007;9(2):166–180. doi:10.1593/neo.07112
- Wu Z, Zhang Y, Chen X, Tan W, He L, Peng L. Characterization of the prognostic values of the CXCR1-7 in clear cell renal cell carcinoma (ccRCC) microenvironment. Front Mol Biosci. 2020;7:601206. doi:10.3389/fmolb.2020.601206
- White E, Mehnert JM, Chan CS. Autophagy, metabolism, and cancer. Clin Cancer Res. 2015;21(22):5037–5046. doi:10.1158/1078-0432.CCR-15-0490
- Degenhardt K, Mathew R, Beaudoin B, et al. Autophagy promotes tumor cell survival and restricts necrosis, inflammation, and tumorigenesis. Cancer Cell. 2006;10(1):51–64. doi:10.1016/j.ccr.2006.06.001
- Cui J, Shen H-M, Lim LHK. The role of autophagy in liver cancer: crosstalk in signaling pathways and potential therapeutic targets. Pharmaceuticals (Basel). 2020;13(12):432. doi:10.3390/ph13120432
- Yu S, Wang Y, Jing L, et al. Autophagy in the “inflammation-carcinogenesis” pathway of liver and HCC immunotherapy. Cancer Lett. 2017;411:82–89. doi:10.1016/j.canlet.2017.09.049
- D’Alesio C, Bellese G, Gagliani MC, et al. The chromodomain helicase CHD4 regulates ERBB2 signaling pathway and autophagy in ERBB2 breast cancer cells. Biol Open. 2019;8(4):bio038323. doi:10.1242/bio.038323
- Hanyu X, Lanyue L, Miao D, Wentao F, Cangran C, Hui S. Effect of ganoderma applanatum polysaccharides on MAPK/ERK pathway affecting autophagy in breast cancer MCF-7 cells. Int J Biol Macromol. 2020;146:353–362. doi:10.1016/j.ijbiomac.2020.01.010
- Liu F, Chang L, Hu J. Activating transcription factor 6 regulated cell growth, migration and inhibited cell apoptosis and autophagy via MAPK pathway in cervical cancer. J Reprod Immunol. 2020;139:103120. doi:10.1016/j.jri.2020.103120
- Song M, Zhang H, Chen Z, et al. Shikonin reduces hepatic fibrosis by inducing apoptosis and inhibiting autophagy via the platelet-activating factor-mitogen-activated protein kinase axis. Exp Ther Med. 2021;21(1):28. doi:10.3892/etm.2020.9460
- Llovet JM, Zucman-Rossi J, Pikarsky E, et al. Hepatocellular carcinoma. Nat Rev Dis Primers. 2016;2:16018. doi:10.1038/nrdp.2016.18
- Tang B, Zhu J, Li J, et al. The ferroptosis and iron-metabolism signature robustly predicts clinical diagnosis, prognosis and immune microenvironment for hepatocellular carcinoma. Cell Commun Signal. 2020;18(1):174. doi:10.1186/s12964-020-00663-1
- Vogiatzi F, Brandt DT, Schneikert J, et al. Mutant p53 promotes tumor progression and metastasis by the endoplasmic reticulum UDPase ENTPD5. Proc Natl Acad Sci U S A. 2016;113(52):E8433–E8442. doi:10.1073/pnas.1612711114
- Chen Y, Ma D, Wang X, et al. Calnexin impairs the antitumor immunity of CD4 and CD8 T cells. Cancer Immunol Res. 2019;7(1):123–135. doi:10.1158/2326-6066.CIR-18-0124
- Okayama A, Miyagi Y, Oshita F, et al. Proteomic analysis of proteins related to prognosis of lung adenocarcinoma. J Proteome Res. 2014;13(11):4686–4694. doi:10.1021/pr4012969
- Kobayashi M, Nagashio R, Jiang S-X, et al. Calnexin is a novel sero-diagnostic marker for lung cancer. Lung Cancer. 2015;90(2):342–345. doi:10.1016/j.lungcan.2015.08.015
- Ryan D, Carberry S, Murphy ÁC, et al. Calnexin, an ER stress-induced protein, is a prognostic marker and potential therapeutic target in colorectal cancer. J Transl Med. 2016;14(1):196. doi:10.1186/s12967-016-0948-z
- Ros M, Nguyen AT, Chia J, et al. ER-resident oxidoreductases are glycosylated and trafficked to the cell surface to promote matrix degradation by tumour cells. Nat Cell Biol. 2020;22(11):1371–1381. doi:10.1038/s41556-020-00590-w
- Wang X-Q, Bai H-M, Li S-T, et al. Knockdown of HDAC1 expression suppresses invasion and induces apoptosis in glioma cells. Oncotarget. 2017;8(29):48027–48040. doi:10.18632/oncotarget.18227
- Fritzsche FR, Weichert W, Röske A, et al. Class I histone deacetylases 1, 2 and 3 are highly expressed in renal cell cancer. BMC Cancer. 2008;8(1):381. doi:10.1186/1471-2407-8-381
- Weichert W, Röske A, Gekeler V, et al. Histone deacetylases 1, 2 and 3 are highly expressed in prostate cancer and HDAC2 expression is associated with shorter PSA relapse time after radical prostatectomy. Br J Cancer. 2008;98(3):604–610. doi:10.1038/sj.bjc.6604199
- Weichert W, Röske A, Niesporek S, et al. Class I histone deacetylase expression has independent prognostic impact in human colorectal cancer: specific role of class I histone deacetylases in vitro and in vivo. Clin Cancer Res. 2008;14(6):1669–1677. doi:10.1158/1078-0432.CCR-07-0990
- Weichert W, Röske A, Gekeler V, et al. Association of patterns of class I histone deacetylase expression with patient prognosis in gastric cancer: a retrospective analysis. Lancet Oncol. 2008;9(2):139–148. doi:10.1016/S1470-2045(08)70004-4
- Carew JS, Giles FJ, Nawrocki ST. Histone deacetylase inhibitors: mechanisms of cell death and promise in combination cancer therapy. Cancer Lett. 2008;269(1):7–17. doi:10.1016/j.canlet.2008.03.037
- Thurn KT, Thomas S, Raha P, Qureshi I, Munster PN. Histone deacetylase regulation of ATM-mediated DNA damage signaling. Mol Cancer Ther. 2013;12(10):2078–2087. doi:10.1158/1535-7163.MCT-12-1242
- Zhang L, Bu L, Hu J, et al. HDAC1 knockdown inhibits invasion and induces apoptosis in non-small cell lung cancer cells. Biol Chem. 2018;399(6):603–610. doi:10.1515/hsz-2017-0306
- Yoo YG, Na TY, Seo HW, et al. Hepatitis B virus X protein induces the expression of MTA1 and HDAC1, which enhances hypoxia signaling in hepatocellular carcinoma cells. Oncogene. 2008;27(24):3405–3413. doi:10.1038/sj.onc.1211000
- Ler SY, Leung CHW, Khin LW, et al. HDAC1 and HDAC2 independently predict mortality in hepatocellular carcinoma by a competing risk regression model in a Southeast Asian population. Oncol Rep. 2015;34(5):2238–2250. doi:10.3892/or.2015.4263