
Abstract
Objective
Ischemic stroke (IS) is a major cause of severe disability. This study aimed to identify potential biomarkers closely related to IS diagnosis and treatment.
Methods
Profiles of gene expression were obtained from datasets GSE16561, GSE22255, GSE112801 and GSE110993. Differentially expressed mRNAs between IS and controls were then subjected to weighted gene co-expression network analysis as well as multiscale embedded gene co-expression network analysis. The intersection of the two sets of module genes was subjected to analyses of functional enrichment and of microRNAs (miRNAs) regulation. Then, the area under receiver operating characteristic curves (AUC) was calculated to assess the ability of genes to discriminate IS patients from controls. IS diagnostic signatures were constructed using least absolute shrinkage and selection operator regression.
Results
A total of 234 common co-expression network genes were found to be potentially associated with IS. Enrichment analysis found that these genes were mainly associated with inflammation and immune response. The aberrantly expressed miRNAs (hsa-miR-651-5p, hsa-miR-138-5p, hsa-miR-9-3p and hsa-miR-374a-3p) in IS had regulatory effects on IS-related genes and were involved in brain-related diseases. We used the criterion AUC > 0.7 to screen out 23 hub genes from IS-related genes in the GSE16561 and GSE22255 datasets. We obtained an 8-gene signature (ADCY4, DUSP1, ATP5F1, DCTN5, EIF3G, ELAVL1, EXOSC7 and PPIE) from the training set of GSE16561 dataset, which we confirmed in the validation set of GSE16561 dataset and in the GSE22255 dataset. The genes in this signature were highly accurate for diagnosing IS. In addition, the 8-gene signature significantly correlated with infiltration by immune cells.
Conclusion
These findings provide new clues to molecular mechanisms and treatment targets in IS. The genes in the signature may be candidate markers and potential gene targets for treatments.
Introduction
Ischemic stroke (IS) occurs when a thrombus or embolus obstructs a large cerebral artery, blocking blood flow to certain parts of the brain.Citation1 IS is a leading cause of death, accounting for over 6 million deaths annually worldwide.Citation2 Despite increasing understanding of IS pathophysiology and improvements in laboratory and clinical research, the diagnosis and treatment of IS remain challenging.Citation3,Citation4 Biomarkers can serve as a valuable component of the diagnostic evaluation approach, guiding treatment and prognosis.
Patients with IS usually present multiple risk factors, so the development of new treatments depends on more thorough understanding of IS pathogenesis. IS patients usually present with a rapid interruption of blood supply, which leads to neurological failure due to hypoxia and brain tissue damage.Citation5 Multiple studies have shown that neuroinflammatory response is an important pathological mechanism of IS, which disrupts the blood-brain barrier by blocking and increases patient mortality.Citation6 Disruption of the blood-brain barrier results in the migration of various inflammatory cells, such as macrophages, monocytes, and T lymphocytes to the ischemic site, where they release proinflammatory factors.Citation7 This creates a complex inflammatory network that indirectly affects the integrity of the blood-brain barrier.Citation8,Citation9 The inflammatory state of regulatory cells, against the secretion of harmful factors, may maintain the homeostasis of the blood-brain barrier caused by inflammation and promote functional recovery in patients with IS.Citation10 The inflammation and reperfusion cause cerebral ischemia and increase production of reactive oxygen species and cell death.Citation11 These mechanistic insights may help in the development of treatments for the prevention of secondary brain injury after stroke.
MicroRNAs (miRNAs), endogenously expressed RNA molecules, inhibit mRNA translation and play a key role in the pathophysiological process of ischemic stroke injury.Citation12 The target genes regulated by miRNAs can mediate inflammatory response, oxidative stress, cell proliferation and apoptosis, making them potentially useful for diagnosis and therapy in IS.Citation13 There is evidence that brain miRNAs are altered in ischemic stroke and that these changes lead to significant alterations in the expression of genes involved in neuroinflammation.Citation14 MiRNAs are new diagnostic and therapeutic molecules for the treatment of ischemic stroke, the prevention of neurodegeneration and brain damage, and the promotion of long-term recovery.Citation13,Citation15,Citation16
In the present study, we explored molecular dysregulation and potential biomarkers in IS by using gene expression profiles from patients in public databases. By combining weighted gene co-expression network analysis (WGCNA) and multiscale embedded gene co-expression network analysis (MEGENA), we established diagnostic gene signatures for IS that, at the same time, may provide novel therapeutic targets.
Materials and Methods
Data Collection
All data in this study were obtained from the Gene Expression Omnibus (GEO) database (http://www.ncbi.nlm.nih.gov/geo/). GSE16561 contained the mRNA expression profiles of peripheral whole blood from 39 acute IS patients and 24 healthy control subjects based on the GPL6883 platform. GSE22255 contained the mRNA expression profiles of peripheral blood mononuclear cells (PBMCs) from 20 IS patients and 20 sex- and age-matched controls based on the GPL570 platform. GSE112801 contained the miRNA expression profiles of whole blood samples from 39 IS patients and 10 age-matched controls based on the GPL18573 platform. GSE110993 contained the miRNA expression profiles of the peripheral blood plasma samples from 20 IS patients and 20 healthy control subjects based on the GPL15456 platform. Sample quality were evaluated using principal component analysis (PCA).
Differential Expression Analysis
Differences in mRNA and miRNA expression between IS patients and controls were analyzed on data from GSE16561, GSE22255, and GSE112801 using the limma R package.Citation17 The DEseq2 R package was used to analyze differences in miRNA expression between IS patients and controls in GSE110993.Citation18 Differentially expressed mRNAs (DEmRs) and differentially expressed miRNAs (DEmiRs) were defined as those whose expression differences were associated with P < 0.05.
Construction of Co-Expression Network
WGCNA was performed for DEmRs in GSE16561 using the WGCNA routine in R.Citation19 Gene co-expression networks were identified based on topological overlap. The soft thresholding power β was chosen based on scale-free topology criteria. Then a topological overlap measure (TOM) matrix was transformed from the adjacency matrix. Next, modules were identified using hierarchical clustering and dynamic tree cutting.
MEGENA was performed using the MEGENA routine in R.Citation20 This analysis generates multiscale networks of different possible gene-gene interactions. Default parameters were used to calculate a planar filtered network (PFN) from gene expression correlations emerging from the MEGENA.
Functional and Pathway Enrichment of DEmRs
The clusterProfiler routine in R was used to analyze DEmRs for enrichment in Gene Ontology (GO) terms and Kyoto Encyclopedia of Genes and Genomes (KEGG) pathways.Citation21 Biological processes (BPs) were included in the analysis of GO enrichment. P < 0.05 was set as the threshold of statistical significance. Enrichment results were displayed through gene set variation analysis (GSVA) using the GSVA routine in R.Citation22 The clusterProfiler package was also used to perform gene set enrichment analysis (GSEA),Citation23 the results of which were displayed using the fgsea routine in R.
Prediction of DEmiR Targets
Targetscan (http://www.targetscan.org/vert_72/) was used to predict the target genes regulated by DEmiRs.
LASSO Regression
Areas under receiver operating characteristic curves (AUCs) were calculated for IS-related genes using pROC routine in R in order to assess the ability of the genes to discriminate IS patients from controls.Citation24 Genes with AUC > 0.7 in both the GSE16561 and GSE22255 datasets were used to build a binomial least absolute shrinkage and selection operator regression (LASSO) model using the glmnet routine in R.Citation25 The training set was 75% of samples (randomly selected) in the GSE16561 dataset. When performing LASSO regression, we retained all variables with non-zero coefficients. The remaining 25% of samples in the GSE16561 dataset and all samples in the GSE25504 dataset served as the validation set.
Immune Cell Infiltration
The levels of infiltration by different types of immune cells in GSE16561 were evaluated using CIBERSORT (https://cibersort.stanford.edu/) and ssGSEA in the GSVA routine in R. Immune cells expressed as 0 were excluded from the analysis. A set of marker genes for immune cell types analyzed by ssGSEA were obtained from Bindea et al.Citation26 Differences in infiltration of immune cells between IS patients and controls were calculated using the limma R package. We also evaluated potential correlations between the hub genes and immune cells using Pearson correlation analysis. Results associated with P value < 0.05 were considered significant.
Results
Gene Networks of DEmRs in IS Patients Based on WGCNA and MEGENA
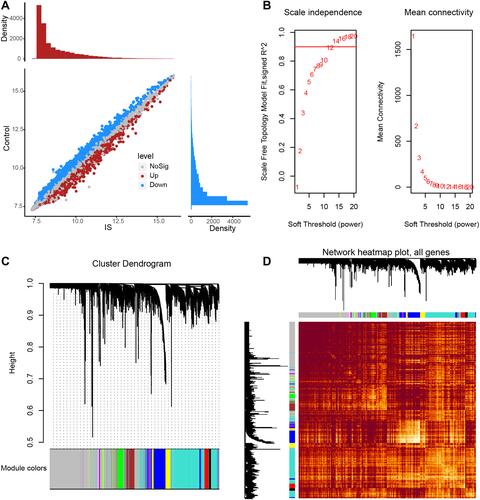
The flowchart of this study is shown in . Based on PCA, IS patients were weakly distinguishable from healthy controls in the GSE16561 and GSE22255 datasets (Supplementary Figure S1). To identify IS-associated genes, we first performed differential analysis of gene expression between IS patients and controls in GSE16561. A total of 5700 DEmRs were obtained (). We then performed WGCNA on these DEmRs to construct a co-expression network. The power of β=12 (scale-free R2=0.9) was set as the appropriate soft-thresholding value to satisfy the scale-free network criteria (). Twelve co-expression modules were identified (), and there were strong correlations among different genes within each module (). Correlation heatmap of module genes showed the TOM among all genes.
Figure 1 The flowchart of this study.
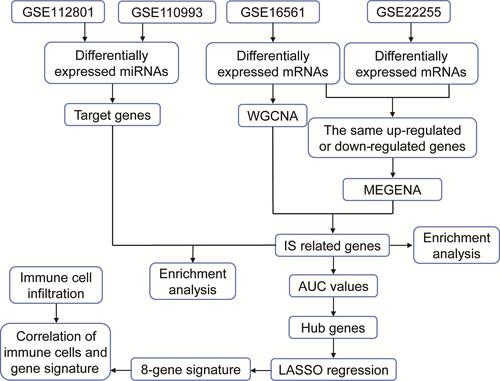
Figure 2 The co-expression network constructed by WGCNA. (A) Genes differentially expressed between IS patients and controls were identified by limma R package in GSE16561. Red dots represent genes upregulated in IS; blue, genes downregulated in IS. (B) Scale-free fit index analysis and average connectivity analysis for selection of soft-threshold β. (C) Clustering tree of co-expression module genes. (D) Heatmap of WGCNA network.
We also analyzed differential gene expression in the GSE22255 dataset, giving 2390 DEmRs between IS patients and controls (). By comparing with the DEmRs in GSE16561, we identified that 96 DEmRs were upregulated and 261 DEmRs were downregulated in IS (). These DEmRs were considered as common genes and may be strongly associated with IS.
Figure 3 Co-expression modules of IS-associated genes, constructed by MEGENA. (A) Genes differentially expressed between ischemic stroke (IS) patients and controls were identified by limma R package in the GSE22255 dataset. Red dots represent genes upregulated in IS; blue, genes downregulated in IS. (B) Up- and downregulated DEmRs common to the two network analyses. (C) The global MEGENA network of common genes. Each node represents one module. The larger the node, the greater the number of module genes were included. (D) Child modules with the largest number of module genes in the MEGENA network. Each color represents one child module. Triangles represent hub genes of modules.
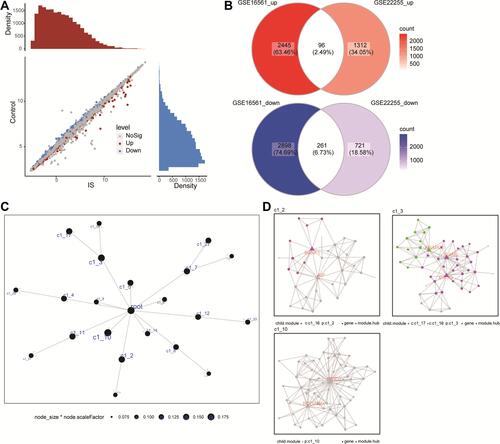
Using MEGENA, we constructed a co-expression network of common genes (). We identified 33 modules and 346 module genes. Among them, the largest module, C1_3, consisted of 51 genes, while module C1_10 consisted of 51 genes and C1_2 consisted of 35 genes (). Then, 234 module genes common to the two co-expression networks of WGCNA and MEGENA were considered as IS-associated genes.
Functional and Pathway Enrichment of Module Genes
To identify IS-related molecular dysregulation, we analyzed the enrichment IS-associated genes. GO analysis showed that the IS-associated genes were involved mainly in activated cellular response of interleukin (IL)-1, positive regulation of IL-17 secretion, and regulation of eosinophil differentiation of biological processes (BPs), as well as the inhibition of oxidative phosphorylation, mRNA processing, and ATP metabolic processes ().
Figure 4 Analysis of biological processes and KEGG pathways enriched in genes related to IS. (A) The main 10 functional terms of biological process (BP) enrichment analysis. Orange columns are activated terms and blue columns are inhibited terms in IS relative to controls. (B) The main 10 signaling pathways of Kyoto Encyclopedia of Genes and Genomes (KEGG) enrichment analysis. Orange columns are activated terms and blue columns are inhibited terms in IS relative to controls. (C) Significantly activated or inhibited KEGG pathways in IS, based on GSEA.
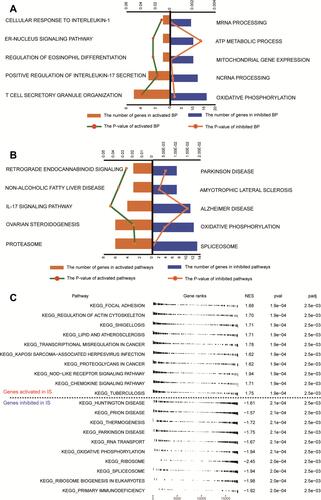
The IS-associated genes showed enrichment of the following KEGG pathways: the activated IL-17 signaling pathway, retrograde endocannabinoid signaling, ovarian steroidogenesis, inhibited oxidative phosphorylation, Parkinson disease, and Alzheimer’s disease (). GSEA results showed enrichment of focal adhesion, NOD-like receptor signaling, and chemokine signaling in IS, whereas oxidative phosphorylation, Parkinson disease, and Huntington disease were inhibited (). The intersection genes involved in these enrichment results may be dysregulated in IS, and most appear to be associated with immune and inflammatory responses.
Network of miRNAs Regulating the IS-Associated Genes
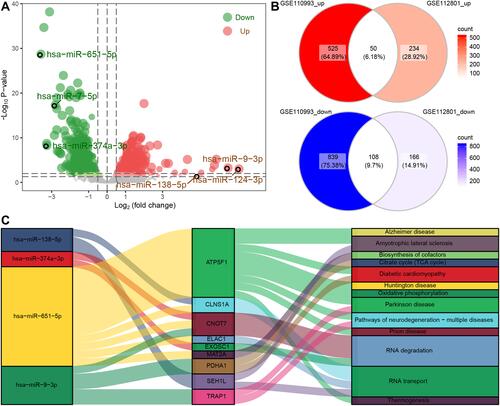
To identify the regulatory mechanisms of the IS-associated genes, we first analyzed DEmiRs. In GSE112801, we detected 558 DEmiRs (), among which 50 were up-regulated and 108 down-regulated in IS, based on comparison with DEmiRs in GSE110993 (). Among the predicted target genes of these dysregulated miRNAs, we identified nine IS-associated genes: ATP5F1, CLNS1A, CNOT7, ELAC1, EXOSC1, MAT2A, PDHA1, SEH1L, and TRAP1. These genes are regulated by the following four miRNAs involved in brain disease: hsa-miR-651-5p, hsa-miR-138-5p, hsa-miR-9-3p, and hsa-miR-374a-3p ().
Figure 5 Regulatory network of miRNAs for IS-associated mRNAs. (A) Differentially expressed miRNAs between IS patients and controls in the GSE112801 dataset. Red dots represent miRNAs upregulated in IS; blue, miRNAs downregulated in IS. (B) Up- and downregulated DEmiRs common to both the GSE112801 and GSE110993 datasets. (C) Sankey map of miRNA-regulated mRNAs involved in KEGG signaling pathways.
Identification of Gene Markers of IS
To identify potential biomarkers for IS, we calculated AUCs for IS-associated genes in GSE22255 and GSE16561 (). We obtained 23 hub genes that gave AUC > 0.7 in both datasets (). Then we randomly split all IS samples in the GSE16561 dataset into a training set (75%) and a validation set (25%). We employed LASSO regression to screen further the 23 hub genes in the training set. Finally, we obtained 8 candidate genes with non-zero coefficients ().
Figure 6 Potential candidate genes for IS. (A) Areas under the receiver operating characteristic curve (AUCs) for dysregulated genes in the GSE16561 and GSE22255 datasets. (B) Mean AUCs of hub genes. Red represents genes upregulated in IS; blue, genes downregulated in IS. (C) Distribution of LASSO coefficients for the 8-gene signature. (D–F) Receiver operating characteristic curves for the gene signature in the (D) training set of GSE16561, (E) validation set of GSE16561 and (F) GSE22255.
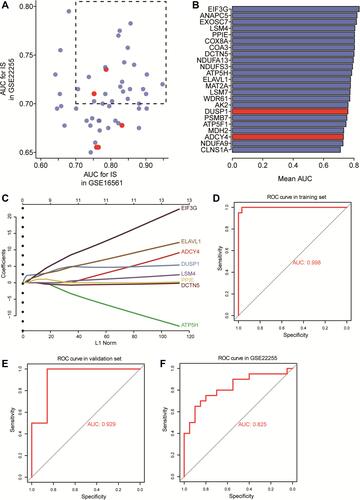
We performed ROC curve analysis to evaluate the diagnostic performance of the 8-gene signature in the training set (), obtaining an AUC of 0.998. The AUC in the validation set was 0.929 (). We also used GSE22255 as an external dataset to validate the gene signature, obtaining an AUC of 0.825 ().
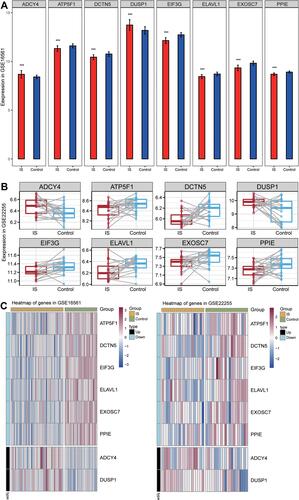
In the gene signature, ADCY4 and DUSP1 were upregulated in IS, while ATP5F1, DCTN5, EIF3G, ELAVL1, EXOSC7, and PPIE were downregulated (–). The expression heatmap of the 8-gene signature in GSE22255 and GSE16561 is shown in .
Figure 7 Expression of signature genes in IS patients and controls. (A) The expression of signature genes in IS patients and controls in the GSE16561 dataset. ***P<0.001. (B) Expression of signature genes in IS patients and controls in the GSE22255 dataset. (C) Heatmap of signature genes in IS patients and controls in the GSE16561 and GSE22255 datasets. Black type represents upregulation; blue type, downregulation.
Immune Cell Infiltration in IS
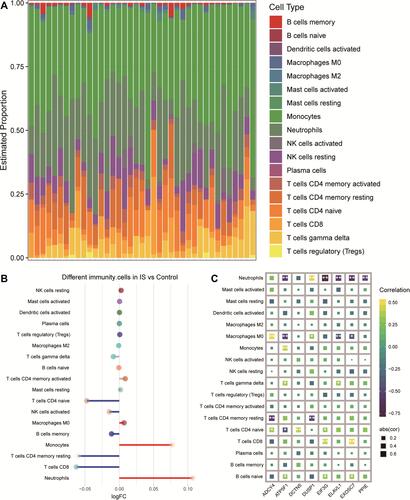
Among the IS-related molecular mechanisms, we found a large number of immune inflammatory responses. When we calculated the infiltration levels of immune cells in IS, we found that monocytes and neutrophils were the most abundant (). IS patients showed significantly higher levels of macrophages M0, monocytes, and neutrophils than controls, but lower levels of naive CD4 T cells, activated NK cells, memory B cells, resting memory CD4T cells, and CD8 T cells than controls (). Correlation analysis revealed that 8-gene signature correlated significantly with the levels of immune cell infiltration in blood samples ().
Figure 8 Differences between IS patients and controls in brain tissue infiltration by immune cell types. (A) Bar plot of levels of infiltration by 18 types of immune cells in the brains of IS patients. (B) Differences in immune cell infiltration between IS patients and controls. Red indicates significantly greater infiltration in IS; blue, significantly less infiltration. (C) Correlations between immune cell infiltration and expression of signature genes in IS. *P < 0.05, **P < 0.01.
Discussion
We performed co-expression network analysis of gene expression data in IS patients, allowing us to identify potential biomarkers and target genes associated with IS. We identified an 8-gene signature that can predict the occurrence of IS, and we found that the signature correlated with immune cell infiltration. We also identified a network of miRNAs regulating the expression of IS-associated genes.
WGCNA and MEGENA complement each other by maximally retaining IS-specific module genes in the gene networks.Citation27 The analysis may be particularly reliable when it focuses on genes common to the two co-expression networks. When we explored the GO terms and KEGG pathways enriched in these intersection genes, we found enrichment of inflammation and immune response. This is consistent with studies linking the immune system to IS-associated inflammation that can lead to cell death on one hand, but can also support stroke recovery on the other hand.Citation28
In our enrichment results, a large number of interleukin-related biological functions and signaling pathways were found to be involved in IS-related dysregulation. IL-1 is one of the most important cytokines in the development of ischemic injury, and it is a potential therapeutic target for IS.Citation29,Citation30 In the neuroinflammatory response of IS, IL-17A signaling is associated with post-stroke neurogenesis.Citation31 IL-17 has the ability to disrupt the blood-brain barrier, and it contributes to neurodegeneration by increasing the oxidative stress response.Citation32 Oxidative stress and inflammatory activity are early events in the cascade of cerebral ischemic injury.Citation33 The relationship between eosinophils and IS is currently unclear. Several studies have shown positive correlation between the number of eosinophils and the prognosis of IS.Citation34 Additionally, activation of focal adhesion kinase contributes to angiogenesis, neurogenesis and functional recovery after IS.Citation35 NOD-like receptor (NLR), which drives an inflammatory signaling pathway, shows promise as a therapeutic target in IS.Citation36 This suggests that the dysregulated genes we identified may contribute to IS by modulating neuroimmune and inflammatory responses.
Interestingly, GO and KEGG analysis as well as GSEA showed that oxidative phosphorylation was suppressed in IS. Oxidative phosphorylation plays an important role in the response and recovery of neurons after oxidative stress,Citation37 and dysfunction of this pathway can lead to ATP depletion, cellular signaling defects, and dysregulated apoptosis.Citation38 Our finding of a loss-of-function of oxidative phosphorylation in IS should be explored as a potential risk factor for IS.
Several of the DEmiRs in IS that we identified have previously been linked to brain injury. The miR-651 can protect against focal cerebral ischemic injury, and may be a regulator of genes related to Alzheimer’s disease.Citation39 The target gene we identified, ATP5F1, was confirmed to be downregulated in AD.Citation40 ATP5F1 drives mitochondrial ATP production, and defects in mitochondrial ATP synthesis have previously been reported in amyotrophic lateral sclerosis (ALS), Huntington disease.Citation41–Citation43 The miR-138-5p alleviates neurological impairment in IS by promoting astrocyte proliferation and inhibiting inflammatory response.Citation44 The miR-9-3p is upregulated in the brain tissue of IS patients,Citation45 and it may be a diagnostic marker for experimental and human mild head injury.Citation46 MiR-9 upregulation may target the expression of BDNF to promote neurodegeneration of dopaminergic neurons caused by neurotoxins and cell apoptosis.Citation47 Hypoxia or reoxygenation downregulate miR-374a-3p in endothelial cells,Citation48 so future work should explore whether this downregulation is associated with IS.
Here, we identified eight potential gene biomarkers associated with IS. All these genes have previously been associated with various aspects of IS, suggesting the reliability of our analyses. ADCY4 is abnormally expressed in stroke and is involved in renin-angiotensin signaling.Citation49,Citation50 DUSP1 is upregulated in IS and may have diagnostic value.Citation51,Citation52 In fact, this member of the oxidative phosphorylation pathway is associated with multiple neurodegenerative diseases,Citation53 though little has been published about a role in IS. DCTN5 is a bipolar disorder-associated protein that encodes a subunit of the motor complex important for retrograde dendritic transport in neurons.Citation54 EIF3G is involved in apoptosis and has been associated with neuropsychiatric disorders.Citation55,Citation56 ELAVL1 is a potential target for miR-9, and it plays a critical role in the progression of inflammation.Citation57 EXOSC7 is found upregulated expression in animal models of stroke.Citation58 Downregulation of PPIE is associated with cognitive dysfunction in IS.Citation51,Citation59
Macrophages that substantially infiltrate stroke lesions in IS patients may adopt a pro-inflammatory phenotype that enhances brain damage or a catabolic inflammatory phenotype that enhances brain repair.Citation60 Monocytes in the blood may mediate neuroinflammatory responses that can strongly affect IS outcomes, and these cells may serve as the basis of new therapeutic approaches.Citation1 Neutrophils are also important targets of strategies to treat and even prevent IS.Citation61 The delayed arrival of T cells in stroke lesions means that they may be targeted to treat IS during a longer window than other therapies.Citation62 In conclusion, immune responses after IS may prove to be highly useful as targets for developing stroke treatments.
Our study has some limitations. First, the data we analyzed were from public databases and the sample size was small, and lacked validation on clinical samples for key outcomes. Second, the gene signature could not be reconstructed in the validation cohort in order to validate its prognostic value in IS. Then, the expression profiles of miRNAs in this study were obtained from different sample types. In which whole blood may contain many cells that can store miRNAs and release them, which affects miRNA expression. We also did not examine further how the genes in the signature may influence neuroinflammation in IS. Follow-up studies of biochemical and animal studies should be done to verify and extend key results.
Conclusion
Module genes of IS were identified by applying WGCNA and MEGENA, and they were found to be involved mainly in inflammatory immune responses. We also identified a signature of 8 genes (ADCY4, DUSP1, ATP5F1, DCTN5, EIF3G, ELAVL1, EXOSC7, and PPIE) that may be useful as biomarkers of IS. If these biomarkers can be verified in experimental studies, our findings may help in the early diagnosis and targeted treatment of IS. Understanding these regulatory mechanisms and developing new target genes may lead to the development of new therapeutic strategies.
Data Sharing Statement
The raw data, analyses and codes in this study can be obtained from the corresponding author upon reasonable request.
Acknowledgments
This study was supported by the Scientific Research Project of Guangxi Health Commission (Z20200212, Z20200146, Z20210200 and Z20210683), the High-Level Medical Expert Training Program of Guangxi “139” Plan Funding (G201903049), the Project of Guigang Scientific Research and Technology Development Plan (Guikegong 1908002 Shezi), and the Guangxi Medical and Health Key Discipline Construction Project (Department of Emergency Medicine and Department of Geriatrics, The First People’s Hospital of Nanning).
Disclosure
The authors report no conflicts of interest related to this work.
References
- Park J, Chang JY, Kim JY, Lee JE. Monocyte transmodulation: the next novel therapeutic approach in overcoming ischemic stroke? Front Neurol. 2020;11:578003. doi:10.3389/fneur.2020.578003
- Mendis S, Davis S, Norrving B. Organizational update: the world health organization global status report on noncommunicable diseases 2014; one more landmark step in the combat against stroke and vascular disease. Stroke. 2015;46(5):e121–e122. doi:10.1161/STROKEAHA.115.008097
- Kamtchum-Tatuene J, Jickling GC. Blood biomarkers for stroke diagnosis and management. Neuromolecular Med. 2019;21(4):344–368.
- Zhou H, Huang L, Liang L, et al. Identification of an miRNA regulatory network and candidate markers for ischemic stroke related to diabetes. Int J Gen Med. 2021;14:3213–3223. doi:10.2147/IJGM.S319503
- Kim JH, Kim SY, Kim B, et al. Prospects of therapeutic target and directions for ischemic stroke. Pharmaceuticals. 2021;14(4):321. doi:10.3390/ph14040321
- Yang C, Hawkins KE, Dore S, Candelario-Jalil E. Neuroinflammatory mechanisms of blood-brain barrier damage in ischemic stroke. Am J Physiol Cell Physiol. 2019;316(2):C135–C153. doi:10.1152/ajpcell.00136.2018
- Amantea D, Micieli G, Tassorelli C, et al. Rational modulation of the innate immune system for neuroprotection in ischemic stroke. Front Neurosci. 2015;9:147. doi:10.3389/fnins.2015.00147
- Salas-Perdomo A, Miro-Mur F, Urra X, et al. T cells prevent hemorrhagic transformation in ischemic stroke by P-selectin binding. Arterioscler Thromb Vasc Biol. 2018;38(8):1761–1771. doi:10.1161/ATVBAHA.118.311284
- Brait VH, Arumugam TV, Drummond GR, Sobey CG. Importance of T lymphocytes in brain injury, immunodeficiency, and recovery after cerebral ischemia. J Cereb Blood Flow Metab. 2012;32(4):598–611. doi:10.1038/jcbfm.2012.6
- Qiu YM, Zhang CL, Chen AQ, et al. Immune cells in the BBB disruption after acute ischemic stroke: targets for immune therapy? Front Immunol. 2021;12:678744.
- Shirley R, Ord EN, Work LM. Oxidative stress and the use of antioxidants in stroke. Antioxidants. 2014;3(3):472–501. doi:10.3390/antiox3030472
- Khoshnam SE, Winlow W, Farbood Y, Moghaddam HF, Farzaneh M. Emerging roles of microRNAs in ischemic stroke: as possible therapeutic agents. J Stroke. 2017;19(2):166–187. doi:10.5853/jos.2016.01368
- Bulygin KV, Beeraka NM, Saitgareeva AR, et al. Can miRNAs be considered as diagnostic and therapeutic molecules in ischemic stroke pathogenesis?-Current status. Int J Mol Sci. 2020;21(18):6728. doi:10.3390/ijms21186728
- Jeyaseelan K, Lim KY, Armugam A. MicroRNA expression in the blood and brain of rats subjected to transient focal ischemia by middle cerebral artery occlusion. Stroke. 2008;39(3):959–966. doi:10.1161/STROKEAHA.107.500736
- Tabet F, Lee S, Zhu W, et al. microRNA-367-3p regulation of GPRC5A is suppressed in ischemic stroke. J Cereb Blood Flow Metab. 2020;40(6):1300–1315. doi:10.1177/0271678X19858637
- Eyileten C, Wicik Z, De Rosa S, et al. MicroRNAs as diagnostic and prognostic biomarkers in ischemic stroke-A comprehensive review and bioinformatic analysis. Cells. 2018;7(12):249. doi:10.3390/cells7120249
- Ritchie ME, Phipson B, Wu D, et al. limma powers differential expression analyses for RNA-sequencing and microarray studies. Nucleic Acids Res. 2015;43(7):e47. doi:10.1093/nar/gkv007
- Love MI, Huber W, Anders S. Moderated estimation of fold change and dispersion for RNA-seq data with DESeq2. Genome Biol. 2014;15(12):550. doi:10.1186/s13059-014-0550-8
- Langfelder P, Horvath S. WGCNA: an R package for weighted correlation network analysis. BMC Bioinform. 2008;9(1):559. doi:10.1186/1471-2105-9-559
- Chen Y, Zhou J, Cheng Z, et al. Functional variants regulating LGALS1 (Galectin 1) expression affect human susceptibility to influenza A(H7N9). Sci Rep. 2015;5(1):8517. doi:10.1038/srep08517
- Yu G, Wang LG, Han Y, He QY. ClusterProfiler: an R package for comparing biological themes among gene clusters. OMICS. 2012;16(5):284–287. doi:10.1089/omi.2011.0118
- Hanzelmann S, Castelo R, Guinney J. GSVA: gene set variation analysis for microarray and RNA-seq data. BMC Bioinform. 2013;14(1):7. doi:10.1186/1471-2105-14-7
- Subramanian A, Tamayo P, Mootha VK, et al. Gene set enrichment analysis: a knowledge-based approach for interpreting genome-wide expression profiles. Proc Natl Acad Sci USA. 2005;102(43):15545–15550. doi:10.1073/pnas.0506580102
- Robin X, Turck N, Hainard A, et al. pROC: an open-source package for R and S+ to analyze and compare ROC curves. BMC Bioinform. 2011;12(1):77. doi:10.1186/1471-2105-12-77
- Friedman J, Hastie T, Tibshirani R. Regularization paths for generalized linear models via coordinate descent. J Stat Softw. 2010;33(1):1–22. doi:10.18637/jss.v033.i01
- Bindea G, Mlecnik B, Tosolini M, et al. Spatiotemporal dynamics of intratumoral immune cells reveal the immune landscape in human cancer. Immunity. 2013;39(4):782–795. doi:10.1016/j.immuni.2013.10.003
- Mukherjee S. Quiescent stem cell marker genes in glioma gene networks are sufficient to distinguish between normal and glioblastoma (GBM) samples. Sci Rep. 2020;10(1):10937. doi:10.1038/s41598-020-67753-5
- Maida CD, Norrito RL, Daidone M, Tuttolomondo A, Pinto A. Neuroinflammatory mechanisms in ischemic stroke: focus on cardioembolic stroke, background, and therapeutic approaches. Int J Mol Sci. 2020;21(18):6454. doi:10.3390/ijms21186454
- Lambertsen KL, Finsen B, Clausen BH. Post-stroke inflammation-target or tool for therapy? Acta Neuropathol. 2019;137(5):693–714.
- Clausen BH, Wirenfeldt M, Hogedal SS, et al. Characterization of the TNF and IL-1 systems in human brain and blood after ischemic stroke. Acta Neuropathol Commun. 2020;8(1):81. doi:10.1186/s40478-020-00957-y
- Xu S, Lu J, Shao A, Zhang JH, Zhang J. Glial cells: role of the immune response in ischemic stroke. Front Immunol. 2020;11:294. doi:10.3389/fimmu.2020.00294
- Swardfager W, Herrmann N, Andreazza AC, et al. Poststroke neuropsychiatric symptoms: relationships with IL-17 and oxidative stress. Biomed Res Int. 2014;2014:245210. doi:10.1155/2014/245210
- He J, Liu J, Huang Y, Tang X, Xiao H, Hu Z. Oxidative stress, inflammation, and autophagy: potential targets of mesenchymal stem cells-based therapies in ischemic stroke. Front Neurosci. 2021;15:641157. doi:10.3389/fnins.2021.641157
- Le Roy L, Letondor A, Le Roux C, Amara A, Timsit S. Cellular and molecular mechanisms of R/S-roscovitine and CDKs related inhibition under both focal and global cerebral ischemia: a focus on neurovascular unit and immune cells. Cells. 2021;10(1):104. doi:10.3390/cells10010104
- Chen D, Wei L, Liu ZR, et al. Pyruvate kinase M2 increases angiogenesis, neurogenesis, and functional recovery mediated by upregulation of STAT3 and focal adhesion kinase activities after ischemic stroke in adult mice. Neurotherapeutics. 2018;15(3):770–784. doi:10.1007/s13311-018-0635-2
- Feng YS, Tan ZX, Wang MM, Xing Y, Dong F, Zhang F. Inhibition of NLRP3 inflammasome: a prospective target for the treatment of ischemic stroke. Front Cell Neurosci. 2020;14:155. doi:10.3389/fncel.2020.00155
- Nicholls DG. Oxidative stress and energy crises in neuronal dysfunction. Ann N Y Acad Sci. 2008;1147(1):53–60. doi:10.1196/annals.1427.002
- Anderson CD, Biffi A, Nalls MA, et al. Common variants within oxidative phosphorylation genes influence risk of ischemic stroke and intracerebral hemorrhage. Stroke. 2013;44(3):612–619. doi:10.1161/STROKEAHA.112.672089
- Agarwal V, Bell GW, Nam JW, Bartel DP. Predicting effective microRNA target sites in mammalian mRNAs. Elife. 2015;4:e05005. doi:10.7554/eLife.05005
- Adav SS, Qian J, Ang YL, et al. iTRAQ quantitative clinical proteomics revealed role of Na(+)K(+)-ATPase and its correlation with deamidation in vascular dementia. J Proteome Res. 2014;13(11):4635–4646. doi:10.1021/pr500754j
- Semmler S, Gagne M, Garg P, et al. TNF receptor-associated factor 6 interacts with ALS-linked misfolded superoxide dismutase 1 and promotes aggregation. J Biol Chem. 2020;295(12):3808–3825. doi:10.1074/jbc.RA119.011215
- Ratovitski T, Chighladze E, Arbez N, et al. Huntingtin protein interactions altered by polyglutamine expansion as determined by quantitative proteomic analysis. Cell Cycle. 2012;11(10):2006–2021. doi:10.4161/cc.20423
- Rocha S, Freitas A, Guimaraes SC, Vitorino R, Aroso M, Gomez-Lazaro M. Biological implications of differential expression of mitochondrial-shaping proteins in parkinson’s disease. Antioxidants. 2017;7(1):1.
- Deng Y, Chen D, Gao F, et al. Exosomes derived from microRNA-138-5p-overexpressing bone marrow-derived mesenchymal stem cells confer neuroprotection to astrocytes following ischemic stroke via inhibition of LCN2. J Biol Eng. 2019;13(1):71. doi:10.1186/s13036-019-0193-0
- Sorensen SS, Nygaard AB, Carlsen AL, Heegaard NHH, Bak M, Christensen T. Elevation of brain-enriched miRNAs in cerebrospinal fluid of patients with acute ischemic stroke. Biomark Res. 2017;5(1):24. doi:10.1186/s40364-017-0104-9
- Das Gupta S, Ciszek R, Heiskanen M, et al. Plasma miR-9-3p and miR-136-3p as potential novel diagnostic biomarkers for experimental and human mild traumatic brain injury. Int J Mol Sci. 2021;22(4):1563. doi:10.3390/ijms22041563
- Eyileten C, Sharif L, Wicik Z, et al. The relation of the brain-derived neurotrophic factor with microRNAs in neurodegenerative diseases and ischemic stroke. Mol Neurobiol. 2021;58(1):329–347. doi:10.1007/s12035-020-02101-2
- Jiang Y, Xie H, Tu W, et al. Exosomes secreted by HUVECs attenuate hypoxia/reoxygenation-induced apoptosis in neural cells by suppressing miR-21-3p. Am J Transl Res. 2018;10(11):3529–3541.
- Ruan X, Chen T, Wang X, Li Y. Suxiao jiuxin pill protects cardiomyocytes against mitochondrial injury and alters gene expression during ischemic injury. Exp Ther Med. 2017;14(4):3523–3532. doi:10.3892/etm.2017.4964
- Jickling GC, Xu H, Stamova B, et al. Signatures of cardioembolic and large-vessel ischemic stroke. Ann Neurol. 2010;68(5):681–692. doi:10.1002/ana.22187
- Zhang Q, Chen W, Chen S, Li S, Wei D, He W. Identification of key genes and upstream regulators in ischemic stroke. Brain Behav. 2019;9(7):e01319. doi:10.1002/brb3.1319
- Adamski MG, Li Y, Wagner E, et al. Expression profile based gene clusters for ischemic stroke detection. Genomics. 2014;104(3):163–169. doi:10.1016/j.ygeno.2014.08.004
- Chen R, Yi Y, Xiao W, et al. Label-free liquid chromatography-mass spectrometry proteomic analysis of urinary identification in diabetic vascular dementia in a han Chinese population. Front Aging Neurosci. 2021;13:619945. doi:10.3389/fnagi.2021.619945
- MacLaren EJ, Charlesworth P, Coba MP, Grant SG. Knockdown of mental disorder susceptibility genes disrupts neuronal network physiology in vitro. Mol Cell Neurosci. 2011;47(2):93–99. doi:10.1016/j.mcn.2010.12.014
- Bano D, Prehn JHM. Apoptosis-Inducing Factor (AIF) in physiology and disease: the tale of a repented natural born killer. EBioMedicine. 2018;30:29–37. doi:10.1016/j.ebiom.2018.03.016
- Zhang Y, Zhao Y, Song X, et al. Modulation of stem cells as therapeutics for severe mental disorders and cognitive impairments. Front Psychiatry. 2020;11:80. doi:10.3389/fpsyt.2020.00080
- Jeyabal P, Thandavarayan RA, Joladarashi D, et al. MicroRNA-9 inhibits hyperglycemia-induced pyroptosis in human ventricular cardiomyocytes by targeting ELAVL1. Biochem Biophys Res Commun. 2016;471(4):423–429. doi:10.1016/j.bbrc.2016.02.065
- Kovalchuk A, Lowings M, Rodriguez-Juarez R, et al. Epigenetic bystander-like effects of stroke in somatic organs. Aging. 2012;4(3):224–234. doi:10.18632/aging.100447
- Muino E, Maisterra O, Jimenez-Balado J, et al. Genome-wide transcriptome study in skin biopsies reveals an association of E2F4 with cadasil and cognitive impairment. Sci Rep. 2021;11(1):6846. doi:10.1038/s41598-021-86349-1
- Hu X, Leak RK, Shi Y, et al. Microglial and macrophage polarization-new prospects for brain repair. Nat Rev Neurol. 2015;11(1):56–64. doi:10.1038/nrneurol.2014.207
- Jickling GC, Liu D, Ander BP, Stamova B, Zhan X, Sharp FR. Targeting neutrophils in ischemic stroke: translational insights from experimental studies. J Cereb Blood Flow Metab. 2015;35(6):888–901. doi:10.1038/jcbfm.2015.45
- Ahnstedt H, McCullough LD. The impact of sex and age on T cell immunity and ischemic stroke outcomes. Cell Immunol. 2019;345:103960. doi:10.1016/j.cellimm.2019.103960