
Abstract
Background
Growing findings have demonstrated that interferon regulatory transcription factor (IRF) family members are linked to the progression of various cancers. However, the roles of IRFs in clear cell renal cell carcinoma (ccRCC) remain undefined. Herein, we conducted a comprehensive analysis using the bioinformatics method to evaluate the expression patterns, clinical significance, and regulation of IRFs-related mechanisms in patients with ccRCC.
Methods
Data from the Cancer Genome Atlas (TCGA), International Cancer Genome Consortium (ICGA), and Gene Expression Omnibus (GEO) databases were used for investigation comprehensively. Specifically, we carried out a series of analyses to identify the candidate IRF and to explore its potential action mechanisms using the gene ontology (GO) and Kyoto Encyclopedia of Genes and Genomes (KEGG) pathway analyses. What is more, we emphatically investigate the association of candidate IRF with tumor immunity in ccRCC through the CIBERSORT algorithm, TIMER and GEPIA databases.
Results
Herein, IRF3 was identified as candidate IRF, which was highly expressed in ccRCC, and its overexpression was significantly associated with worse clinical outcomes and adverse overall survival. Uni- and multi-variate Cox regression analysis demonstrated that IRF3 overexpression was an independent predictor of worse prognosis. Functional enrichment analysis showed that IRF3 might participate in several cancer-related biological processes and signaling pathways, thereby promoting the progression of ccRCC. Additionally, we found that IRF3 was remarkably associated with tumor-infiltrating immune cells (TIICs) and various immune-related genes.
Conclusion
Herein, we identified IRF3 from the IRF gene family members, which could serve as promising prognostic marker and therapeutic target in ccRCC.
Introduction
Renal cell carcinoma (RCC) is a heterogeneous cancer, making treatment responses difficult to predict. Clear cell renal cell carcinoma (ccRCC) is the most common RCC subtype with the dismal prognosis and few treatment choice.Citation1 Moreover, the 5-year survival rates only 10% to 20% of some patients due to the distant metastases.Citation2 Several targets have been found and widely used in clinical practice to treat advanced ccRCC. However, only a minority of patients benefit from it.Citation3 Therefore, searching for novel targeted agents is one of the most critical things in ccRCC.
Interferon regulatory transcription factors (IRFs) constitute a family of transcription factors, including nine gene members IRF1 to IRF9. The IRFs have been demonstrated that play central roles in immunity and oncogenesis.Citation4 In hepatocellular carcinoma (HCC) cells, interferon regulatory factor 1 (IRF1) and IRF2 were reported to upregulate the PD-L1 expression, affecting the effects of immune checkpoint blockade (ICB).Citation5 Rho et alCitation6 found that IRF1 inhibits tumorigenesis and angiogenesis induced by HPV16 E6 in cervical cancer. Chen et alCitation7 have identified IRF2 as a tumor suppressor, which could suppress the invasion and migration by decreasing the expression of MMP-1 in gastric cancer. In hormone-sensitive prostate cancer cells, IRF3 signaling plays a vital role in TLR3-mediated apoptosis by activating intrinsic and extrinsic apoptotic pathways.Citation8 Additionally, Biswas et alCitation9 found the activation of IRF-3/STAT1 signaling pathway in tumor-associated macrophages (TAMs) of murine fibrosarcoma. IRF4 was identified as a haematopoietic cell-restricted transcription factor essential for haematopoietic development and regulation of the immune response.Citation10 An early clinical study has demonstrated that IRF4 could serve as a tumor suppressor in early B-cell development.Citation11 Furthermore, Ortmann et alCitation12 suggested that IRF-4 promoter methylation might be involved in regulating IRF-4 expression in leukemic cells. In human thyroid cancer cells, ectopic IRF5 promoted both the cells’ proliferation rate and the clonogenic potential.Citation13 Additionally, GuoCitation14 have reported that IRF5 was highly expressed in peripheral blood of patients with non-small cell lung cancer. IRF6 was identified as a tumor-suppressive factor, and Xu et alCitation15 found that IRF6 was decreased in highly aggressive breast cancer cell lines, whereas elevated in poorly invasive ones; upregulated the expression of IRF6 could suppress cell proliferation and tumorigenicity, as well as enhance chemosensitivity. What is more, IRF6 was also reported to decrease in gastric cancer, cervical cancer, and melanoma and associated with worse clinical outcomes.Citation16–Citation18 In breast cancer, increased expression of IRF7 has a significant association with the reduced bone metastases and prolonged survival time.Citation19 Moreover, Li et alCitation20 discovered that IRF7 was remarkably reduced in breast cancer, and upregulated IRF7 expression inhibited tumor cell invasion and proliferation. IRF8 could promote the development of dendritic cells and support anti-tumor adaptive immunity by stimulating T cells; however, breast and pancreatic cancer could interrupt the development of IRF8-dependent dendritic cells to evade immune surveillance;Citation21 in addition, Zhang et alCitation22 have confirmed that IRF8 functions as a tumor suppressor in renal cell carcinoma and its promoter methylation is associated with patient poor prognosis. Tian et alCitation23 have demonstrated that the IRF9 axis played a crucial role in the growth of human acute myeloid leukemia; moreover, Brunn et alCitation24 discovered that IRF9 promoted proliferation and migration in lung cancer via modulating of versican.
Based on the above reports, we understood the crucial roles of IRFs in tumor progression and immunity. However, their potential roles in ccRCC remain to be illustrated. Therefore, in the present study, we conducted in-depth and comprehensive analyses to assess the expression patterns, clinical significances, and prognostic values of IRFs in ccRCC. What is more, the candidate IRF was identified, and we focused on its association with tumor immunity.
Materials and Methods
Data Collection
The level 3 data of (HTSeq-FPKM data) and corresponding clinical data of KIRC were retrieved from the TCGA database (https://portal.gdc.cancer.gov/),Citation25 including 530 of the KIRC patients with complete survival data and 72 normal samples. Detailed clinic-pathological information was displayed in . Data set including 91 cases of KIRC samples and 45 normal samples from the International Cancer Genome Consortium database (ICGC, https://dcc.icgc.org/)Citation26 was used for expression validation. Four gene chips were obtained from the Gene Expression Omnibus database (GEO, https://www.ncbi.nlm.nih.gov/geo/) and were also employed for validation. GSE15641 was from the platform “GPL96[HG-U133A] Affymetrix Human Genome U133A Array”, containing 23 normal renal specimens and 32 ccRCC specimens.Citation27 GSE36895, GSE53757, and GSE66272 datasets were all from the platform GPL570[HG-U133_Plus_2] Affymetrix Human Genome U133 Plus 2.0 Array”, containing 23, 72, and 27 noncancerous tissues, as well as 29, 72 and 27 ccRCC tissues, respectively.Citation28–Citation32
Table 1 Characteristics of Clear Cell Renal Cell Carcinoma Patients in the TCGA Database
Expression Patterns of Interferon Regulatory Transcription Factor (IRF) Family Members in ccRCC
Using the RNA-sequence (RNA-seq) data from the TCGA database, we compared the expression of regulatory transcription factors (IRFs) in ccRCC specimens and corresponding adjacent normal specimens through the Wilcoxon rank-sum test. P-value less than 0.05 was considered statistically significant. Then, the transcriptional data downloaded from the ICGC database was applied for further validation. Heatmaps of all IRFs expressions were drawn using the “heatmap” R package. Correlations between each IRF were estimated using the Spearman coefficient.
Association of IRFs Expression with Overall Survival and Clinicopathological Parameters
According to the median value of each IRF, patients were divided into the high- and low-expression subgroups. Then, the Kaplan–Meier (KM) method and the Log rank test were conducted for overall survival (OS) analysis. Then, the Kaplan–Meier Plotter database (http://www.kmplot.com/)Citation33 was utilized to further estimate the prognostic results. Additionally, the relationship between the expression levels of prognosis-related IRFs and patients’ clinical features was estimated using the Wilcoxon rank-sum test.
Identification of Independent Prognostic Factors
After combining expression data with clinical information, we employed the univariate Cox regression analysis to identify the IRFs and clinicopathologic variables associated with the overall survival of patients with ccRCC. Then, the independent prognostic factors in ccRCC were determined using multivariate Cox regression analysis. The independent prognostic IRF was considered as candidate IRF, which significantly associated with overall survival and clinical outcome of patients with ccRCC.
Expression Was Validated by Various Databases
The transcriptional data of candidate IRF, derived from the GSE15641, GSE36895, GSE53757, and GSE66272, was used to verify the expression. Then, UALCAN database (http://ualcan.path.uab.edu/)Citation34 was employed to assess the protein expression of the candidate IRF. What is more, the representative image was retrieved from the Human Protein Atlas database (HPA, https://www.proteinatlas.org/)Citation35 to further verify the protein expression.
Cbioportal Database
The cBioPortal for Cancer Genomics (http://cbioportal.org) provides a Web resource for exploring, visualizing, and analyzing multidimensional cancer genomics data. In the study, cbioportal database was utilized to perform analysis of genetic alterations. Specifically, a TCGA-KIRC dataset, contains 537 ccRCC cases, was obtained from the cBioPortal database. The “Cancer Type Summary” module was utilized to analyze the mutation types frequencies. The “comparison/survival” module was used to test differences in overall survival between the altered and unaltered groups.
PPI Network Construction
In order to explore the biological functions of IRFs in ccRCC, we construct a protein–protein interaction (PPI) and identify the potential functional partners using the STRING database (active interaction sources: Experiments; minimum required interaction score greater than 0.400). Additionally, the enriched functional enrichment terms were obtained using the “Analysis” module.
Functional Enrichment Analysis
Based on the median expression values of candidate IRF, we divided the tumor groups into high- and low-expression subgroups and screened differentially expressed genes (DEGs) between two subgroups using the “limma” R package. |logFoldChange (logFC) | more than 1 and false discovery rate (FDR) less than 0.05 were considered statistically significant. Then, Metascape (https://metascape.org/), a platform for functional annotation of genes,Citation36 was used to perform functional enrichment analysis to explore these DEGs’ underlying action mechanisms.
Association of Candidate IRFs with Tumor‐infiltrating Immune Cells (TIICs) and Immune-Related Gene Markers
In this study, we used the TIMER database (https://cistrome.shinyapps.io/timer/) to estimate the association of six types of immunocytes with candidate IRF.Citation37 To further validate the TIMER database’s accuracy, the CIBERSORT algorithm was applied for immune cell quantization.Citation38 Specifically, the normalized gene expression data were uploaded to the CIBERSORT portal, run with LM22 signatures and 1000 permutations to output the fractions of immune cells. To improve the accuracy of the results, only samples with a CIBERSORT P < 0.05 were considered eligible. Then, we utilized the Wilcoxon rank-sum test to analyze the differential abundances of TIICs between low- and high-expression subgroups. Finally, to further understand the association between the candidate IRF expression and various infiltrating immune cell types, we investigated the association between IRF expression and related gene markers for each immune cell type using the TIMER and GEPIA databases. These markers were derived from different immune cells, including CD8+ T cell, T cell (general), B cell, Monocyte, TAM, M1 Macrophage, M2 Macrophage, Neutrophil, Natural killer cell, Dendritic cell, Th1, Th2, Tfh, Th17, Treg, and T cell exhaustion. Correlations were estimated using the Spearman coefficient.
Statistical Analysis
Wilcoxon rank-sum test was employed to compare the expression levels of IRFs in ccRCC samples with that in normal renal samples. The Kaplan–Meier (KM) method and the Log rank test were conducted for overall survival (OS) analysis. Uni- and multivariate Cox regression were applied to identify the independent prognostic factors. The Wilcoxon rank-sum test and Fisher’s exact test or chi-square test were used to explore the association between clinicopathological variables and expression levels of IRFs. Correlations were estimated using the Spearman coefficient in this work. P-value less than 0.05 was considered to be statistically significant. All statistical analyses were carried out using R 3.6.1 software.
Results
IRFs Were Dysregulated in KIRC
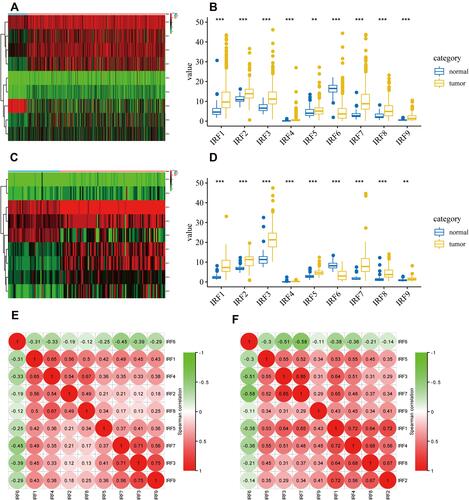
Using the data downloaded from the TCGA database, we plot a heatmap of IRFs expression in ccRCC and noncancerous tissues (). As shown in , all IRFs gene members were dysregulated in KIRC. IRF1/2/3/4/5/7/8/9 were highly expressed in ccRCC, while IRF6 was significantly lower in ccRCC samples than in normal renal samples. reveals the heat map of all IRFs expression in the ICGC database. Additionally, we found the same results using the data from the ICGC database; that is, IRF1/2/3/4/5/7/8/9 was significantly higher in ccRCC specimens by comparison with normal renal tissues, while IRF6 was significantly decreased in ccRCC samples than that in noncancerous samples (). The correlation analysis in the TCGA database showed that IRF1/2/3/4/5/7/8/9 strongly correlates with each other, whereas IRF1/2/3/4/5/7/8/9 were negatively associated with IRF6 ( and Supplementary Table 1). The correlation analysis in the ICGC database was presented the same findings ( and Supplementary Table 2).
Figure 1 Identification of abnormally expressed IRFs in ccRCC. (A) heat map of expression of all IRFs in TCGA database. (B) Boxplot of expression of dysregulated IRFs in TCGA database. (C) heat map of expression of all IRFs in ICGC database. (D) Boxplot of expression of dysregulated IRFs in ICGC database. (E) Correlation analysis between dysregulated IRFs with each other based on the data from TCGA database. (F) Correlation analysis between dysregulated IRFs with each other based on the data from ICGC database.
Identification of IRFs Associated with Overall Survival and Clinical Outcomes of ccRCC
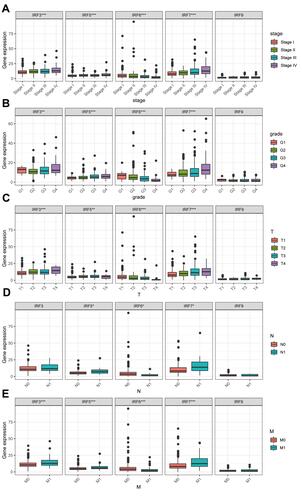
Using the Kaplan–Meier (KM) method, we assessed the association between the expression levels of IRFs with the overall survival of ccRCC. Results showed that high expression of IRF3/5/7/9 (, , , ) was associated with a poor prognosis of patients with ccRCC. In contrast, low IRF6 expression indicated a worse prognosis of patients with ccRCC (). However, no statistical significance of IRF1/2/4/8 was found (, , , ). The Kaplan–Meier plotter database was used for further validation, and results showed consistent results (–). Then, we assess the association between prognosis-related IRFs with clinical features of patients with ccRCC. As shown in –, elevated expression level of IRF5/7 and decreased expression levels of IRF6 indicated the advanced clinical stage, histologic grade, and TNM status, and high expression level of IRF3 was significantly associated with the advanced clinical stage, histologic grade, T, and M status. However, no statistical significance of IRF9 was found. The IRFs associated with overall survival and clinical outcomes of ccRCC, including IRF3/5/6/7, were used for in-depth investigation.
Figure 2 Survival Curves of dysregulated IRFs. (A) IRF1; (B) IRF2; (C) IRF3; (D) IRF4; (E) IRF5; (F) IRF6; (G) IRF7; (H) IRF8; (I) IRF9.
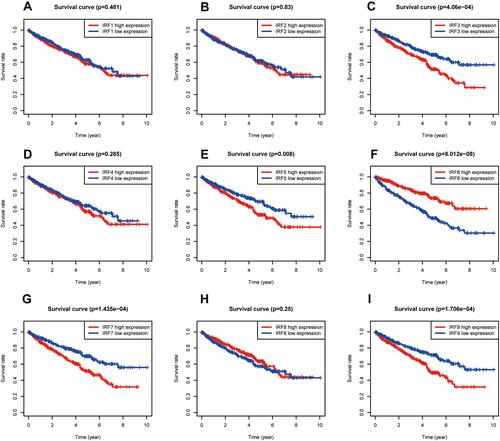
Figure 3 Survival Curves of dysregulated IRFs (Kaplan–Meier Plotter). (A) IRF1; (B) IRF2; (C) IRF3; (D) IRF4; (E) IRF5; (F) IRF6; (G) IRF7; (H) IRF8; (I) IRF9.
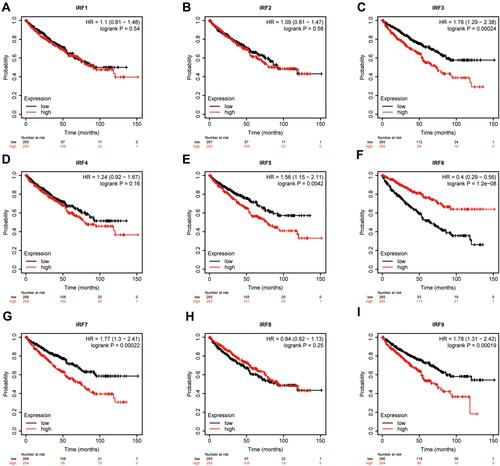
Figure 4 Association of IRF3/5/6/7/9 expression with clinicopathological characteristics. (A) Clinical stage; (B) histological grade; (C) T stage; (D) N stage; (E) M stage.
Identification of Independent Prognostic Factors
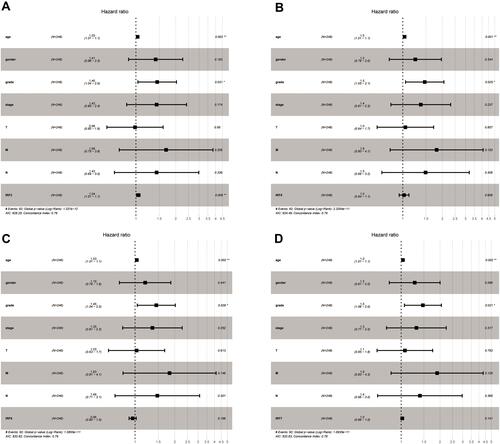
Then, we discovered that IRF3/5/6/7 were significantly associated with overall survival through the univariate Cox regression analysis, including IRF3 (HR = 1.064, p < 0.001), IRF5 (HR = 1.077, p < 0.05), IRF6 (HR = 0.897, p < 0.01) and IRF7 (HR = 1.038, p < 0.05) (). Additionally, several clinical factors also associated with prognosis, including age (HR = 1.023, p < 0.05), clinical stage (HR = 1.862, p < 0.001), histological grade (HR = 2.242, p < 0.001), T stage (HR = 1.943, p < 0.001), N stage (HR = 2.932, p < 0.01) and M stage (HR = 4.073, p < 0.001). Then, multivariate Cox regression analysis was applied for identification of independent prognostic factors. As presented in , IRF3 (HR = 1.032, p < 0.01), could independently predict overall survival of patient with ccRCC. However, no statistical significance of IRF5/6/7 was found (–). Thus, IRF3 was defined as a candidate IRF for further exploration.
Table 2 Univariate Cox Proportional Hazards Regression Analyses of IRFs and Clinical Features in ccRCC
Figure 5 Forest plots of the results of multivariate Cox regression analyses of significant prognostic factors: IRF3 (A); IRF5 (B); IRF6 (C); IRF7 (D).
Validation of IRF3 Expression in ccRCC
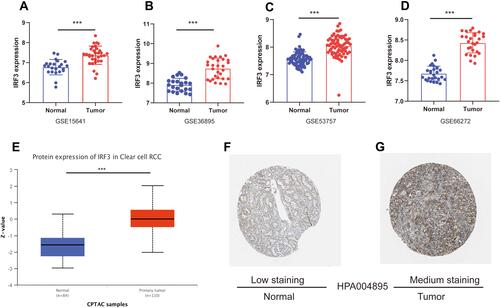
Using the data from the GSE15641, GSE36895, GSE53757, and GSE66272, we further validated the expression levels in ccRCC and normal renal tissues. As illustrated in –, IRF3 was highly expressed in ccRCC samples compared to in noncancerous samples (both p-value less than 0.001). Protein expression data from the UALCAN database revealed that IRF3 protein was also significantly higher in ccRCC tissues than in adjacent normal tissues (). Representative images revealed that IRF3 showed a “Low” staining in normal renal sample (), whereas displayed a “Medium” staining in ccRCC sample (). Additionally, we estimated the association between IRF3 expression and patients’ clinical features using the Fisher's exact test or chi-square test, and results indicated that IRF3 expression was remarkably correlated with the clinical stage (p < 0.01), histological grade (p < 0.05), and T status (p < 0.01) ().
Table 3 Association of IRF3 Expression with Clinicopathological Characteristics (Fisher's Exact Test or Chi-Square Test)
Figure 6 Validation of IRF3 expression in ccRCC. (A–D) IRF3 was highly expressed in ccRCC samples compared to in noncancerous samples in the GSE15641, GSE36895, GSE53757, and GSE66272 datasets. (G) Protein expression data from the UALCAN database revealed that IRF3 protein was also significantly higher in ccRCC tissues than in adjacent normal tissues. (F–G) The immunohistochemical staining is “Low” in normal renal sample; while the immunohistochemical staining is “medium” in ccRCC sample.
Genetic Mutation Analysis and PPI Network Construction
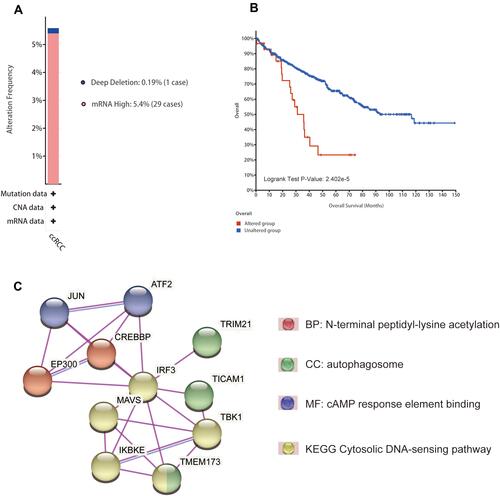
As illustrated in , we found that “mRNA High” was the most frequent genetic alteration overall using the cbioportal database, and the mutation frequency is 5.4% (29 cases); additionally, we observed a case with mutation of “Deep Deletion”. What is more, Kaplan–Meier analysis result show that altered group has a worse overall survival than that of unaltered group (). Next, we construct a PPI network and identify ten functional partners of IRF3 experimentally verified, including JUN, ATF2, EP300, CREBBP, MAVS, TRIM21, IKEKB, TICAM1, TBK1, and TMEM173; further analysis indicates that N-terminal peptidyl-lysine acetylation, autophagosome, cAMP response element binding, and Cytosolic DNA-sensing pathway are the most significant functional enrichment terms of IRF3 and its functional partners ().
Figure 7 Genetic analysis and PPI network construction. (A) Mutation types and frequencies of IRF3 in ccRCC. (B) Kaplan–Meier analysis result show that altered group has a worse overall survival than that of unaltered group. (C) PPI network construction and its enriched functional enrichment items.
Functional Enrichment Analyses Between High and Low IRF3 Expression Subgroups
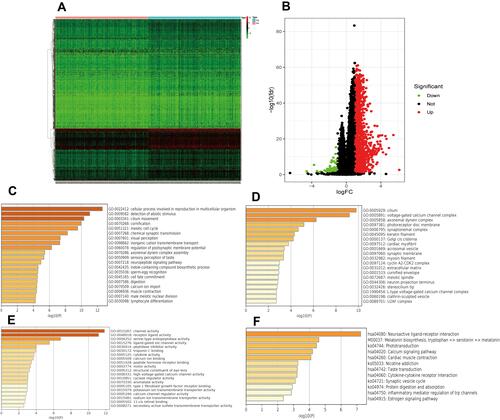
To explore the regulation of IRF3-related mechanisms. We identified differentially expressed genes (DEGs) between the high and low gene expression subgroups. Heatmaps of DEGs are presented in . Volcano plots of DEGs are shown in . Through the Metascape database, we functionally explored the DEGs using gene ontology (GO) and Kyoto Encyclopedia of Genes and Genomes (KEGG) pathway analyses. In terms of BP, IRF3 was mainly involved in cellular process, involved in reproduction in multicellular organism, detection of abiotic stimulus, and cilium movement (). In the CC group, IRF3 was significantly involved in cilium, voltage-gated calcium channel complex, and axonemal dynein complex (). As for MF, IRF3 was mainly enriched in channel activity, receptor-ligand activity, and serine-type endopeptidase activity (). KEGG pathway analysis showed that IRF3 was significantly associated with neuroactive ligand–receptor interaction, calcium signaling pathway, and cytokine–cytokine receptor interaction ().
Figure 8 Heat map and volcano map of differentially expressed genes (DEGs) between high and low IRF3 expression groups (A and B); BP, CC, MF and KEGG analyses of DEGs between high and low IRF3 expression groups (C–F).
The Relationship of IRF3 with TIICs
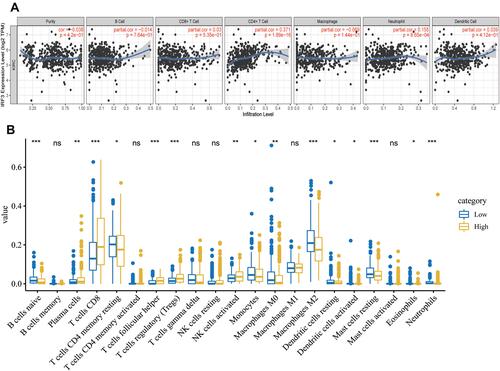
Using the TIMER database, we found that the expression levels of IRF3 were positively associated with the immune infiltration levels CD4+ T cells (cor = 0.371, p < 0.001) and Neutrophils (cor = 0.155, p < 0.001) (). Then, we performed CIBERSORT algorithm to further analyze the relationship between IRF3 and TIICs. As illustrated in , the high IRF3 expression group showed higher levels of immune infiltration of Plasma cells (p < 0.01), CD8 + T cells (p < 0.001), T cells follicular helper (p < 0.001), regulatory T cells (Tregs) (p < 0.001), and activated NK cells (p < 0.01), while the low IRF3 expression group exhibited higher levels of immune infiltration of naive B cells (p < 0.001), CD4 memory resting T cells (p < 0.05), Monocytes (p < 0.05), M0 Macrophages (p < 0.05), M2 Macrophages (p < 0.001), resting Dendritic cells (p < 0.05) activated Dendritic cells (p < 0.05), Eosinophils (p < 0.05), and Neutrophils (p < 0.001). These results implied that IRF3 may play a critical role in regulation of the immune microenvironment for ccRCC.
Figure 9 Association between IRF3 and immune cell infiltrations. (A) Association between the expression levels of IRF3 with immune cell infiltrations (TIMER database). (B) Association between the expression levels of IRF3 with immune cell infiltrations (CIBERSORT algorithm).
The Association of IRF3 with Immune-Related Genes
To further understand the association between IRF3 expression and various infiltrating immune cell types, we investigated the association between IRF3 expression and relevant gene markers for each immune cell type using the TIMER and GEPIA databases. These markers were derived from different immune cells, including CD8+ T cell, T cell (general), B cell, Monocyte, TAM, M1 Macrophage, M2 Macrophage, Neutrophil, Natural killer cell, Dendritic cell, Th1, Th2, Tfh, Th17, Treg, and T cell exhaustion. Using the TIMER database, we obtained the correlation results after adjustment for tumor purity. As revealed in , we noticed that IRF3 expression levels were significantly correlated with 37 of the 56 immune cell markers in KIRC. Notably, we found that the expression levels of Treg and T cell exhaustion gene markers showed a strong correlation with IRF3 expression in KIRC. We thus further explored these gene markers with IRF3 expression in KIRC via the GEPIA database, and the results similar to those from the TIMER database (). The findings investigate that IRF3 might contribute to the immune escape of cancer cells in KIRC.
Table 4 Correlation Analysis Between IRF3 and Relate Genes and Markers of Immune Cells in TIMER Database
Table 5 Correlation Analysis Between IRF3 and Relate Genes and Markers of Treg Cells and Exhausted T Cells in GEPIA Database
Discussion
Clear cell renal cell carcinoma is a highly aggressive malignant tumor with a poor prognosis and increased mortality, and it is an urgent need to find the more promising biomarkers and therapeutic targets for ccRCC patients. Interferon regulatory transcription factor (IRF) family was composed of nine gene members, IRF1 to IRF9. Abundant reports have confirmed their roles in various malignancies. Their clinical implications and mechanisms in ccRCC, however, remain to be elucidated.
Herein, we discovered that all IRFs were abnormally expressed in ccRCC. Among these dysregulated IRFs, IRF1/2/3/4/5/7/8/9 were significantly higher in ccRCC tissues than in noncancerous tissues, whereas IRF6 significantly decreased in ccRCC tissues by comparison with in normal renal tissues. Survival analysis revealed that high expression levels of IRF3/5/7/9 were significantly associated with worse overall survival of patients with ccRCC, while low IRF6 expression indicated an adverse prognosis. Then, the correlation between IRF3/5/6/7/9 expression with clinical features showed that elevated IRF3/5/7 expression and decreased IRF6 expression were remarkably correlated with patient’s clinical outcomes. Additionally, we identified IRF3 as a candidate IRF in ccRCC, which could independently predict ccRCC patients’ OS. Subsequently, Further analyses confirmed that IRF3 was highly expressed in ccRCC and associated with poor clinical outcomes.
IRF3 is a well-characterized signaling transcription factor that plays a crucial role in the innate antiviral response.Citation39 In human host cells, viral DNA and RNA can activate TLRs and promote signal transduction, which subsequently phosphorylates and activates IRF3 through a series of reactions.Citation40 Activated IRF3 forms a dimer and enters the nucleus to regulate type I interferon and interferon-stimulated genes.Citation41 Interestingly, danger signals of self-origin such as DNA damage also promote anti-tumor immunity by activating the IRF3-related signal transduction pathways in cancer.Citation42 This finding suggests that IRF3 might play a crucial role in cancer progression and immunity. In this work, we found that IRF3 was abnormally upregulated in ccRCC and resulted in a worse prognosis and advanced clinical status, indicating that IRF3 might serve as an oncogene in ccRCC. Furthermore, genetic analysis revealed that genetic mutations may play a crucial role in the regulation of IRF3 expression in ccRCC. Then, JUN, ATF2, EP300, CREBBP, MAVS, TRIM21, IKEKB, TICAM1, TBK1, and TMEM173 were found to be functional partners of IRF3. Functional analysis showed that these genes are mainly involved in N-terminal peptidyl-lysine acetylation, autophagosome, cAMP response element binding, and cytosolic DNA-sensing pathway.
Then, we conducted GO and KEGG analyses to further investigate the regulation of IRF3-related mechanisms. Interestingly, we found that IRF3 was significantly enriched in receptor-ligand activity, cytokine–cytokine receptor interaction, channel activity, and calcium signaling pathway. Some ligand/receptor signaling pathways played critical roles in regulating the immune system and cancer progression;Citation43 cytokine–cytokine receptor interaction was a crucial immune signaling pathway and also significantly associated with cancer progression.Citation44 Changes of channel activity and dysregulation of the calcium signaling pathway were essential characteristics of solid tumors associated with invasiveness and uncontrolled malignant behaviors.Citation45 These signaling pathways were related to cancer progression and also were the key points to learn about the pathophysiological mechanism of IRF3 in ccRCC.
Then, we focused on the relationship between IRF3 and the TIICs in ccRCC, and we discovered the differences in infiltrating immune cells between the high and low IRF3 expression subgroups. The differences might be one reason for the different clinical outcomes of the different groups of patients. Another interesting finding of this study is that most of the immune-related gene markers were significantly associated with the IRF3 expression, especially for those gene markers for regulatory T (Treg) cells and exhausted T cells, such as FOXP3, TGFB1, PDCD1, CTLA4, LAG3, and GZMB. Treg cells were involved in tumor development by suppressing anti-tumor immunity; FOXP3 was highly expressed on highly immunosuppressive Treg cells, and the increased levels of FOXP3 within the tumor microenvironment were remarkably correlated with poor prognosis in various cancer patients.Citation46 TGF-β1 bond to the membrane protein GARP and subsequently was activated on the surface of Treg cells, which exerted contact-dependent inhibition on immune cells.Citation47 PDCD1, CTLA4, LAG3, and GZMB were classical immune checkpoints that have the tumor-promoting phenotype during tumor progression and assist the immune escape of tumor cells.Citation48 The results revealed that IRF3 might play critical role in regulating the immunosuppressive phenotypes in the TME of ccRCC.
Herein, we identified IRF3 as a potential prognostic biomarker and therapeutic target for ccRCC through comprehensive bioinformatics analysis. Nevertheless, some limitations should not be disregarded. Larger sample size and sufficient clinical information were required to confirm our findings because of the limited clinical and pathological information. Additionally, the precise mechanism of IRF3 in ccRCC progression and tumor immunity has not been fully illustrated. Therefore, more substantial evidence should be performed to validate our findings.
Ethical Approval and Consent to Participate
The public database mentioned in this study is publicly available for re-analyzing, and no ethical approval was required by the local ethics committees, so that this study does not require the ethics approval.
Author Contributions
All authors made a significant contribution to the work reported, whether that is in the conception, study design, execution, acquisition of data, analysis and interpretation, or in all these areas; took part in drafting, revising or critically reviewing the article; gave final approval of the version to be published; have agreed on the journal to which the article has been submitted; and agree to be accountable for all aspects of the work.
Disclosure
The authors declare that they have no competing interests.
Additional information
Funding
References
- Grignon DJ, Che M. Clear cell renal cell carcinoma. Clin Lab Med. 2005;25(2):305–316. doi:10.1016/j.cll.2005.01.012
- Hsieh JJ, Purdue MP, Signoretti S, et al. Renal cell carcinoma. Nat Rev Dis Primers. 2017;3:17009.
- Barata PC, Rini BI. Treatment of renal cell carcinoma: current status and future directions. CA Cancer J Clin. 2017;67(6):507–524. doi:10.3322/caac.21411
- Tamura T, Yanai H, Savitsky D, et al. The IRF family transcription factors in immunity and oncogenesis. Annu Rev Immunol. 2008;26:535–584. doi:10.1146/annurev.immunol.26.021607.090400
- Yan Y, Zheng L, Du Q, et al. Interferon regulatory factor 1 (IRF-1) and IRF-2 regulate PD-L1 expression in hepatocellular carcinoma (HCC) cells. Cancer Immunol, Immunother. 2020;69(9):1891–1903. doi:10.1007/s00262-020-02586-9
- Rho SB, Lee SH, Byun HJ, et al. IRF-1 inhibits angiogenic activity of HPV16 E6 oncoprotein in cervical cancer. Int J Mol Sci. 2020;21(20):7622.
- Chen YJ, Liang L, Li J, et al. IRF-2 inhibits gastric cancer invasion and migration by down-regulating MMP-1. Dig Dis Sci. 2020;65(1):168–177. doi:10.1007/s10620-019-05739-8
- Gambara G, Desideri M, Stoppacciaro A, et al. TLR3 engagement induces IRF-3-dependent apoptosis in androgen-sensitive prostate cancer cells and inhibits tumour growth in vivo. J Cell Mol Med. 2015;19(2):327–339. doi:10.1111/jcmm.12379
- Biswas SK, Gangi L, Paul S, et al. A distinct and unique transcriptional program expressed by tumor-associated macrophages (defective NF-kappaB and enhanced IRF-3/STAT1 activation). Blood. 2006;107(5):2112–2122. doi:10.1182/blood-2005-01-0428
- Huber M, Lohoff M. IRF4 at the crossroads of effector T-cell fate decision. Eur J Immunol. 2014;44(7):1886–1895. doi:10.1002/eji.201344279
- Acquaviva J, Chen X, Ren R. IRF-4 functions as a tumor suppressor in early B-cell development. Blood. 2008;112(9):3798–3806. doi:10.1182/blood-2007-10-117838
- Ortmann CA, Burchert A, Lzle HK, et al. Down-regulation of interferon regulatory factor 4 gene expression in leukemic cells due to hypermethylation of CpG motifs in the promoter region. Nucleic Acids Res. 2005;33(21):6895–6905. doi:10.1093/nar/gki1001
- Massimino M, Vigneri P, Fallica M, et al. IRF5 promotes the proliferation of human thyroid cancer cells. Mol Cancer. 2012;11(21):1–8. doi:10.1186/1476-4598-11-21.
- Guo J, Wang X, Wang Y, et al. A promising role of interferon regulatory factor 5 as an early warning biomarker for the development of human non-small cell lung cancer. Lung Cancer. 2019;135:47–55. doi:10.1016/j.lungcan.2019.07.008
- Xu HF, Huang TJ, Yang Q, et al. Candidate tumor suppressor gene IRF6 is involved in human breast cancer pathogenesis via modulating PI3K-regulatory subunit PIK3R2 expression. Cancer Manag Res. 2019;11:5557–5572. doi:10.2147/CMAR.S203060
- Li D, Cheng P, Wang J, et al. IRF6 is directly regulated by ZEB1 and ELF3, and predicts a favorable prognosis in gastric cancer. Front Oncol. 2019;9:220. doi:10.3389/fonc.2019.00220
- Ren Y, Dong J, He P. miR-587 promotes cervical cancer by repressing interferon regulatory factor 6. J Gene Med. 2020;22(11):e3257.
- Nobeyama Y, Nakagawa H. Silencing of interferon regulatory factor gene 6 in melanoma. PLoS One. 2017;12(9):e0184444. doi:10.1371/journal.pone.0184444
- Bidwell BN, Slaney CY, Withana NP, et al. Silencing of Irf7 pathways in breast cancer cells promotes bone metastasis through immune escape. Nat Med. 2012;18(8):1224–1231. doi:10.1038/nm.2830
- Li Y, Huang R, Wang L, et al. microRNA-762 promotes breast cancer cell proliferation and invasion by targeting IRF7 expression. Cell Prolif. 2015;48(6):643–649. doi:10.1111/cpr.12223
- Meyer MA, Baer JM, Knolhoff BL, et al. Breast and pancreatic cancer interrupt IRF8-dependent dendritic cell development to overcome immune surveillance. Nat Commun. 2018;9(1):1250. doi:10.1038/s41467-018-03600-6
- Zhang Q, Zhang L, Li L, et al. Interferon regulatory factor 8 functions as a tumor suppressor in renal cell carcinoma and its promoter methylation is associated with patient poor prognosis. Cancer Lett. 2014;354(2):227–234. doi:10.1016/j.canlet.2014.07.040
- Tian WL, Guo R, Wang F, et al. The IRF9-SIRT1-P53 axis is involved in the growth of human acute myeloid leukemia. Exp Cell Res. 2018;365(2):185–193. doi:10.1016/j.yexcr.2018.02.036
- Brunn D, Turkowski K. Interferon regulatory factor 9 promotes lung cancer progression via regulation of versican. Cancers. 2021;13(2):208.
- Hutter C, Zenklusen JC. The cancer genome atlas: creating lasting value beyond its data. Cell. 2018;173(2):283–285. doi:10.1016/j.cell.2018.03.042
- Zhang J, Bajari R, Andric D. The international cancer genome consortium data portal. Nature. 2019;37(4):367–369.
- Jones J, Otu H, Spentzos D, et al. Gene signatures of progression and metastasis in renal cell cancer. Clin Cancer Res. 2005;11(16):5730–5739. doi:10.1158/1078-0432.CCR-04-2225
- A-llopis PE, Liao A, BAP1 loss defines a new class of renal cell carcinoma. Nat Genet. 2012;44(7):751–759. doi:10.1038/ng.2323
- A-llopis PE, Brugarolas J. Simultaneous isolation of high-quality DNA, RNA, miRNA and proteins from tissues for genomic applications. Nat Protoc. 2013;8(11):2240–2255. doi:10.1038/nprot.2013.141
- Von Roemeling CA, Radisky DC, Marlow LA, et al. Neuronal pentraxin 2 supports clear cell renal cell carcinoma by activating the AMPA-selective glutamate receptor-4. Cancer Res. 2014;74(17):4796–4810. doi:10.1158/0008-5472.CAN-14-0210
- Wotschofsky Z, Gummlich L, Liep J, et al. Integrated microRNA and mRNA signature associated with the transition from the locally confined to the metastasized clear cell renal cell carcinoma exemplified by miR-146-5p. PLoS One. 2016;11(2):e0148746. doi:10.1371/journal.pone.0148746
- Liep J, Kilic E, Meyer HA, et al. Cooperative effect of miR-141-3p and miR-145-5p in the regulation of targets in clear cell renal cell carcinoma. PLoS One. 2016;11(6):e0157801. doi:10.1371/journal.pone.0157801
- Nagy Á, Munkácsy G, Győrffy B. Pancancer survival analysis of cancer hallmark genes. Sci Rep. 2021;11(1):6047. doi:10.1038/s41598-021-84787-5
- Chandrashekar DS, Bashel B, Balasubramanya SAH, et al. UALCAN: a portal for facilitating tumor subgroup gene expression and survival analyses. Neoplasia (New York, NY). 2017;19(8):649–658. doi:10.1016/j.neo.2017.05.002
- Colwill K, GR SLUND S. A roadmap to generate renewable protein binders to the human proteome. Nat Methods. 2011;8(7):551–558. doi:10.1038/nmeth.1607
- Zhou Y, Zhou B, Pache L, et al. Metascape provides a biologist-oriented resource for the analysis of systems-level datasets. Nature. 2019;10(1):1523.
- Li T, Fan J, Wang B, et al. TIMER: a web server for comprehensive analysis of tumor-infiltrating immune cells. Cancer Res. 2017;77(21):e108–e10. doi:10.1158/0008-5472.CAN-17-0307
- Newman AM, Liu CL, Green MR. Robust enumeration of cell subsets from tissue expression profiles. Nature. 2015;12(5):453–457.
- O’neill LA, Bowie AG. Sensing and signaling in antiviral innate immunity. Current Biol. 2010;20(7):R328–R333. doi:10.1016/j.cub.2010.01.044
- Sharma S, Tenoever BR, Grandvaux N, et al. Triggering the interferon antiviral response through an IKK-related pathway. Science. 2003;300(5622):1148–1151. doi:10.1126/science.1081315
- Shinobu N, Iwamura T, Yoneyama M, et al. Involvement of TIRAP/MAL in signaling for the activation of interferon regulatory factor 3 by lipopolysaccharide. FEBS Lett. 2002;517(1–3):251–256. doi:10.1016/S0014-5793(02)02636-4
- Liu H, Zhang H, Wu X, et al. Nuclear cGAS suppresses DNA repair and promotes tumorigenesis. Nature. 2018;563(7729):131–136. doi:10.1038/s41586-018-0629-6
- Kim JW, Cochran JR. Targeting ligand-receptor interactions for development of cancer therapeutics. Curr Opin Chem Biol. 2017;38:62–69. doi:10.1016/j.cbpa.2017.03.010
- Spangler JB, Moraga I, Mendoza JL, et al. Insights into cytokine-receptor interactions from cytokine engineering. Annu Rev Immunol. 2015;33:139–167. doi:10.1146/annurev-immunol-032713-120211
- Cui C, Merritt R, Fu L, et al. Targeting calcium signaling in cancer therapy. Acta Pharmaceutica Sinica B. 2017;7(1):3–17. doi:10.1016/j.apsb.2016.11.001
- Saleh R, Elkord E. FoxP3(+) T regulatory cells in cancer: prognostic biomarkers and therapeutic targets. Cancer Lett. 2020;490:174–185. doi:10.1016/j.canlet.2020.07.022
- Cuende J, Li Nart S, Dedobbeleer O, et al. Monoclonal antibodies against GARP/TGF-β1 complexes inhibit the immunosuppressive activity of human regulatory T cells in vivo. Sci Transl Med. 2015;7(284):284ra56. doi:10.1126/scitranslmed.aaa1983
- Abril-rodriguez G, Ribas A. SnapShot: immune checkpoint inhibitors. Cancer Cell. 2017;31(6):848–e1. doi:10.1016/j.ccell.2017.05.010