
Abstract
Background
Skin cutaneous melanoma (SKCM) is the most malignant tumor among skin cancers. Immunotherapy has shown a great role in the advantageous prognosis of SKCM. However, only a small percentage of people can benefit from immunotherapy. To date, there has been insufficient evidence to reveal the prognostic value of m6A in SKCM and its relationship with the infiltration of immune cells and the efficacy of immunotherapy.
Methods
Here, we synthetically analyzed 23 m6A regulators from SKCM samples collected from the TCGA and GEO databases. We defined three m6A modification patterns and constructed m6A scores using principal component analysis (PCA).
Results
We found significant differences in overall survival (OS) and immune infiltration between different m6A subclusters. Besides, m6A score was positively correlated with regulatory T-cell and helper T-cell content, which may account for the association of high m6A scores with superior prognosis. Multivariate Cox regression analysis revealed that the m6A score was an independent prognostic indicator. Moreover, patients with high m6A scores showed a better response to immunotherapy, and this result was further validated in two independent immunotherapy cohorts receiving anti-PD-1/PD-L1 therapy.
Conclusion
The findings suggested the m6A score can screen suitable candidates for immunotherapy and can predict immunotherapy response. This analysis of different m6A patterns in a large sample of SKCM expanded our understanding of TME and provided new ideas for prognostic assessment and personalized immunotherapy strategies for SKCM patients.
Introduction
SKCM, the most malignant of skin cancers, had over 200,000 new cases and over 60,000 deaths worldwide in 2018.Citation1 Even though the number of cutaneous melanoma cases accounts for a small percentage of skin cancer cases, only 4%, it is already the 19th most prevalent tumor in the world,Citation2 seriously threatening human life and health.Citation3 UV radiation is considered to be a major environmental factor in the development of SKCM,Citation4,Citation5 especially the level of UV-B radiation,Citation6–Citation8 which is significantly associated with the development of SKCM. Traditional cancer treatments, such as radiation therapy, chemotherapy, and surgical resection, have little effect on the long-term prognosis of SKCM patients.Citation9 In the past decade, emerging therapies, such as anti-CTLA4 and anti-PD-1/PD-L1, have the potential to prolong the survival of patients with malignant SKCM.Citation10 However, adverse drug events are also on the rise, and only a small percentage of people will benefit from these therapies.Citation11 The treatment of SKCM patients remains an evolving and difficult subject.Citation12 Therefore, the development of truly meaningful prognostic markers for SKCM patients is of profound importance to assess the clinical outcome and long-term prognosis of patients.
N6-methyladenosine (m6A), a base modification behavior widely found on messenger RNA (mRNA), is the most dominant and common form of modification within mRNA,Citation13,Citation14 and its main role is to maintain the stability of mRNA. M6A regulation is a reversible modification behavior consisting of three main regulatory factors: demethylases, methyltransferases, and m6A-binding proteins.Citation15 The methyltransferases (defined as ‘writers’) mainly act to induce m6A methylation modification of mRNA bases, and the main regulatory genes are METTL3, METTL14, and WTAP.Citation16 Demethylases (defined as ‘erasers’)Citation16,Citation17 mainly functions to demethylate bases that have undergone methylation modification. FTO and ALKHB5 are the main demethylase regulatory genes. M6A-binding proteins (defined as “readers”) recognize potential m6A modified bases to initiate downstream regulatory pathways and the main regulatory genes are YTHDC1, YTHDC2, YTHDF1, and FMR1.Citation17
Certain studies have reported m6A modification behavior in almost all life activities and various diseases (including cancer) in the human body.Citation18,Citation19 M6A modifications are involved in gene expression at various levels of the body through interactions with various reader proteins and corresponding complexes, including heat shock, tissue development, DNA damage, stem cell renewal, and differentiation.Citation14,Citation17,Citation20,Citation21 Besides, dysregulation of m6A-related regulators plays an important role in cancer initiation, invasion, and drug therapy.Citation22 Indeed, the m6A demethylase FTO is key to the oncogenicity of SKCM and patient response to anti-PD-1 immunotherapy.Citation23 Abnormal regulation of the m6A binding protein factor YTHDF1 was also found to be critical for cell proliferation and cancer progression in non-small cell carcinoma (NSCLC) and low expression of YTHDF1 resulted in NSCLC patient resistance to cisplatin therapy and poorer outcomes.Citation24
In this study, we combined TCGA-SKCM and GSE65904 in a comprehensive analysis to clarify the prognostic value of regulators of m6A in SKCM and to assess the predictive efficacy of m6A-related genes in the efficacy of immunotherapy in SKCM patients. This provides new insights into the clinical diagnosis and treatment of SKCM patients.
Materials and Methods
Processing and Acquisition of SKCM Data
The publicly available database The Cancer Genome Atlas (TCGA)Citation25 was used to collect data from 471 SKCM samples, including copy number variation (CNV), transcriptome RNA sequences (FPKM value), single nucleotide polymorphism (SNP), and complete clinical information. Besides, transcriptome RNA sequences of 812 normal skin tissue samples were collected from the University of California Santa Cruz Xena database (https://xenabrowser.net/datapages/, UCSC). The GSE65904 cohort, containing transcriptome RNA sequences from 214 SKCM samples and complete clinical information, used for the combined analysis was collected from the Gene Expression Omnibus (https://whttps://www.ncbi.nlm.nih.gov/geo/, GEO) database. We comprehensively searched m6A-related genes from the published papers and obtained 23 m6A genes with different functions.Citation20,Citation26 For SKCM samples obtained in TCGA, we used the “limma” package in R software to convert the FPKM value into TPM value,Citation27 and then integrated and standardized it with the GSE65904 cohort for subsequent genetic and variant characterization. Similarly, 812 normal skin tissue samples obtained from UCSC were integrated and standardized with SKCM samples from TCGA for subsequent analysis of differential expression of m6A-related genes, including an analysis for two mutant subtypes in SKCM.
Clustering Analysis of m6A-Related Genes
Based on m6A-related genes expressed in SKCM patients, we used an unsupervised clustering method to classify SKCM patients into different subclusters. Here, we used the “ConsensuClusterPlus”Citation28 R package to perform the clustering and cycled 1000 times to ensure accurate and stable clustering. Subclusters were distinguished based on the method of minimal intra-group and maximal inter-group variances. The OS of SKCM patients between different subclusters were further analyzed by the Kaplan-Meier method. Furthermore, the distribution of the m6A regulatory genes among the three subclusters was presented as a heatmap.
Single-Sample Gene Set Enrichment Analysis (ssGSEA) and Gene Set Variation Analysis (GSVA)
GSVA can be used to assess the biologically relevant functions and regulatory pathways potentially regulated by genes.Citation29 Here, we used the GSVA algorithm to analyze the functional pathways in which the three m6A subclusters are predominantly enriched. Next, to assess the immune cell content in the tumor microenvironment (TME), we used the ssGSEA method to assess the relative abundance of immune cells infiltrated among the three m6A subclusters in SKCM patients.
Differentially Expressed Genes (DEGs) Associated with m6A Subclusters
The “limma” package (R software) was employed to screen for DEGs among the three m6A subclusters at a standard of adjusted P<0.001. Subsequently, Gene Ontology (GO)Citation30 function and Kyoto encyclopedia of genes and genomes (KEGG)Citation31 enrichment analyzes were conducted to label and visualize the key biological functions of DEGs.
Cluster Analysis Based on Prognostic DEGs
First, a univariate Cox regression model was used to identify DEGs related to prognosis in SKCM patients, and a total of 352 prognosis-related DEGs were obtained. Subsequently, SKCM patients were classified into different gene subclusters according to prognosis-related DEGs using unsupervised clustering, and OS between gene subgroups was evaluated using the Kaplan-Meier method. Besides, the DEGs between different gene subclusters were shown with a heatmap.
Construction of the m6A Score
Here, we used principal component analysis (PCA) to obtain scores for each SKCM patient based on the expression of prognosis-associated DEGs. First, the DEGs positively and negatively associated with clustering features were defined as m6A gene features A and B, respectively. Subsequently, the data were further dimensionally reduced using PCA. Finally, principal component 1 (PC1) and 2 (PC2) were used as m6A-related gene feature scores:
After obtaining the m6A score of each patient, we selected the optimal cutoff according to the “surv cutpoint” function to classify SKCM patients as having high or low m6A scores and analyzed the OS between the two groups. Furthermore, we further analyzed the difference of m6A scores between m6A clusters and gene clusters by using the R package “limma”.
Correlation Analysis Between m6A Score and Clinical Characteristics
The somatic mutation information corresponding to SKCM patients was collected from the TCGA (https://portal.gdc.cancer.gov/repository) public platform. We used the R package “maftools”Citation32 to assess somatic mutation types and characteristics of patients with high and low m6A scores and showed the top 20 genes with the highest mutation frequencies. Subsequently, patients were stratified into groups with a high or low TMB, according to the optimal cutoff, and the OS differences were further analyzed. To further investigate the differences in m6A score among clinical characteristics (Age, Gender, Stage). The R package “survival” was employed to analyze the OS of high and low m6A score groups in different genders and ages.
m6A Score with Immunotherapy
Immunotherapy and targeted therapies can significantly improve OS in patients with malignant melanoma, and less toxic combinations of immune checkpoint inhibitors (ICIs) are being investigated.Citation11 First, we analyzed the differences in Immune checkpoint blocking (ICB) genes (PDCD1, CD274, CTLA4)Citation33,Citation34 in high and low m6A score groups. Subsequently, we used The Cancer Immunome Atlas (TCIA, https://tcia.at/home) to collect immunophenotype score (IPS) data corresponding to TCGA-SKCM in order to further evaluate the treatment effects of anti-PD-1/PD-L1 and anti-CTLA4 in patients according to their m6A scores. Two independent cohorts (GSE93157, IMvigor210) receiving anti-PD-1/PD-L1 therapy validated the value of the m6A score in predicting response to immunotherapy. The GSE93157 cohort (n = 65), an immunotherapy cohort of patients with non-small cell lung cancer, head and neck squamous cell carcinoma, and melanoma receiving anti-PD-1 therapy, is available from the publicly available GEO platform. The IMvigor210 cohortCitation35 (n = 298), an anti-PD-L1 immunotherapy cohort for advanced uroepithelial carcinoma, is available for download from http://research-pub.gene.com/IMvigor210CoreBiologies and available under the Creative Commons 3.0 License.
Statistical Analysis
In this study, the function “surv-cutpoint” was used to obtain the cohort’s optimal cut-off to classify patients into high and low m6A score groups. This analysis was performed using the “survminer” in R package. Wilcox test was used for comparison between two groups and Kruskal–Wallis test was used for comparison of three groups and more than three groups. The prognostic value of m6A score was evaluated using the multivariate Cox regressions. Survival analysis related to the m6A score was performed using the Kaplan-Meier method. Survival difference statistics were analyzed using Log rank test. All data analyses were performed in the R software version 4.0.2. A p-value < 0.05 was defined as statistically significant.
Results
Genetic and Variational Landscape of m6A Regulators in SKCM
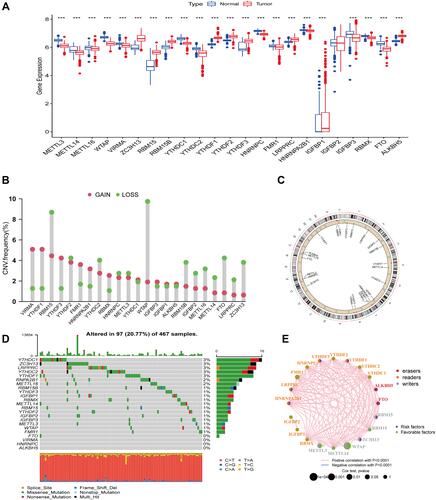
In recent years, the regulation mechanism of m6A-related genes and their relevance to several types of cancer have been deeply studied. In our study, we downloaded RNA sequences of 812 normal skin tissues from the UCSC Xena platform and combined them with melanoma samples obtained from the TCGA database to assess possible changes in the expression of m6A-related genes in normal skin tissues and melanoma samples. The result was shown in (P<0.05). Next, we intersected the gene CNV frequency data of SKCM with the 23 m6A genes and investigated the CNV of m6A-related genes in SKCM. Indeed, the frequency of losses of the copy number of the m6A gene was greater than the frequency of gain in SKCM, among which the loss of RBM15 and WTAP was significantly more than the frequency of gain (). The results of the m6A associated genes on different chromosomes with the lost and gain copy number were shown in . Moreover, we visualized the mutation data of m6A-related genes in SKCM, and the top five genes with mutation frequency were YTHDC1 (3%), ZC3H13 (3%), LRPPRC (3%), YTHDC2 (3%), YTHDF1 (3%) (). Besides, after removing m6A-related genes with zero expression in SKCM patients, we used the univariate Cox survival analysis and Kaplan-Meier survival method to understand the possible link between genes related to m6A with the OS of SKCM patients. The results of the m6A gene prognostic co-expression network showed that the interactions between prognosis-related m6A genes were positively correlated, with WTAP being significantly associated with prognosis in SKCM patients ().
Figure 1 Genetic and variational landscape of m6A regulators in SKCM. (A) Expression of 23 m6A-related genes in normal skin tissues versus cutaneous melanoma tissues. Blue represents normal tissues and red represents tumor tissues (***represents: P < 0.001). (B) m6A-related gene copy number variation frequency. Red represents gain and green represents a loss. (C) m6A-related gene copy number variation in different chromosomal locations. Red indicates that the sample with increased copy number is greater than the sample with loss, and blue indicates that the sample with loss is greater than the increase. (D) Waterfall plot of m6A regulators mutation levels. (E) Prognostic network for the m6A regulator. Red circles represent “erasers”, orange represents “readers”, and gray represents “writers”.
Consensus Clustering Based on m6A Genes
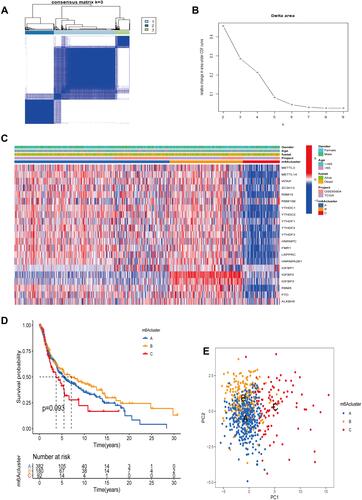
In order to identify potential underlying mechanisms of genes related to m6A in SKCM development and progression, we classified SKCM into different molecular subclusters by consensus expression of m6A regulators. We used the “ConsensusClusterPlus” package in the R software to classify SKCM patients into different clusters. When K =3, the clusters are closely related internally and have minimal crossover outside the clusters ( and ). The heatmap of the m6A cluster evidenced that genes related to m6A were lowly expressed in cluster C, followed by cluster A and highest in cluster B (). Next, we further analyzed the OS between three different m6A clusters in TCGA-SKCM using the Kaplan-Meier method, and we found that the OS in cluster B was significantly better than the other two clusters (). This suggests to us that high levels of m6A-related genes may be related to a good prognosis of SKCM patients. Besides, after employing PCA to identify changes in gene expression among the above three molecular subclusters, we observed that the levels of m6A-related genes could indeed distinguish SKCM patients into three different molecular subclusters ().
Figure 2 Clustering analysis based on the expression of m6A-related genes. (A) Consensus clustering subclusters at K=3. (B) Relative change in the area under the CDF curve when K = 2 to 9. (C) The heatmap of m6A regulators and different clinical features in three subgroups. (D) Kaplan-Meier survival curves between three m6A subclusters. (E) Principal component analysis under m6A modification pattern.
GSVA and ssGSEA Between Different m6A Molecular Subclusters
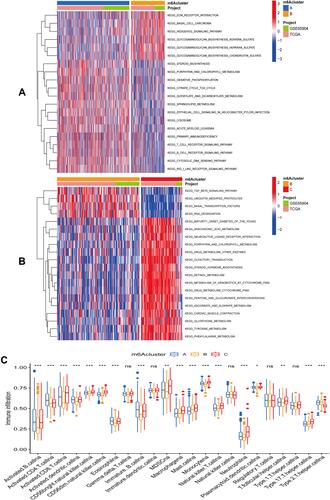
GSVA was applied to the three m6A clusters to understand the potential biological regulatory pathways between the different m6A clusters in SKCM. From the results of the two-by-two comparison between cluster A and cluster B, we know that cluster A is mainly concentrated in steroid biosynthesis, porphyrin, and chlorophyll metabolism while cluster B is concentrated in ECM receptor interaction, TGF beta signaling pathway and ubiquitin-mediated protein hydrolysis (). In the comparison between cluster B and cluster C, the neuroactive ligand-receptor interaction and arachidonic acid metabolism were active in cluster C (). Single-sample gene set enrichment analysis of SKCM allowed us to detect differences in immune cell levels across the three m6A clusters mentioned above in the immune microenvironment of SKCM. From the results, we detected differences in the content of most immune cells among the three m6A subclusters (). This suggests to us that the levels of m6A-related genes may guide immunotherapy in patients with SKCM.
Figure 3 GSVA and ssGSEA between different m6A subclusters. (A) GSVA analysis between subclusters A and B. (B) GSVA analysis between subclusters B and C. (C) Differential immune cell infiltration among three m6A subclusters in the SKCM immune microenvironment (***represents: P < 0.001; **represents P < 0.01; *represents P < 0.05).
DEGs in Three m6A Subclusters
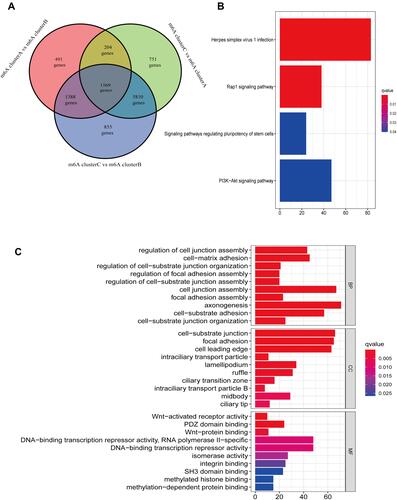
To investigate potential biological functions of the different subclusters, we made the criterion adjusted P-value < 0.001 to screen the DEGs between the different subclusters. A total of 1569 DEGs were screened (). Next, KEGG pathway enrichment and GO functional enrichment analysis were performed on the above DEGs. From the results of KEGG enrichment analysis we can know that such DEGs mainly act in herpes simplex virus type 1 infection, PI3K-Akt and Rap1 signaling pathways, and signaling pathway regulating stem cell pluripotency (). Furthermore, At the biological process (BP) level of GO enrichment analysis, DEGs are mainly enriched in regulation of cell junction assembly, cell-matrix adhesion, and regulation of cell-substrate junction organization. Besides, cell composition analysis (CC) results evidenced that the above DEGs were enriched in the cell leading edge, focal adhesion, and cell−substrate junction. Molecular function (MF) fractionation, on the other hand, showed that DEGs play a role in Wnt-activated receptor activity, PDZ domain binding, and wnt-protein binding ().
Figure 4 Identification and functional annotation of DEGs. (A) Venn diagram of intersecting genes between m6A subclusters. (B) KEGG pathway enrichment analysis of DEGs. (C) GO function enrichment analysis of DEGs.
Construction of the Subtypes of DEGs
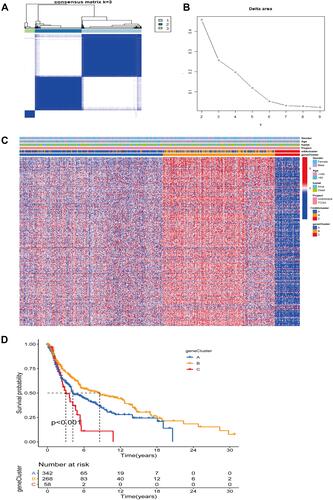
Similarly, to better analyze the interactions and consistency within DEGs, we used an unsupervised clustering approach to construct a hierarchical clustering assessment of the expression profiles of prognostic related DEGs. When K=3, there was the least crossover among subclusters, the strongest connection within subclusters (), and the least relative changes in the area under the CDF curve (). Further, a boxplot (Figure S1) was drawn to visualize expression of m6A genes between different gene clusters, and we found that WTAP, RBM15, YTHDC2, HNRNPA2B1, IGFBP2, IGFBP3, RBMX, FTO, and ALKBH5 were expressed at higher levels in cluster B than in the other two clusters, while ZC3H13, YTHDC1, YTHDF3, FMR1, and LRPPRC were expressed at significantly lower levels in cluster C than in the other two clusters (***P < 0.001). Heatmaps based on different subclusters of DEGs and different clinical characteristics showed that DGEs were highly expressed in cluster B, followed by cluster A and finally cluster C (). Similarly, in the Kaplan-Meier survival analysis of the three subclusters, cluster B had the longest OS time, followed by cluster A and finally cluster C (). This suggests to us that there may be some association between high expression of DEGs and better survival of SKCM patients, which may give a novel perspective into the clinical treatment of SKCM patients.
Figure 5 Consensus clustering analysis based on DEGs. (A) When K=3, the different gene consensus clustering subclusters. (B) Relative change in the area under the CDF curve when K = 2 to 9. (C) The heatmap of DEGs and different clinical features in three gene subgroups. (D) Kaplan-Meier survival curves between three gene subclusters.
Constructing the m6A Score
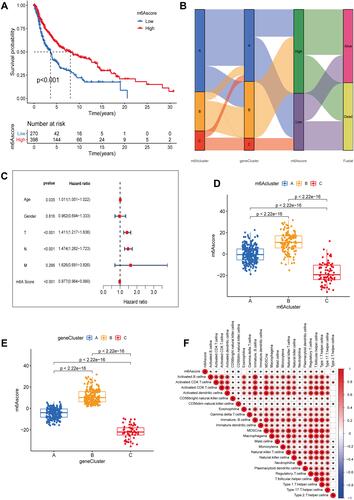
To assign a quantitative index of m6A gene correlation to SKCM patients, we used principal component analysis (PCA) to obtain m6A score 1 and m6A score 2. The sum of m6A score 1 and m6A score 2 was used as an independent correlation score for SKCM patients. Ultimately, we obtained a prognostic risk score defined as the m6A score. SKCM patients were stratified according to their m6A scores, and survival differences were analyzed across groups. The survival rate was significantly increased in patients with a high m6A score when compared to that of the low score group (). Meanwhile, we used a Sankey diagram to further demonstrate the distribution of SKCM patients between m6A clusters, gene clusters, m6A score groups, and survival status. Most SKCM patients were in the m6A clusterA, gene clusterA, and the high m6A score group (). The results of multivariate Cox regression analysis showed that m6A score was an independent prognostic factor for SKCM patients as well as age, T-stage, and M-stage (). Besides, there was a significant difference in the the m6A score between m6A clusters and gene clusters, with subcluster B of both m6A clusters and gene clusters possessing high m6A scores and subcluster C possessing low scores ( and ). We have learned that the OS of the B subcluster of both the m6A cluster and the gene cluster was better than the other two subclusters in the survival analysis. From this, it is clear that there is a close association between a high m6A score and a good prognosis of SKCM patients. To further understand the role played by m6A score in the immunotherapy of SKCM patients, we assessed the link between the m6A score and presence of immune cells. Indeed, there was a positive correlation between the m6A score and the content of mast cells, natural killer cells, regulatory T cells, and helper T cells, while there was a negative correlation with CD56 natural killer cells, monocytes, and neutrophils ().
Figure 6 Principal component analysis (PCA) to construct m6A scores. (A) Survival curves for high and low m6A scores in SKCM. (B) Sankey diagrams of gene clusters, m6A scores, and survival state distribution in different m6A subclusters. (C) Multivariate Cox regression analysis to identify prognostic independent indicators. (D and E) Differences in m6A scores between the three m6A patterns and the three gene subclusters. (D) m6Acluster; (E) gene cluster. (F) Correlation of m6A scores with immune cell infiltration in the immune microenvironment of SKCM. Red represents positive correlation, blue represents negative correlation, and the presence of *In the box indicates a correlation.
Correlation Analysis Between m6A Scores and Different Clinical Features
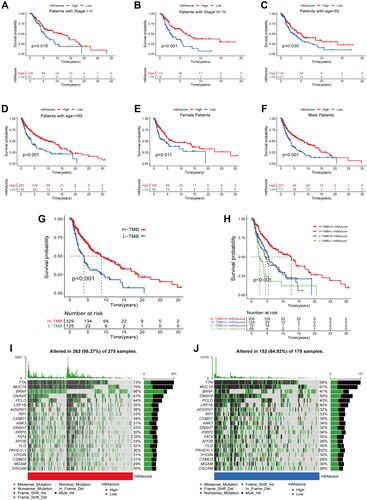
Here, expanded our investigations on the link between the m6A score and different patient characteristics (Age, Gender, Stage). We classified SKCM patients into different subgroups based on different clinical characteristics, including: stage I–II and stage III–IV patients; >65 and ≤65 years old patients; male and female patients. Subsequently, we further analyzed the differences in OS between m6A scores with different clinical characteristics, and we found that OS was better in patients with a high m6A score than that of the low m6A score group in different stage groups ( and ). The same results were found in the age and gender subgroups, with patients with high m6A scores having better survival than those with low m6A scores (–). This again suggests to us that the m6A regulator is relevant to the prognosis of SKCM patients and maybe a new biomarker for clinical treatment and prognostic assessment of SKCM patients. Besides, we divided SKCM patients as having a high or low TMB, according to the optimal cutoff and assessed the OS in these two groups. This analysis demonstrated that high-TMB patients had a longer survival when compared to that of patients with a low TMB (). Moreover, in the combined TMB and m6A score analysis, patients with a high TMB and high m6A score had a better OS rate (). This offers the possibility that m6A-related regulators are somehow linked to TMB and together influence the prognosis of SKCM patients. Furthermore, to better understand the TMB in patients stratified according to their m6A scores, a waterfall diagram was constructed. The top five genes with the highest mutation frequencies were TTN, MUC16, BRAF, DNAH5, and PCLO ( and ).
Figure 7 Correlation analysis between m6A scores and different clinical features. (A–F) Kaplan-Meier survival analysis curves between high and low m6A score groups in different clinical features. (A) Patients with stage I–II; (B) Patients with stage III–IV; (C) Patients with age >65; (D) Patients with age ≤65; (E) Female patients; (F) Male patients. (G) Kaplan-Meier survival curves for high and low TMB groups. (H) Kaplan-Meier curves for SKCM patients stratified by TMB and m6A scores. (I and J) Mutation burden in high and low m6A score groups. (I) High m6A score group; (J) low m6A score group.
The Predictive Role of the m6A Score for the Outcome of Immunotherapy
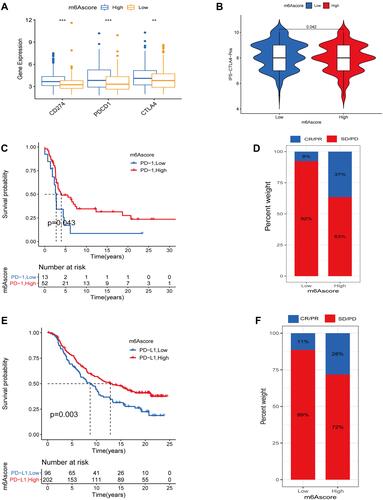
Immune checkpoint blocking (ICB) genes, known as immunotherapeutic agents, are now widely used in the immunotherapy of tumors.Citation36–Citation38 Cytotoxic T-lymphocyte antigen-4 (CTLA-4) and programmed cell death protein 1 (PD-1) are the two main practice pathways.Citation36,Citation39 However, not all patients benefit from this therapy, and patients with certain tumors can cause serious immune adverse events.Citation40 Before evaluating the predictive ability of the m6A score, we first analyzed the differences between ICB genes (PDCD1, CD274, CTLA4)Citation33 in the high and low m6A score groups. We observed that the above ICB genes were significantly increased in the m6A high scoring group (). Furthermore, we analyzed the differences in IPS among the high and low m6A scoring groups in the TCGA-SKCM cohort. There was a difference in the treatment effect among the high and low m6A scoring groups when treated with anti-CTLA4 alone (). The above results suggest that patients in the high m6A score group may be more appropriate for anti-PD-1/PD-L1 or anti-CTLA4 immunotherapy and receive a better treatment response. To conduct this, we collected two independent cohorts (GSE93157, IMvigor210) receiving anti-PD-1/PD-L1 therapy and classified them into high and low m6A score groups based on optimal cutoff. In the GSE93157 cohort, Kaplan-Meier survival analysis showed that patients with high m6A score had longer OS (). We also found that the objective response rate was higher in the high scoring group (37%) than in the low m6A scoring group (8%) (). The same results were further confirmed in the IMvigor210 cohort, where patients in the high m6A score group had a better OS than those in the low m6A group, and the objective response rate in the high m6A score group reached 28% compared with 11% in the m6A score group ( and ).
Figure 8 The role of m6A score in predicting immunotherapy efficacy. (A) Differences in ICB genes in high and low m6A score groups (***represents: P < 0.001; **represents P < 0.01). (B) IPS between high and low m6A score groups when CTLA-4 positive. (C) Survival analysis curves between high and low m6A score groups in the GSE93157 cohort receiving anti-PD-1 therapy. (D) Proportion of patients responding to anti-PD-1 therapy in the high and low m6A score groups in the GSE93157 cohort. In high m6Ascore group response/nonresponse:37%/63% and 8/92% in low m6A score group. (E) Survival analysis curves between high and low m6A score groups in the IMvigor210 cohort receiving anti-PD-L1 therapy. (F) Proportion of patients responding to anti-PD-L1 therapy in the high and low m6A score groups in the IMvigor210 cohort. In high m6Ascore group response/nonresponse:28%/72% and 11/89% in low m6Ascore group.
Discussion
SKCM is a common tumor worldwide with an increasing incidence, especially in Western countries. The prognosis of patients with malignant melanoma varies greatly between countries, but early detection and intervention can have an improved prognosis.Citation41 In this study, we used TCGA and GSE65904 cohort data to develop three different m6A modification patterns (m6A cluster A, m6A cluster B, and m6A cluster C) in SKCM, construct a quantitative scoring system, defined as the m6A score, and further evaluate the predictive efficacy of m6A score on immunotherapeutic response. Furthermore, significant differences in OS between the three m6A clusters also indicated that the levels of regulators of m6A had a strong prognostic effect for SKCM patients and were able to distinguish and categorize SKCM patients according to concordance.
m6A, which is the most frequent internal modification of mRNA, is extensively implicated in various pathological processes in cancer. m6A regulation can be categorized into three modalities: writers, erasers, and readers.Citation26 In bladder cancer (BLCA), increased expression levels of METTL3 (writer) upregulated the m6A levels of the CDCP1 gene, thus promoting BLCA value addition, migration, and invasion.Citation42,Citation43 In colorectal cancer (CRC), the ability of CRC cell tumorigenicity and colonosphere formation could be inhibited by suppressing YTHDF1 (reader) overexpression.Citation44 In breast cancer (BRCA), FTO (eraser) expression is increased. FTO can promote BRCA cell appreciation and metastasis by inhibiting BNIP3 methylation.Citation45 However, the mechanism of the role of m6A-related regulators in fever in SKCM is less reported.
SKCM is a tumor capable of producing an immune response (considered immunogenic),Citation46,Citation47 and a higher rate of mutations in genes can be observed in patients with primary versus malignant (metastatic) SKCM,Citation48 which is thought to be the immunogenic mechanism of SKCM pathogenesis. This gives a huge scope for the immunotherapy of SKCM. Here, GSVA, KEGG, and GO analysis revealed that DEGs between m6A subclusters are enriched for pathways related to immunity, such as the Rap1 signaling pathway. Moreover, additional evidence suggests that the Rap1 signaling pathway is a key pathway in the progression of malignant melanoma.Citation49 Similarly, ssGSEA analysis revealed significant differences in immune cell content between the three m6A subclusters (subcluster ABC). Monocytes, activated CD4 T cells, myeloid-derived suppressor and CD8 T cells were higher in subcluster C than in the other two subclusters (subcluster AB), while neutrophil content was lower in all three subclusters. This reaffirms the fact that: immunotherapy can indeed bring a breakthrough in the clinical outcome of melanoma patients and the novel therapies anti-CTLA4 were linked with a superior prognosis in patients with malignant melanoma in 2010.Citation50 Tumor mutation burden (TMB) is an emerging diagnostic and therapeutic marker and predicts PD-1/PD-L1 treatment response.Citation51 It was previously demonstrated that key mutations in YTHDF1 and HNRNPA2B1 lead to their amplification in melanoma, resulting in significant differences in both staging and prognosis of melanoma patients.Citation52 In our study, the top five m6A regulators with the highest mutation frequencies were YTHDF1 (3%), YTHDC2 (3%), LRPPRC (3%), ZC3H13 (3%), and YTHDC1 (3%). Moreover, in the analysis of copy number variation frequencies, the probability of adding copies to HTHDF1 was significantly greater than the probability of missing copies. This evidence suggests that m6A modifications are associated with the stabilization of the tumor microenvironment (TME) and the dramatic accumulation of mutations and have the potential to be prognostic markers in melanoma patients. However, given the individual heterogeneity of immune microenvironment and clinical treatment, we used PCA analysis to construct m6A score to quantitatively differentiate melanoma patients. Multivariate Cox regression analysis showed that the m6A score was an independent prognostic indicator. With the help of GSEA, we found that the m6A score positively correlated with activated natural killer cells, T lymphocytes, CD4 T cells, and helper T cells, which may explain the advantageous prognosis of high m6A score. Together with the GSEA results based on m6A scores, we suggest that m6A scores have a different biological role from TMBs that can guide immunotherapy and screen suitable candidates for immunotherapy.
In the assessment of the efficacy of m6A scoring for immunotherapy, we found significant changes in the levels of different ICB genes between the high and low m6A scoring groups. Patients with high m6A scores had higher expression of ICB genes, suggesting that possibly patients with high m6A scores are more suitable for immunotherapy. Besides, after evaluating immunotherapy in SKCM patients, we found statistically significant differences in immunotherapy efficacy between patients in the high and low m6A score groups when ipilimumab (anti-CTLA4) alone was used. Similarly, two immune-related samples receiving anti-PD-1/PD-L1 therapy, the GSE93157 and IMvigor210 cohorts, further validated that patient in the high m6A score group had a better prognosis and a higher rate of response to immunotherapy. This again suggests that only some SKCM patients will benefit from immunotherapy. A previous study has demonstrated that patients with malignant melanoma had an objective remission rate (ORR) of only 33% for pembrolizumab and 12% for ipilimumab.Citation53 However, this study has limitations. First, the study was a retrospective study design based on publicly available databases; therefore, additional prospective study designs are needed to confirm our findings. Second, there is a lack of in vivo or in vitro experiments to confirm the specific regulatory mechanisms between m6A regulators and SKCM. In conclusion, after systematic bioinformatics analysis and validation, the m6A score can predict immunotherapy outcomes in SKCM patients and can screen for appropriate immunotherapy candidates. As far as we know, this is the first report of constructing a quantitative index of m6A score in SKCM to predict the effect of immunotherapy. This study provides new ideas for clinicians to develop personalized immunotherapy regimens for SKCM patients.
Conclusions
In summary, we systematically and comprehensively analyzed the landscape of m6A in SKCM, providing new ideas and insights for prognostic assessment and immunotherapeutic response in SKCM. Differences in m6A scores were found to be associated with heterogeneity and therapeutic complexity of melanoma. Moreover, it can help to identify suitable candidates for immunotherapy and thus provide personalized treatment plans for SKCM patients. Therefore, this study has important clinical implications for the systematic study of m6A modification patterns in SKCM.
Abbreviations
SKCM, skin cutaneous melanoma; m6A, N6-methyladenosine; TCGA, the cancer genome atlas; ssGSEA, single-sample gene set enrichment analysis; GSVA, gene set variation analysis; DEGs, differentially expressed genes; PCA, principal component analysis; ICB, immune checkpoint blocking; IPS, immunophenotype score.
Data Sharing Statement
The datasets used and analyzed during the current study are available from the corresponding author on reasonable request.
Author Contributions
All authors made a significant contribution to the work reported, whether that is in the conception, study design, execution, acquisition of data, analysis and interpretation, or in all these areas; took part in drafting, revising or critically reviewing the article; gave final approval of the version to be published; have agreed on the journal to which the article has been submitted; and agree to be accountable for all aspects of the work.
Acknowledgments
We need to thank the “Medical Excellence Award” Funded by the Creative Research Development Grant from the First Affiliated Hospital of Guangxi Medical University for its help with this research.
Disclosure
The authors report no conflicts of interest in this work.
Additional information
Funding
References
- Bray F, Ferlay J, Soerjomataram I, et al. Global cancer statistics 2018: GLOBOCAN estimates of incidence and mortality worldwide for 36 cancers in 185 countries. CA Cancer J Clin. 2018;68(6):394–424. doi:10.3322/caac.21492
- Ferlay J, Shin HR, Bray F, et al. Estimates of worldwide burden of cancer in 2008: GLOBOCAN 2008. Int J Cancer. 2010;127(12):2893–2917. doi:10.1002/ijc.25516
- Ekwueme DU, Guy GP, Li C, et al. The health burden and economic costs of cutaneous melanoma mortality by race/ethnicity-United States, 2000 to 2006. J Am Acad Dermatol. 2011;65(5 Suppl 1):S133–S143. doi:10.1016/j.jaad.2011.04.036
- Bulliard JL, Cox B, Elwood JM. Latitude gradients in melanoma incidence and mortality in the non-Maori population of New Zealand. Cancer Causes Control. 1994;5(3):234–240. doi:10.1007/BF01830242
- Garibyan L, Fisher DE. How sunlight causes melanoma. Curr Oncol Rep. 2010;12(5):319–326. doi:10.1007/s11912-010-0119-y
- Gilchrest BA, Eller MS, Geller AC, Yaar M, Epstein FH. The pathogenesis of melanoma induced by ultraviolet radiation. N Engl J Med. 1999;340(17):1341–1348. doi:10.1056/NEJM199904293401707
- Pennello G, Devesa S, Gail M. Association of surface ultraviolet B radiation levels with melanoma and nonmelanoma skin cancer in United States blacks. Cancer Epidemiol Biomarkers Prev. 2000;9(3):291–297.
- Lea CS, Scotto JA, Buffler PA, et al. Ambient UVB and melanoma risk in the United States: a case-control analysis. Ann Epidemiol. 2007;17(6):447–453. doi:10.1016/j.annepidem.2007.01.030
- Gorayski P, Burmeister B, Foote M. Radiotherapy for cutaneous melanoma: current and future applications. Future Oncol. 2015;11(3):525–534. doi:10.2217/fon.14.300
- Eggermont AM, Spatz A, Robert C. Cutaneous melanoma. Lancet. 2014;383(9919):816–827. doi:10.1016/S0140-6736(13)60802-8
- Steininger J, Gellrich FF, Schulz A, et al. Systemic therapy of metastatic melanoma: on the road to cure. Cancers (Basel). 2021;13(6):1430. doi:10.3390/cancers13061430
- Pavri SN, Clune J, Ariyan S, Narayan D. Malignant melanoma: beyond the basics. Plast Reconstr Surg. 2016;138(2):330e–340e. doi:10.1097/PRS.0000000000002367
- Zhao BS, Roundtree IA, He C. Post-transcriptional gene regulation by mRNA modifications. Nat Rev Mol Cell Biol. 2017;18(1):31–42. doi:10.1038/nrm.2016.132
- Alarcón CR, Lee H, Goodarzi H, Halberg N, Tavazoie SF. N6-methyladenosine marks primary microRNAs for processing. Nature. 2015;519(7544):482–485. doi:10.1038/nature14281
- Chen XY, Zhang J, Zhu JS. The role of m(6)A RNA methylation in human cancer. Mol Cancer. 2019;18(1):103. doi:10.1186/s12943-019-1033-z
- Meyer KD, Jaffrey SR. Rethinking m(6)A readers, writers, and erasers. Annu Rev Cell Dev Biol. 2017;33:319–342. doi:10.1146/annurev-cellbio-100616-060758
- Huang H, Weng H, Chen J. m(6)A modification in coding and non-coding RNAs: roles and therapeutic implications in cancer. Cancer Cell. 2020;37(3):270–288. doi:10.1016/j.ccell.2020.02.004
- Frye M, Harada BT, Behm M, He C. RNA modifications modulate gene expression during development. Science. 2018;361(6409):1346–1349. doi:10.1126/science.aau1646
- Roundtree IA, Evans ME, Pan T, He C. Dynamic RNA modifications in gene expression regulation. Cell. 2017;169(7):1187–1200. doi:10.1016/j.cell.2017.05.045
- Huang H, Weng H, Chen J. The biogenesis and precise control of RNA m(6)A methylation. Trends Genet. 2020;36(1):44–52. doi:10.1016/j.tig.2019.10.011
- Wang Y, Li Y, Toth JI, et al. N6-methyladenosine modification destabilizes developmental regulators in embryonic stem cells. Nat Cell Biol. 2014;16(2):191–198. doi:10.1038/ncb2902
- Huang H, Weng H, Deng X, Chen JJ. RNA modifications in cancer: functions, mechanisms, and therapeutic implications. Ann Rev Cancer Biol. 2020;4:221–240.
- Yang S, Wei J, Cui YH, et al. m(6)A mRNA demethylase FTO regulates melanoma tumorigenicity and response to anti-PD-1 blockade. Nat Commun. 2019;10(1):2782. doi:10.1038/s41467-019-10669-0
- Shi Y, Fan S, Wu M, et al. YTHDF1 links hypoxia adaptation and non-small cell lung cancer progression. Nat Commun. 2019;10(1):4892. doi:10.1038/s41467-019-12801-6
- Weinstein JN, Collisson EA, Mills GB, et al. The cancer genome atlas pan-cancer analysis project. Nat Genet. 2013;45(10):1113–1120. doi:10.1038/ng.2764
- He L, Li H, Wu A, et al. Functions of N6-methyladenosine and its role in cancer. Mol Cancer. 2019;18(1):176. doi:10.1186/s12943-019-1109-9
- Wagner GP, Kin K, Lynch VJ. Measurement of mRNA abundance using RNA-seq data: RPKM measure is inconsistent among samples. Theory Biosci. 2012;131(4):281–285. doi:10.1007/s12064-012-0162-3
- Wilkerson MD, Hayes DN. ConsensusClusterPlus: a class discovery tool with confidence assessments and item tracking. Bioinformatics. 2010;26(12):1572–1573. doi:10.1093/bioinformatics/btq170
- Hänzelmann S, Castelo R, Guinney J. GSVA: gene set variation analysis for microarray and RNA-seq data. BMC Bioinform. 2013;14:7. doi:10.1186/1471-2105-14-7
- Ashburner M, Ball CA, Blake JA, et al. Gene ontology: tool for the unification of biology. The Gene Ontology Consortium. Nat Genet. 2000;25(1):25–29. doi:10.1038/75556
- Kanehisa M, Goto S. KEGG: kyoto encyclopedia of genes and genomes. Nucleic Acids Res. 2000;28(1):27–30. doi:10.1093/nar/28.1.27
- Mayakonda A, Lin DC, Assenov Y, Plass C, Koeffler HP. Maftools: efficient and comprehensive analysis of somatic variants in cancer. Genome Res. 2018;28(11):1747–1756. doi:10.1101/gr.239244.118
- Hugo W, Zaretsky JM, Sun L, et al. Genomic and transcriptomic features of response to anti-PD-1 therapy in metastatic melanoma. Cell. 2016;165(1):35–44. doi:10.1016/j.cell.2016.02.065
- Ayers M, Lunceford J, Nebozhyn M, et al. IFN-γ-related mRNA profile predicts clinical response to PD-1 blockade. J Clin Invest. 2017;127(8):2930–2940. doi:10.1172/JCI91190
- Mariathasan S, Turley SJ, Nickles D, et al. TGFβ attenuates tumour response to PD-L1 blockade by contributing to exclusion of T cells. Nature. 2018;554(7693):544–548. doi:10.1038/nature25501
- Zam W, Ali L. Immune checkpoint inhibitors in the treatment of cancer. Curr Clin Pharmacol. 2021. doi:10.2174/1574884716666210325095022
- Duraiswamy J, Kaluza KM, Freeman GJ, Coukos G. Dual blockade of PD-1 and CTLA-4 combined with tumor vaccine effectively restores T-cell rejection function in tumors. Cancer Res. 2013;73(12):3591–3603. doi:10.1158/0008-5472.CAN-12-4100
- Schreiber RD, Old LJ, Smyth MJ. Cancer immunoediting: integrating immunity’s roles in cancer suppression and promotion. Science. 2011;331(6024):1565–1570. doi:10.1126/science.1203486
- Wolchok JD, Kluger H, Callahan MK, et al. Nivolumab plus ipilimumab in advanced melanoma. N Engl J Med. 2013;369(2):122–133. doi:10.1056/NEJMoa1302369
- Matull J, Livingstone E, Wetter A, et al. Durable complete response in a melanoma patient with unknown primary, associated with sequential and severe multi-organ toxicity after a single dose of CTLA-4 plus PD-1 blockade: a case report. Front Oncol. 2020;10:592609. doi:10.3389/fonc.2020.592609
- Schadendorf D, Fisher DE, Garbe C, et al. Melanoma. Nat Rev Dis Primers. 2015;1:15003.
- Yang F, Jin H, Que B, et al. Dynamic m(6)A mRNA methylation reveals the role of METTL3-m(6) A-CDCP1signaling axis in chemical carcinogenesis. Oncogene. 2019;38(24):4755–4772. doi:10.1038/s41388-019-0755-0
- Han J, Wang JZ, Yang X, et al. METTL3 promote tumor proliferation of bladder cancer by accelerating pri-miR221/222 maturation in m6A-dependent manner. Mol Cancer. 2019;18(1):110. doi:10.1186/s12943-019-1036-9
- Bai Y, Yang C, Wu R, et al. YTHDF1 regulates tumorigenicity and cancer stem cell-like activity in human colorectal carcinoma. Front Oncol. 2019;9:332. doi:10.3389/fonc.2019.00332
- Niu Y, Lin Z, Wan A, et al. RNA N6-methyladenosine demethylase FTO promotes breast tumor progression through inhibiting BNIP3. Mol Cancer. 2019;18(1):46. doi:10.1186/s12943-019-1004-4
- Kirkwood JM, Butterfield LH, Tarhini AA, et al. Immunotherapy of cancer in 2012. CA Cancer J Clin. 2012;62(5):309–335.
- Kirkwood JM, Tarhini AA, Panelli MC, et al. Next generation of immunotherapy for melanoma. J Clin Oncol. 2008;26(20):3445–3455. doi:10.1200/JCO.2007.14.6423
- Mocellin S, Rossi CR, Nitti D, Lise M, Marincola FM. Dissecting tumor responsiveness to immunotherapy: the experience of peptide-based melanoma vaccines. Biochim Biophys Acta. 2003;1653(2):61–71.
- Zhou S, Liang Y, Zhang X, et al. SHARPIN promotes melanoma progression via Rap1 signaling pathway. J Invest Dermatol. 2020;140(2):395–403.e396. doi:10.1016/j.jid.2019.07.696
- Hodi FS, O’Day SJ, McDermott DF, et al. Improved survival with ipilimumab in patients with metastatic melanoma. N Engl J Med. 2010;363(8):711–723. doi:10.1056/NEJMoa1003466
- Allgäuer M, Budczies J, Christopoulos P, et al. Implementing tumor mutational burden (TMB) analysis in routine diagnostics-a primer for molecular pathologists and clinicians. Transl Lung Cancer Res. 2018;7(6):703–715. doi:10.21037/tlcr.2018.08.14
- Li T, Gu M, Deng A, Qian C. Increased expression of YTHDF1 and HNRNPA2B1 as potent biomarkers for melanoma: a systematic analysis. Cancer Cell Int. 2020;20:239. doi:10.1186/s12935-020-01309-5
- Robert C, Schachter J, Long GV, et al. Pembrolizumab versus ipilimumab in advanced melanoma. N Engl J Med. 2015;372(26):2521–2532. doi:10.1056/NEJMoa1503093