
Abstract
Background
Obstructive sleep apnea (OSA) is associated with an increased risk of lung cancer. This study aimed to identify key common genes in OSA and lung cancer and explore their prognostic value in lung cancer.
Materials and Methods
Transcriptome data of OSA and lung cancer were obtained from the Gene Expression Omnibus (GEO) and The Cancer Genome Atlas (TCGA) database, respectively. Genes associated with OSA and lung cancer were screened by weighted gene co-expression network analysis (WGCNA). Univariate and multivariate Cox regression algorithms were applied to identify key genes and construct the risk score model. Receiver operating characteristic (ROC) curves and a nomogram were performed to evaluate the prognostic value of the risk score. The screened key genes and their roles in prognosis were validated by GEO (GSE30219) analysis.
Results
A total of 104 common genes were screened in OSA and lung cancer by WGCNA. Modulator of apoptosis 1 (MOAP1), chromobox 7 (CBX7), platelet-derived growth factor subunit B (PDGFB), and mitogen-activated protein kinase 3 (MAP2K3) were identified as key genes by univariate and then multivariate Cox regression analyses. The risk score model was constructed on the basis of four gene signatures. ROC curves and the nomogram showed that the risk score had a high accuracy in predicting the survival of patients with lung cancer. In addition, the result of multivariate Cox regression analysis indicated that the risk score was an independent prognostic factor in lung cancer.
Conclusion
This study constructed a unique model for predicting the prognosis of lung cancer patients on the basis of four genes common to OSA and lung cancer. These genes may also serve as candidate genes to improve our knowledge about the underlying mechanism of OSA that leads to an increased risk of lung cancer at the genetic level.
Introduction
Lung cancer ranks first among the common cancer types of the world in men and second in women.Citation1 According to statistical data from the American Cancer Society, the numbers of new lung cancer cases and lung cancer deaths have been decreasing, but deaths caused by lung cancer remain more common than deaths caused by breast, prostate, colorectal, and brain cancers combined.Citation1 Lung cancer is a heterogeneous disease influenced by constitutional genetic or epigenetic susceptibilities and affected by various environmental factors.Citation2 Despite advances in knowledge made about lung cancer–associated risk factors, tumorigenesis, immune evasion, development, angiogenesis, metastasis, chemoresistance, and treatment strategies, the disease still brings a huge economic and medical care burden to the world.Citation3 In recent years, obstructive sleep apnea (OSA), as a result of rapid economic development and changes in lifestyle, has become more prevalent in numerous countries.Citation4 OSA is a complex, multifactorial disease affecting millions of people worldwide, and it may complicate cerebrovascular, cardiovascular, and metabolic diseases.Citation5 The key clinical characteristic of OSA is repeated collapse of the upper airway during sleep accompanied with sleep fragments (SFs) and daytime sleepiness, leading to chronic intermittent hypoxia (IH).Citation6 The symptoms of and treatments for OSA vary according to severity. Therefore, early diagnosis and management of OSA are critical for promoting treatments and preventing complications.
Epidemiological investigations have indicated that IH caused by OSA is involved in activating a variety of carcinogenic pathways and contributes to tumorigenesis and the development of cancer.Citation7 According to numerous studies, OSA is associated with increased morbidity and mortality in lung cancer and accelerates the progression of lung cancer.Citation8,Citation9 Torres et alCitation10 reported that, in female mice, OSA as an independent contributor promoted the aggressiveness of lung cancer through alterations of the host immune response. As a result, the relationship between lung cancer and OSA is increasingly attracting the attention of scholars. Although lung cancer and OSA belong to two different systems, studies have suggested that these two diseases interact with each other and share some identical pathological mechanisms.
However, few studies are focused on the shared genes and common pathogeneses of lung cancer and OSA. It is necessary to screen for genes shared by these two diseases using bioinformatics methods at genetic and molecular levels. In this study, we aimed to identify shared genes between OSA and lung cancer by using weighted gene co-expression network analysis (WGCNA). WGCNA is an advanced method that describes the molecular mechanism and reconstructing co-expression networks of genes using an integrative method.Citation11,Citation12 We also explored the prognostic value of these screened genes for lung cancer to potentially identify new diagnostic biomarkers or therapeutic targets of lung cancer.
Materials and Methods
Data Source
RNA sequencing (RNA-seq) data of 34 OSA and eight control samples were downloaded from the GSE135917 dataset. Gene expression profile and clinical data of 1006 lung cancer samples and 107 normal samples were downloaded from The Cancer Genome Atlas (TCGA) (https://www.cancer.gov/about-nci/organization/ccg/research/structural-genomics/tcga) database and used as training set. GSE30219, including RNA-seq data and clinical information of 293 lung cancer samples and 14 normal samples, was downloaded from the Gene Expression Omnibus (GEO) (https://www.ncbi.nlm.nih.gov/geo) database and used as validation set.
WGCNA Analysis
Sample clustering tree maps were constructed to detect and eliminate outliers in the GSE135917 and TCGA lung cancer datasets, respectively. Then, the pick soft threshold function of WGCNA was used to calculate β from 1 to 30 to select the best soft threshold. According to the selected soft threshold, the adjacency matrix was converted to a topological overlap matrix for constructing the network, and the gene dendrogram and module color were established by using the degree of dissimilarity. We divided the initial module again through dynamic tree cutting and merged similar modules. The Pearson correlation coefficient between the module eigengenes and sample traits was calculated to identify the significantly relevant modules associated with OSA and lung cancer. In addition, module preservation analysis was performed to calculate the Z summary score. A Z summary score > 10 indicates strong evidence of module preservation, whereas a Z summary score < 2 or a score between 2 and < 10 indicates no evidence or weak evidence, respectively, of module preservation.
Biological Function Analysis
Gene Ontology (GO) and Kyoto Encyclopedia of Genes and Genomes (KEGG) pathway enrichment of common genes in OSA and lung cancer was analyzed by Cluster Profiler R package.Citation13 Additionally, Gene Set Enrichment Analysis (GSEA) was performed to investigate the molecular mechanisms of prognostic gene signatures. GO and KEGG gene sets were downloaded from the MSigDB database (http://software.broadinstitute.org/gsea/msigdb/index.jsp).
Construction and Validation of the Risk Score Model
Univariate Cox regression analysis was conducted to screen genes significantly related to the survival (P value < 0.05). Furthermore, multivariate Cox regression analysis was conducted and identified four signature genes. Then, the risk score was calculated using the following formula:
(ExpGene1×Coef1) + (ExpGene2×Coef2) + (ExpGene3×Coef3) + (ExpGene4×Coef4)
in which Coef represents the regression coefficients of genes and Exp is the normalized expression values of each signature gene. According to the median value of the risk score, patients with lung cancer were divided into high-risk and low-risk groups. The overall survival of high-risk and low-risk groups was analyzed by Kaplan–Meier analysis. To evaluate the accuracy of the risk score model, the receiver operating characteristics (ROC) curve was plotted using “survival ROC” in R package. Univariate and multivariate analyses were then performed to determine whether the risk score was an independent prognostic factor. A nomogram was constructed for clinical use. The performance of the nomogram was assessed by calibration curves.
Statistical Analysis
All data were analyzed by R (version 4.0.0, https://www.r-project.org/). The Wilcoxon test was used to compare the expressions of four prognostic gene signatures between lung cancer and normal samples. A P value less than 0.05 was considered statistically significant.
Results
Identification of Common Genes in OSA and Lung Cancer by WGCNA
According to the sample clustering results, one outlier sample in GSE135917 in TCGA were detected and eliminated (), and then the sample dendrogram and trait heatmaps were built (). 16 outlier samples in TCGA were detected and eliminated (), and then the sample dendrogram and trait heatmaps were built (). Using the pick soft threshold function of WGCNA, we found that the optimal soft threshold power was 18 for GSE135917 samples () and 5 for TCGA samples (); in both sample sets, the R2 was approximately 0.9. Sixteen modules were finally identified in GSE135917 (), and 35 modules were identified in TCGA () from the co-expression network after merging of similar modules. After calculating the correlations between modules and OSA or lung cancer, we plotted the corresponding heatmaps of module-trait relationships ( and ). Furthermore, we performed the module preservation to calculate the Z summary scores of each module in and ( and ).
Figure 1 WGCNA of the OSA dataset (GSE135917). (A) The sample clustering results. (B) The sample dendrogram and trait heatmaps. (C) A soft threshold of 18 was the most suitable value to OSA. (D) Sixteen modules were related to OSA. (E) The corresponding heatmaps of module-trait relationships. (F) The Zsummary scores of 16 modules calculated by module preservation.
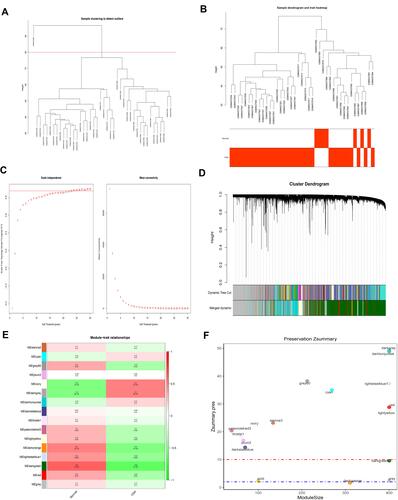
Figure 2 WGCNA of lung cancer dataset in The Cancer Genome Atlas (TCGA). (A) The sample clustering results. (B) The sample dendrogram and trait heatmaps. (C) A soft threshold of five was the most suitable value to lung cancer. (D) Thirty-five modules were related to lung cancer. (E) The corresponding heatmaps of module-trait relationships. (F) The Zsummary scores of 35 modules calculated by module preservation.
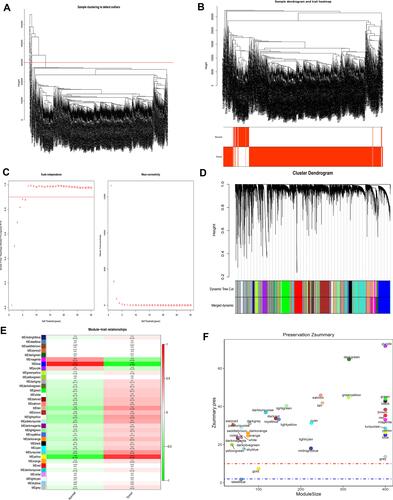
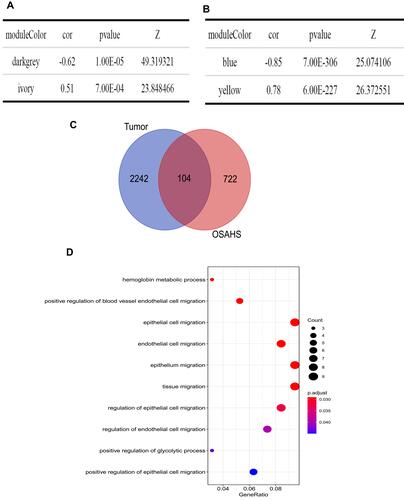
Then, key modules were screened with the following criteria: |cor| > 0.5, P < 0.05, and Z summary score > 10. Dark gray and ivory modules, associated with OSA (), and blue and yellow modules, associated with lung cancer (), were identified as key modules. To obtain common genes in OSA and lung cancer, we overlapped the genes in key modules of OSA and lung cancer and obtained 104 genes common to OSA and lung cancer ().
Figure 3 Screening for key modules and common genes. (A) Dark gray and ivory modules were screened in OSA and (B) blue and yellow modules were screened in lung cancer. (C) A total of 104 overlapped common genes in key modules of OSA and lung cancer were screened. (D) Gene Ontology analysis of 104 common genes in OSA and lung cancer.
Biological Function Analysis of Common Genes in OSA and Lung Cancer
We also conducted GO and KEGG pathway enrichment analyses to investigate the biological functions of the 104 common genes. No KEGG pathway was significantly enriched. A total of 10 GO terms were significantly enriched: hemoglobin metabolic process, positive regulation of blood vessel endothelial cell migration, epithelial cell migration, endothelial cell migration, epithelium migration, tissue migration, regulation of epithelial cell migration, regulation of endothelial cell migration, positive regulation of glycolytic process, and positive regulation of epithelial cell migration ( and ).
Table 1 Functional Enrichment Analysis and the Identified 10 Enriched Pathways
Identification of Key Genes Associated with Prognosis of Lung Cancer
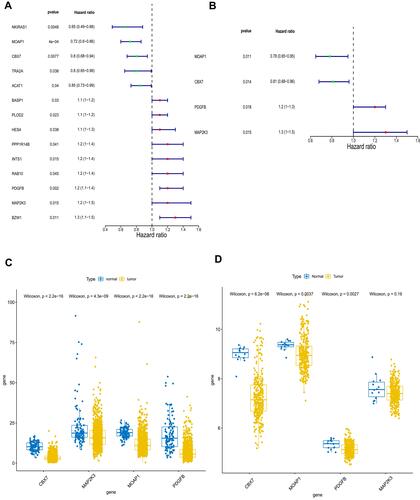
We also investigated the prognostic value of 104 common genes in lung cancer by univariate Cox regression algorithm analysis. A total of 14 genes were significantly associated with prognosis (P < 0.05), among which nuclear factor kappa B inhibitor interacting Ras like 1 (NKIRAS1), MOAP1, CBX7, transformer 2 alpha homolog (TRA2A), and acetyl-CoA acetyltransferase 1 (ACAT1) played a protective role (hazard ratio [HR] < 1), and the remaining nine genes were risk factors (HR > 1, ). To obtain more robust signature genes, these 14 genes were then selected for multivariate Cox regression algorithm analysis. MOAP1, CBX7, PDGFB, and MAP2K3 were identified as key prognostic genes (). The expressions of MOAP1, CBX7, PDGFB, and MAP2K3 were significantly higher in normal samples compared with lung cancer samples in TCGA (). Their expressions were also validated in GSE30219. Consistent with the results in TCGA, the expressions of MOAP1, CBX7, PDGFB, and MAP2K3 were downregulated in GSE30219 lung cancer samples ().
Figure 4 Identification of key genes associated with prognosis of lung cancer. (A) Fourteen genes and (B) four genes were related to prognosis by univariate Cox regression algorithm analysis and multivariate Cox regression algorithm analysis, respectively. The expressions of MOAP1, CBX7, PDGFB, and MAP2K3 were downregulated in both The Cancer Genome Atlas (TCGA) dataset (C) and the GSE30219 lung cancer samples (D). P values less than 0.05 are considered significant.
Construction and Validation of the Risk Score Model by Prognostic Gene Signatures
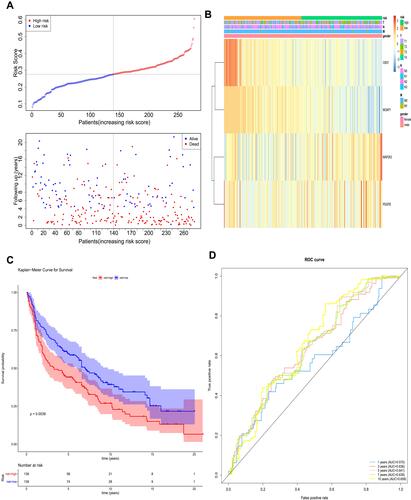
According to the coefficients of MOAP1, CBX7, PDGFB, and MAP2K3 in , we calculated the risk scores of each patient. On the basis of the median of the risk scores, the patients in TCGA training set were divided into high- and low-risk groups (). The expressions of MOAP1, CBX7, PDGFB, and MAP2K3 in high- and low-risk groups were displayed in a heatmap (). A significant survival difference (P < 0.0001) was found between high- and low-risk groups (). Moreover, we plotted ROC curves to study the predictive efficiency of the risk score model. The results showed that the risk score model had high accuracy in predicting the survival of patients with lung cancer when areas under the curves (AUC) equaled 0.707 for 1-, 3-, 5-, 7-, and 10-year timepoints (). The same results were obtained in the GSE30219 validation set (–).
Table 2 The Coefficients of 4 Key Prognostic Genes
Figure 5 The prognostic assessment of the signature in The Cancer Genome Atlas (TCGA) dataset. (A) Survival status and survival duration of patients and heatmap of the four key prognostic genes expression in patients with lung cancer. (B) The risk score distribution of patients with lung cancer in TCGA dataset. (C) The Kaplan–Meier curve of the overall survival between the high-risk and low-risk groups stratified by the median risk score in TCGA dataset. (D) ROC analysis of the predictive efficiency of the four-gene prognostic model on overall survival based on risk score.
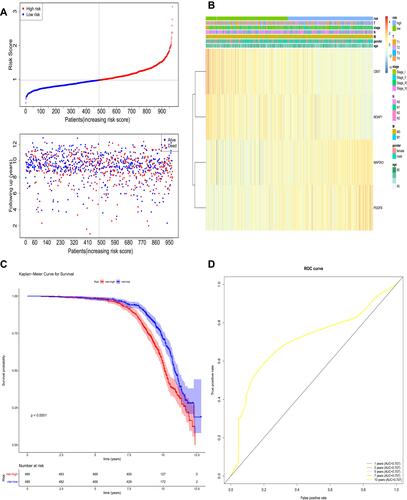
Figure 6 The prognostic assessment of the signature in the GSE30219 dataset. (A) Survival status and survival duration of patients and heatmap of the four key prognostic genes expression in patients with lung cancer. (B) The risk score distribution of patients with lung cancer in the GSE30219 dataset. (C) The Kaplan–Meier curve of the overall survival between the high-risk and low-risk groups stratified by the median risk score in the GSE30219 dataset. (D) ROC analysis of the predictive efficiency of the four-gene prognostic model on overall survival based on risk score.
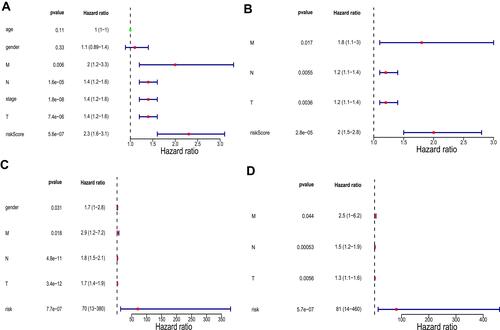
Next, we performed univariate and multivariate analyses in TCGA training set to determine whether the risk score was an independent prognostic factor. Univariate analysis showed that M stage, N stage, T stage, pathologic stage, and risk score were significantly correlated with prognosis (). Multivariate analysis using these correlated factors indicated that risk score remained remarkably associated with prognosis (). Similar results were obtained in the GSE30219 validation set ( and ).
Figure 7 Univariate and multivariate analyses in The Cancer Genome Atlas (TCGA) training set and the GSE30219 validation set. (A) Univariate analysis in TCGA training set. (B) Multivariate analysis in TCGA training set. (C) Univariate analysis in the GSE30219 validation set. (D) Multivariate analysis in the GSE30219 validation set. P values less than 0.05 are considered significant.
Construction and Analysis of the Nomogram
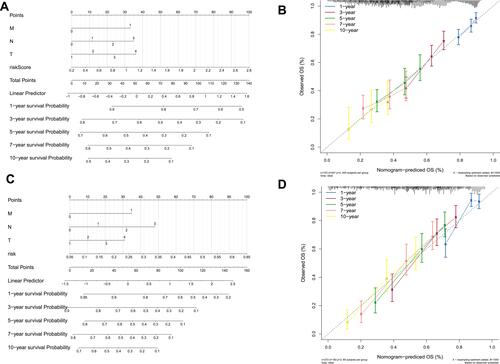
We used the factors significantly associated with prognosis in multivariate analysis (M stage, N stage, T stage, and risk score) to construct a nomogram in TCGA training set () with a C-index of 0.627. The calibration curves for the 1-, 3-, 5-, 7-, and 10-year timepoints showed that the predicted overall survival was very close to the actual observed overall survival (), indicating the clinical value of the nomogram. The nomogram was constructed using the risk score and other factors (), and its clinical use () was confirmed in the GSE30219 validation set.
Figure 8 Validation of the nomogram in predicting overall survival of lung cancer in The Cancer Genome Atlas (TCGA) training set and the GSE30219 validation set. (A and C) A nomogram to predict survival probability at the 1-, 3-, 5-, 7-, and 10-year timepoints for patients with lung cancer on the basis of results derived from TCGA training and GSE30219 validation sets. (B and D) Calibration curve for the nomogram when predicting the 1-, 3-, 5-, 7-, and 10-year overall survival in TCGA training and GSE30219 validation sets.
Exploration of the Molecular Mechanisms of Prognostic Gene Signatures by GSEA
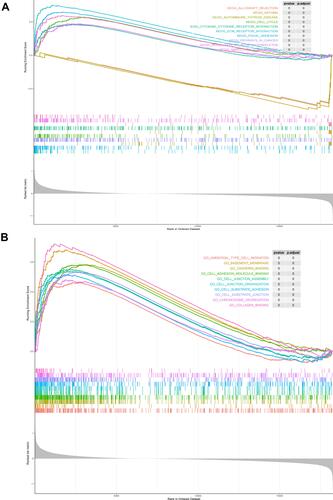
To elucidate the molecular mechanisms of these prognostic gene signatures, we performed GSEA. Results showed that the differentially expressed genes between the high- and low-risk groups based on the risk score model of MOAP1, CBX7, PDGFB, and MAP2K3 were enriched in various biological processes. The top 10 KEGG pathways were the extracellular matrix receptor interaction, focal adhesion, autoimmune thyroid disease, pathways in cancer, cell cycle, asthma, cytokine-cytokine receptor interaction, allograft rejection, regulation of actin cytoskeleton, and small cell lung cancer (). The top 10 GO terms were ameboidal-type cell migration, basement membrane (BM), cadherin binding, cell adhesion molecule binding, cell junction assembly, cell junction organization, cell substrate adhesion, cell substrate junction, chromosome segregation, and collagen binding ().
Figure 9 Gene set enrichment analysis between the high- and low-risk groups. (A) The top 10 Kyoto Encyclopedia of Genes and Genomes (KEGG) pathways. (B) The top 10 Gene Ontology (GO) terms.
Discussion
Lung cancer is the leading cause of tumor-related mortality in the world. Every year, 1.8 million and 1.6 million people are diagnosed with and die of lung cancer, respectively.Citation14 Although awareness of lung cancer is increasing, the pathogenesis of lung cancer remains complicated. As previously described, OSA is a prevalent disease characterized by IH.Citation4 In clinical studies, sleep apnea and nocturnal hypoxemia were very common in patients with lung cancer,Citation8 and the severity of OSA is significantly related to an increased risk of death in lung cancer.Citation15 Much evidence has shown that lung cancer is closely associated with OSA. However, the shared genes and the common pathogenesis of these two diseases are unclear and worthy of more study.
In this study, WGCNA was used to explore shared genes and common mechanisms of lung cancer and OSA. WGCNA has been used to investigate the co-expression module between two diseases in many studies; examples include an exploration of the shared pathogenesis of Alzheimer’s disease and type 2 diabetes mellitus and an analysis of shared gene signatures and candidate molecular mechanisms of pemphigus and systemic lupus erythematosus.Citation16,Citation17 Through bioinformatic analysis, a total of 104 genes were identified as shared by OSA and lung cancer. Additional functional enrichment analysis showed that positive regulation of blood vessel endothelial cell migration plays an important role in both OSA and lung cancer. A review of many studies have indicated that impairment and dysfunction of circulating endothelial cells are involved in the pathophysiological mechanism of OSA.Citation18 In a study of patients with OSA, impairment of human coronary endothelial cell migration was found in severe OSA, which suggests that regulation of blood vessel endothelial cell migration may be involved in OSA.Citation19 Moreover, other studies have shown that the migration of blood vessel endothelial cells plays an important role in lung cancer.Citation20 An investigation on long noncoding RNA (lncRNA) in NSCLC showed that lncRNA LINC00173.v1 promoted proliferation and migration of vascular endothelial cells, which contributed to tumorigenesis of lung squamous cell carcinoma.Citation20 A study focused on metastasis of lung cancer described claudin-5 modification of brain microvascular endothelial cell proliferation, migration, and adhesion to regulate blood-brain barrier permeability, which inhibited metastasis of lung cancer.Citation21 The 104 common genes identified in this study may affect OSA and lung cancer through mechanisms related to endothelial and epithelial cell migration.
In this study, univariate and multivariate Cox regression algorithm analyses identified key shared genes. MOAP1, CBX7, PDGFB, and MAP2K3 were identified from these 104 genes. MOAP1 is a BH3-like protein that plays a critical role in both the intrinsic and extrinsic modes of cell death or apoptosis.Citation22 A study showed that it could act as a tumor suppressor molecule by promoting the apoptosis of tumor cells.Citation23 In lung cancer, inhibiting the expression of MOAP1 by microRNA-25 enhanced the proliferation of non-small cell lung cancer (NSCLC) and suppressed apoptosis of NSCLC cells,Citation24 which was consistent with the protective role of MOAP1 found in our study. CBX7 belongs to the polycomb group (PCG) family, which participates in the formation of PCG complex 1 to perform biological functions. The inhibitory effect of CBX7 in lung cancer has been demonstrated in some studies.Citation25,Citation26 Cacciola et alCitation27 and Pallante et alCitation28 reported that the lack of CBX7 expression in lung cancer tissues was intensively associated with high-grade malignant phenotypes and poor prognosis. Peng et alCitation29 found that inhibiting CBX7 expression by microRNA-19 enhanced the proliferation of lung cancer cells. These studies were also in accordance with the protective role of CBX7 found in our study. PDGFB plays a vital part in recruiting platelet-derived growth factor (PDGF) receptor β–positive pericytes into blood vessels.Citation30 One study has shown that the formation of blood vessels and the progression and metastasis of lung cancer were positively associated with PDGFB.Citation31 A study on the biological significance of endothelial cell–derived PDGFB on lung cancer cells found that an increased migration trend of A549 NSCLC cells was related to the use of vascular endothelial growth factor (VEGF)-stimulated (PDGFB-rich) conditioned medium.Citation32 Furthermore, numerous researchers have determined that the expression of PDGFB was strongly associated with lymph node metastasis and tumor size, and it was a strong and independent prognostic factor in NSCLC.Citation33,Citation34 Together, this research is consistent with our analysis.
A study of MAP2K3 in lung cancer found that abnormal methylation was detected in lung cancer cell lines and that MAP2K3 expression was upregulated in cancer compared with nonmalignant lung tissues, which suggested that MAP2K3 may be involved in tumorigenesis of lung cancer.Citation35 Functional tests showed that knocking down of MAP2K3 inhibited the proliferation and survival of lung cancer cells,Citation36 which was similar to our results. In short, the predictive effects of MOAP1, CBX7, PDGFB, and MAP2K3 identified in this study were consistent with effects in previous studies, which suggest that these four key genes deserve additional study in lung cancer. Furthermore, a risk model and a nomogram were established on the basis of these four key common genes. The risk model and nomogram accurately predicted the overall survival of patients with lung cancer and was validated in another lung cancer data set, indicating that the risk model and nomogram have potential clinical value.
To investigate the possible molecular mechanisms of four key prognostic genes, patients with lung cancer were divided into high-risk and low-risk groups according to risk scores. Then, GSEA was performed to enrich biological processes and signaling pathways in which the differentially expressed genes between high-risk and low-risk groups were involved. Among the top 10 KEGG pathways, pathways in cancer and small cell lung cancer were obviously related to the tumorigenesis and development of lung cancer. In addition, BM, which was described as in the top two of enriched GO terms, was intensively associated with lung cancer.Citation37 Investigations showed that the histologic heterogeneity of lung adenocarcinoma was partly related to the cancer cell–stromal interaction, especially through BM preservation or destruction.Citation38 Moreover, a study of NSCLC found that loss of BM integrity was strongly related to NSCLC, and the loss of BM integrity was associated with degradation of nidogen-1, an essential component of the BM.Citation37 Therefore, we speculated that the four key prognostic genes may affect the development of lung cancer through cancer and small cell lung cancer signaling pathways and BM function.
This study may help clarify the common pathogenesis of lung cancer and OSA. Nevertheless, limitations exist. First, this study was a retrospective analysis based on existing databases. Therefore, a series of prospective studies is necessary to verify the bioinformatics results. Second, we aimed to find a practical prognosis-predicting model, but it remains rudimentary, so additional exploration is needed. Third, though genes shared by OSA and lung cancer were identified, the biological function of these genes in lung cancer has not yet been fully clarified. Work to reveal the pathogenesis of these two diseases at the molecular level remains indispensable.
Conclusion
In this study, WGCNA was used to explore shared genes, investigate the common mechanisms associated with lung cancer and OSA, and evaluate the prognostic value of these genes in patients with lung cancer. Four key common genes were identified, and a risk model and nomogram were established to predict the prognosis of patients with lung cancer with relatively high accuracy. This study reveals the potential molecular mechanisms of OSA in lung cancer for the first time, providing some new guidance and ideas for additional investigations of these two diseases.
Acknowledgments
This work was supported by the National Natural Science Foundation of China (Grant No. 81660493) and the Natural Science Foundation of Jiangxi Province (Grants No. 20171BAB205053 and 20202ACBL206019).
Disclosure
The authors report no conflicts of interest in this work.
References
- Siegel RL, Miller KD, Jemal A. Cancer statistics, 2020. CA Cancer J Clin. 2020;70(1):7–30. doi:10.3322/caac.21590
- Yang D, Liu Y, Bai C, Wang X, Powell CA. Epidemiology of lung cancer and lung cancer screening programs in China and the United States. Cancer Lett. 2020;468:82–87. doi:10.1016/j.canlet.2019.10.009
- Bade BC, Dela CC. Lung cancer 2020: epidemiology, etiology, and prevention. Clin Chest Med. 2020;41(1):1–24. doi:10.1016/j.ccm.2019.10.001
- Rundo JV. Obstructive sleep apnea basics. Cleve Clin J Med. 2019;86(9Suppl 1):2–9. doi:10.3949/ccjm.86.s1.02
- Yang X, Niu X, Xiao Y, Lin K, Chen X. MiRNA expression profiles in healthy OSAHS and OSAHS with arterial hypertension: potential diagnostic and early warning markers. Respir Res. 2018;19(1):194. doi:10.1186/s12931-018-0894-9
- Ko CY, Liu QQ, Su HZ, et al. Gut microbiota in obstructive sleep apnea-hypopnea syndrome: disease-related dysbiosis and metabolic comorbidities. Clin Sci (Lond). 2019;133(7):905–917. doi:10.1042/CS20180891
- Huang T, Lin BM, Stampfer MJ, et al. Associations of self-reported obstructive sleep apnea with total and site-specific cancer risk in older women: a prospective study. Sleep. 2020;16(7):1091–1098. doi:10.1093/sleep/zsaa198
- Cabezas E, Pérez-Warnisher MT, Troncoso MF, et al. Sleep disordered breathing is highly prevalent in patients with lung cancer: results of the sleep apnea in lung cancer study. Respiration. 2019;97(2):119–124. doi:10.1159/000492273
- Seijo LM, Pérez-Warnisher MT, Giraldo-Cadavid LF, et al. Obstructive sleep apnea and nocturnal hypoxemia are associated with an increased risk of lung cancer. Sleep Med. 2019;63:41–45. doi:10.1016/j.sleep.2019.05.011
- Torres M, Martinez-Garcia MÁ, Campos-Rodriguez F, et al. Lung cancer aggressiveness in an intermittent hypoxia murine model of postmenopausal sleep apnea. Menopause. 2020;27(6):706–713. doi:10.1097/GME.0000000000001526
- Langfelder P, Horvath S. WGCNA: an R package for weighted correlation network analysis. BMC Bioinform. 2008;9(1):559. doi:10.1186/1471-2105-9-559
- Zhang B, Horvath S. A general framework for weighted gene co-expression network analysis. Stat Appl Genet Mol Biol. 2005;4(1):17. doi:10.2202/1544-6115.1128
- Yu G, Wang LG, Han Y, He QY. clusterProfiler: an R package for comparing biological themes among gene clusters. Omics. 2012;16(5):284–287. doi:10.1089/omi.2011.0118
- Hirsch FR, Scagliotti GV, Mulshine JL, et al. Lung cancer: current therapies and new targeted treatments. Lancet. 2017;389(10066):299–311. doi:10.1016/S0140-6736(16)30958-8
- Li L, Lu J, Xue W, et al. Target of obstructive sleep apnea syndrome merge lung cancer: based on big data platform. Oncotarget. 2017;8(13):21567–21578. doi:10.18632/oncotarget.15372
- Zhu Y, Ding X, She Z, et al. Exploring shared pathogenesis of Alzheimer’s disease and type 2 diabetes mellitus via co-expression networks analysis. Curr Alzheimer Res. 2020;17(6):566–575. doi:10.2174/1567205017666200810164932
- Sezin T, Vorobyev A, Sadik CD, Zillikens D, Gupta Y, Ludwig RJ. Gene expression analysis reveals novel shared gene signatures and candidate molecular mechanisms between pemphigus and systemic lupus erythematosus in CD4(+) T cells. Front Immunol. 2017;8:1992. doi:10.3389/fimmu.2017.01992
- Stiefel P, Sánchez-Armengol MA, Villar J, Vallejo-Vaz A, Moreno-Luna R, Capote F. Obstructive sleep apnea syndrome, vascular pathology, endothelial function and endothelial cells and circulating microparticles. Arch Med Res. 2013;44(6):409–414. doi:10.1016/j.arcmed.2013.08.005
- Hoffmann M, Wolf J, Szyndler A, Singh P, Somers VK, Narkiewicz K. Serum of obstructive sleep apnea patients impairs human coronary endothelial cell migration. Arch Med Sci. 2017;13(1):223–227. doi:10.5114/aoms.2015.56490
- Chen J, Liu A, Wang Z, et al. LINC00173.v1 promotes angiogenesis and progression of lung squamous cell carcinoma by sponging miR-511-5p to regulate VEGFA expression. Mol Cancer. 2020;19(1):98. doi:10.1186/s12943-020-01217-2
- Ma SC, Li Q, Peng JY, et al. Claudin-5 regulates blood-brain barrier permeability by modifying brain microvascular endothelial cell proliferation, migration, and adhesion to prevent lung cancer metastasis. CNS Neurosci Ther. 2017;23(12):947–960. doi:10.1111/cns.12764
- Law J, Yu VC, Baksh S. Modulator of Apoptosis 1: a highly regulated RASSF1A-interacting BH3-like protein. Mol Biol Int. 2012;2012:536802. doi:10.1155/2012/536802
- Law J, Kwek I, Svystun O, et al. RACK1/TRAF2 regulation of modulator of apoptosis-1 (MOAP-1). Biochim Biophys Acta Mol Cell Res. 2018;1865(5):684–694. doi:10.1016/j.bbamcr.2018.02.006
- Wu T, Chen W, Kong D, et al. miR-25 targets the modulator of apoptosis 1 gene in lung cancer. Carcinogenesis. 2015;36(8):925–935. doi:10.1093/carcin/bgv068
- Forzati F, Federico A, Pallante P, Fedele M, Fusco A. Tumor suppressor activity of CBX7 in lung carcinogenesis. Cell Cycle. 2012;11(10):1888–1891. doi:10.4161/cc.20022
- Forzati F, Federico A, Pallante P, et al. CBX7 is a tumor suppressor in mice and humans. J Clin Invest. 2012;122(2):612–623. doi:10.1172/JCI58620
- Cacciola NA, Sepe R, Forzati F, et al. Restoration of CBX7 expression increases the susceptibility of human lung carcinoma cells to irinotecan treatment. Naunyn Schmiedebergs Arch Pharmacol. 2015;388(11):1179–1186. doi:10.1007/s00210-015-1153-y
- Pallante P, Sepe R, Federico A, Forzati F, Bianco M, Fusco A. CBX7 modulates the expression of genes critical for cancer progression. PLoS One. 2014;9(5):e98295. doi:10.1371/journal.pone.0098295
- Peng X, Guan L, Gao B. miRNA-19 promotes non–small-cell lung cancer cell proliferation via inhibiting CBX7 expression. Onco Targets Ther. 2018;11:8865–8874. doi:10.2147/OTT.S181433
- Fredriksson L, Li H, Eriksson U. The PDGF family: four gene products form five dimeric isoforms. Cytokine Growth Factor Rev. 2004;15(4):197–204. doi:10.1016/j.cytogfr.2004.03.007
- Wagner KD, Du S, Martin L, Leccia N, Michiels JF, Wagner N. Vascular PPARβ/δ promotes tumor angiogenesis and progression. Cells-Basel. 2019;8(12):1623. doi:10.3390/cells8121623
- Reinmuth N, Rensinghoff S, Raedel M, et al. Paracrine interactions of vascular endothelial growth factor and platelet-derived growth factor in endothelial and lung cancer cells. Int J Oncol. 2007;31(3):621–626.
- Donnem T, Andersen S, Al-Saad S, Al-Shibli K, Busund LT, Bremnes RM. Prognostic impact of angiogenic markers in non–small-cell lung cancer is related to tumor size. Clin Lung Cancer. 2011;12(2):106–115. doi:10.1016/j.cllc.2011.03.005
- Donnem T, Al-Saad S, Al-Shibli K, Busund LT, Bremnes RM. Co-expression of PDGF-B and VEGFR-3 strongly correlates with lymph node metastasis and poor survival in non-small-cell lung cancer. Ann Oncol. 2010;21(2):223–231. doi:10.1093/annonc/mdp296
- Park JC, Chae YK, Son CH, et al. Epigenetic silencing of human T (brachyury homologue) gene in non–small-cell lung cancer. Biochem Biophys Res Commun. 2008;365(2):221–226. doi:10.1016/j.bbrc.2007.10.144
- Gurtner A, Starace G, Norelli G, Piaggio G, Sacchi A, Bossi G. Mutant p53-induced up-regulation of mitogen-activated protein kinase 3 contributes to gain of function. J Biol Chem. 2010;285(19):14160–14169. doi:10.1074/jbc.M109.094813
- Willumsen N, Bager CL, Leeming DJ, Bay-Jensen AC, Karsdal MA. Nidogen-1 degraded by cathepsin S can be quantified in serum and is associated with non–small cell lung cancer. Neoplasia. 2017;19(4):271–278. doi:10.1016/j.neo.2017.01.008
- Matsuo Y, Hashimoto S, Koga T, et al. Growth pattern correlates with the distribution of basement membrane and prognosis in lung adenocarcinoma. Pathol Res Pract. 2004;200(7–8):517–529. doi:10.1016/j.prp.2004.05.002