
Abstract
Background
Hepatocellular carcinoma (HCC) is the second leading cause of cancer-related mortality worldwide. HCC transcriptome has been extensively studied; however, the progress in disease mechanisms, prognosis, and treatment is still slow.
Methods
A rank-based module-centric workflow was introduced to analyze important modules associated with HCC development, prognosis, and drug resistance. The currently largest HCC cell line RNA-Seq dataset from the LIMORE database was used to construct the reference modules by weighted gene co-expression network analysis.
Results
Thirteen reference modules were identified with validated reproducibility. These modules were all associated with specific biological functions. Differentially expressed module analysis revealed the crucial modules during HCC development. Modules and hub genes are indicative of patient survival. Modules can differentiate patients in different HCC stages. Furthermore, drug resistance was revealed by drug-module association analysis. Based on differentially expressed modules and hub genes, six candidate drugs were screened. The hub genes of those modules merit further investigation.
Conclusion
We proposed a reference module-based analysis of the HCC transcriptome. The identified modules are associated with HCC development, survival, and drug resistance. M3 and M6 may play important roles during HCV to HCC development. M1, M3, M5, and M7 are associated with HCC survival. High M4, high M9, low M1, and low M3 may be associated with dasatinib, doxorubicin, CD532, and simvastatin resistance. Our analysis provides useful information for HCC diagnosis and treatment.
Introduction
With the rapid development of high throughput technologies, large-scale transcriptome analysis has become affordable. Systems biology analytical methods have been widely used to utilize those big data to investigate cancers.Citation1,Citation2 State-of-the-art methods like network medicine have been applied in disease diagnosis, treatment, and drug discovery.Citation3,Citation4 Gene co-expression network (GCN) analysis is an extensively used approach in analyzing omics data.Citation5 GCN assumes that genes with similar expression patterns will involve in a common pathway or biological process. GCN uses correlation and module detection algorithms to find biologically meaningful gene sets.Citation5,Citation6 Search in Google Scholar with WGCNA, a widely used GCN algorithm, will return about 14,600 publications about it at the time of this article. WGCNA represents weighted gene correlation network analysis. It mainly produces gene module assignment, gene connectivity, and module-level expression information from the transcriptome. However, current applications of WGCNA are notoriously dominated by its reproducibility in hub genes.
WGCNA has been applied in hepatocellular carcinoma (HCC) transcriptome many times. Hundreds of publications claimed that they identified important hub genes associated with HCC development according to Google Scholar in 2021. Unfortunately, we found these hub genes or signature genes show a low percentage of overlap after we collected some of that gene list and compared them (). However, the low overlap may be caused by the different datasets chosen, GCN parameter set, or data preprocessing. Thus, the establishment of a reproducible pipeline in modules or hub gene identification is an urgent need. A recent publication used reference modules from cell lines, which bear clear genomic background than cancer tissue data that are profiled from a mix of cell components.Citation7 Results showed that the analysis pipeline is vigorous. It has been proved that cell line models maintain molecular characteristics of HCC and could be used as a model for novel therapies.Citation8 Therefore, cell lines would still be a good start for HCC transcriptome analysis.
Table 1 Some Gene Signatures for Hepatocellular Carcinoma Extracted from Literature
Here, we first adopted the analysis pipeline to HCC and identified valid modules and hub genes associated with HCC development. The analysis workflow is displayed in . The good point of the analysis is the use of rank which is dimensionless. Firstly, we used an HCC cell line dataset to construct the reference modules and found that a lower power was needed to achieve a scale-free network based on ranks rather than traditional expression intensity. Secondly, we used other datasets to validate that the reference modules are stable. Thirdly, we collected datasets and then projected them to the reference modules to identify important modules and hub genes that are associated with HCC development and drug resistance. Finally, we used the important genes as candidates for drug screening. Our analysis provided stable modules and important genes in HCC. The analysis pipeline can be extended to other kinds of diseases.
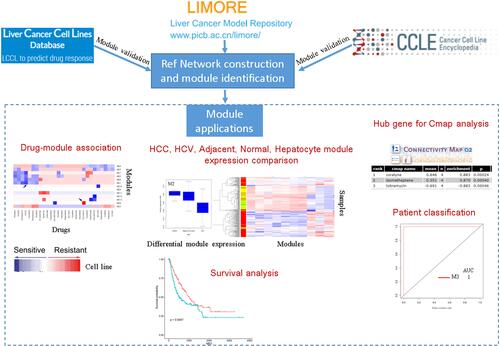
Figure 1 A workflow diagram for the analysis. The LIMORE dataset was to build a reference network and identify modules. The preservation of identified modules was validated in two independent datasets LCCL and CCLE. These modules were used as references, to which new datasets can be projected. The derived module eigengene (ME) can be used in differential module identification, survival analysis, patient classification, and in silico drug-resistant analysis.
Materials and Methods
Datasets Selection and Transcriptome Data Preparation
RNA-Seq data was collected from public repositories. RNA expression in 34 liver cancer cell lines was retrieved from the Liver Cancer Cell lines Database (LCCL).Citation9 Gene expression profiles of 81 cell lines were downloaded from LIVER CANCER MODEL REPOSITORY (LIMORE).Citation10,Citation11 RNA-Seq data of 27 liver cancer cell lines were downloaded from Cancer Cell Line Encyclopedia (CCLE).Citation12 Drug response data in LIMORE and LCCL databases were also downloaded from corresponding repositories. The HCC tissue RNA-Seq data of 423 samples were downloaded from TCGA through GDC Data Portal (https://portal.gdc.cancer.gov/). Microarray datasets were downloaded from the National Center for Biotechnology Information Gene Expression Omnibus (NCBI GEO) database under the accession numbers GSE14323, GSE102079, and GSE107170. GSE14323 contains expression data for 115 liver samples from subjects with HCV, HCV-HCC, or normal liver.Citation13 GSE102079 consists of 257 samples of HCC, adjacent and normal liver.Citation14 Gene expression of 18 hepatocyte samples from HCV HCC patients was retrieved from GSE107170.Citation15 LIMORE dataset including 81 RNA-Seq profiles of HCC cell lines, was used for reference module construction. LCCL and CCLE were used for validation and drug resistance analysis. Cell line doubling time data was downloaded from the Cellosaurus database.Citation16 Due to the open access to transcriptome and clinical data in TCGA and GEO, additional approval from local ethics committee was not needed for this study.
Weighted Gene Co-Expression Network Analysis (WGCNA)
All data analysis was performed in the R software (v3.3.1) with the Bioconductor WGCNA package (v1.63).Citation5 Genes were filtered if FPKM < 10. According to the previous publication,Citation7 FPKM values were transformed to ranks with rank function in the R “base” package (v3.3.1). High expression gene has a high-rank value after transformation.Citation17 Finally, 9334 genes were retained for downstream signed co-expression networks construction. Briefly, the pairwise Pearson correlation coefficient is calculated for each gene in the gene expression rank matrix, and then an adjacency matrix is derived by raising the correlation matrix to a proper power.Citation18 The power of 12 was chosen, which meets the scale-free network standard. The weighted network was transformed into a network of topological overlap (TO)—a metric that defines the relationship of two genes accounting for their correlation and shared neighborhood.Citation18 Genes were hierarchically clustered based on their TO. Finally, co-expression gene modules were identified by the Dynamic Tree Cut algorithm.Citation19 As genes in a module are highly correlated, module genes can be reduced to a module eigengene (ME) by singular value decomposition. ME represents the first principal component of module expression profiles.Citation18 Therefore, ME explains the maximum amount of variation of the module expression levels. WGCNA also provides gene connectivity information, which is the sum of correlations of a gene with all other genes in the module or network. Hub gene in a co-expression module tends to have high connectivity.Citation5 For network module validation, the expression matrix was first intersected with reference dataset, and then its values were transformed to ranks before module projection.
Switch Genes Identification
Switch genes are crucial genes that work during the transition from one condition to another condition in a biological network. SWIM is a MATLAB-based free software coupling with a Graphical User Interface (GUI). SWIM has been used to mine switch genes in gene co-expression networks.Citation20 GSE14323 HCV and HCC samples were used for switch gene identification. As the original intensities have been log2 transformed, SWIM parameter for fold change was set to 1.01, the P value was set at 0.01, iterations for each replicate were set to 30. Other parameters were set as default.
Functional Annotation of the Modules
The gProfileR package was used for enrichment analysis of reference modules. It maps genes to known functional information sources such as Gene Ontology (GO), Kyoto Encyclopedia of Genes and Genomes (KEGG), Reactome Pathway Database (REAC), Human Phenotype Ontology (HPO) and detects statistically significantly enriched terms.Citation21 The overrepresentation of a term is defined as a P value with an adjustment for multiple testing. An ontology-focused multiple testing correction method called g:SCS was used for P value adjustment.Citation21 Genes with high connectivity in each module were submitted to a network-based web tool called MIENTURNET (http://userver.bio.uniroma1.it/apps/mienturnet/) for extracting the microRNAs that could target a list of genes provided as input.Citation22
Module Validation
The reproducibility of the reference modules was examined internally and externally. Firstly, half sampling was used to calculate the connectivity and correlate it with the original connectivity. The above process was repeated 1000 times for every module. The resulting correlation data were presented as mean ± sd. Secondly, module preservation analysis was performed for the original data without rank transformation and rank transformed data. The above process was performed by the ModulePreservation function with 100 permutations and parallel calculation.Citation23 Resulting Zsummary is a measure for distinguishing preserved from non-preserved modules.Citation23 The Zsummary threshold was set at 2 regarding the preservation of a module in the rank transformed data. The analysis was conducted according to the manual of module preservation analysis.Citation23 Thirdly, two other datasets (LCCL and CCLE) were used to run the module preservation analysis.
Analysis of Relationships Between Modules, Survival, and Drugs
We correlated module eigengene with survival, and drugs. Survival analysis was performed in R survival and survminer packages. For TCGA, a Log rank test was used to analyze survival differences between patient groups with high/low module expression or hub gene expression. In drug-module association analysis, the MEs matrix was correlated to drug IC50 data by Spearman correlation. Then the data was visualized by heatmap with heatmap.2 function in gplots package.
Connectivity Map Analysis
The candidate drugs associated with HCV and HCC were screened by the hub genes of modules that had good AUC. The top hub gene in each module was extracted as up-regulated or down-regulated gene lists and then submitted to the CMap tool at https://portals.broadinstitute.org/cmap.Citation4 Significant results were retrieved at the level of 0.01. The top 3 drugs for HCV or HCC were recorded.
Statistical Analysis
One-way ANOVA was used when comparing means between multiple groups. Student’s t-test was used to compare the means of two groups. Statistical significance was set at 0.01 unless otherwise specified. When multiple comparisons were performed, P values were adjusted using the Bonferroni method. AUC of ROC was calculated in the ROCR package.
Results
Thirteen Reference Modules Were Identified in the HCC Cell Lines
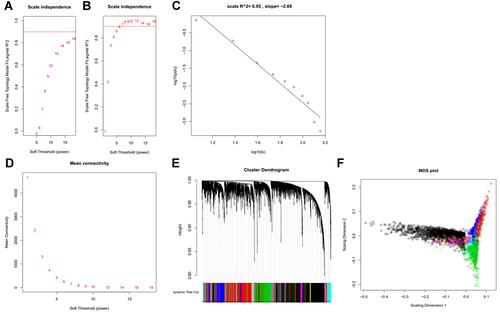
To construct a map of reference modules, expression profiles of 81 HCC cell lines from LIMORE were used for WGCNA. Both the log2 transformed FPKM values of gene expression and the ranks of gene expression were used to construct scale-free networks. Compared to the network constructed by log2 transformed FPKM, the rank-based network required a lower power parameter to achieve a scale-free network ( and ). A total of 13 co-expressed gene modules were identified (–). The top hub gene with high connectivity for each module was also provided (). Functional annotation shows that these modules were associated with transcription factors, mitochondrion, lipid metabolism, cell cycle, and N-Glycan biosynthesis (). Table S1 provides detailed information for all the analyzed genes, including module assignment and connectivity.
Table 2 Functional Annotation and Hub Gene of the 13 Identified Modules in Hepatocellular Carcinoma Cell Line
Figure 2 Gene co-expression modules identified in LIMORE HCC cell line dataset. (A) Scale-free topology model fit R2 versus power selection using FPKM; (B) scale-free topology model fit R2 versus power selection using rank; (C) the log-log plot shows an R2 of 0.95 when power set at 12, indicating the network follows the scale-free topology criterion; (D) mean connectivity versus power selection, showing the connectivity is stable at power 12; (E) thirteen modules were identified according to the dendrogram produced by hierarchical clustering of LIMORE genes based on a topological overlap matrix (TOM). The modules were assigned colors as indicated in the horizontal bar; (F) multidimensional scaling plots in two dimensions (color-coded as in E) depict the relative size of the modules.
To examine the module reproducibility, we calculated the correlation between the original connectivity and that of 1000 samplings for each module. All the modules had average connectivity larger than 0.8 (). The original dataset with log2 transformed values was mapped to the reference modules to check the module stability. The result shows that these modules were well reproducible in the original intensity dataset (). All of the modules have a Zsummary.pres statistic larger than 10, indicating very strong preservation of modules. Two other HCC cell line datasets CCLE and LCCL were also used in the same analysis for reproducibility check. Although the sample size is small for the two datasets (LCCL: 34 and CCLE: 28), most of the modules were preserved ( and ). M6 has a marginal preservation metric, which may be due to the small size of overlap genes between the datasets CCLE and LIMORE (34 genes).
Figure 3 The identified thirteen modules are reproducible. (A) Bar plots showing the intramodule connectivity correlation of each module by half-sampling 1000 times with the original one (mean ±SD); (B) preservation of modules in a network constructed by FPKM compared to that constructed by rank. (C) preservation of modules in CCLE network compared to that in LIMORE; (D) preservation of modules in LCCL network compared to that in LIMORE. Dashed green and blue lines represent the Zsummary threshold for strong (Z>10) and weak–moderate (2<Z<10) module preservation. Numbers along with colored dots represent the identified modules.

Differentially Expressed Modules (DEM) in HCC Development
To detect DEM in HCC development, we projected GSE107170 to the reference modules. Modules have different expression patterns in HCC development. Normal tissue has a distinct expression pattern (). The most significant module in HCC vs normal are M3 and M6. M3 is up-regulated and M6 is down-regulated ( and ). The same directions are observed in HCV vs normal for M3 and M6, but more significant. In both HCC vs HCV and HCC vs HCC_cirrhosis, M9 is most significantly up-regulated (). The most significant down-regulated module is M3. All the DEMs in different HCC development stages are summarized in Table S2.
Figure 4 Differentially expressed modules (DEM) in HCC development. (A) Clustering analysis of the thirteen modules in HCC development. In the left sample bar, green, blue, yellow, and red denotes normal, HCV, HCC_cirrhosis, and HCC samples; (B) Box plot showing the M3 expression; (C) Box plot showing the M6 expression; (D) Box plot showing the M9 expression; (E) clustering analysis of the thirteen modules in normal, adjacent and HCC tissues. In the left sample bar, green, yellow and red denotes normal, adjacent, and HCC samples.
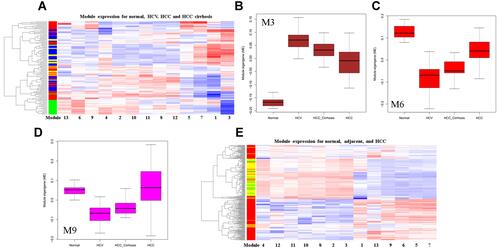
Liver adjacent non-tumor tissue is frequently biopsied in HCC differential expression analysis. However, the difference between normal liver and adjacent non-tumor tissue is not well understood. We projected GSE102079 to the reference modules and found that the two tissues show no significant difference in expression at the module level. Clustering analysis shows that the normal and adjacent tissue is un-separable ().
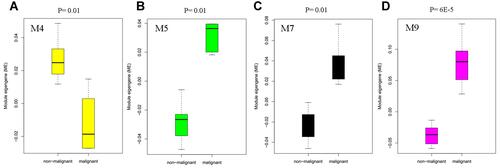
The hepatocyte is the major hepatic parenchymal cell. We also used the hepatocyte profiles in GSE107170 to validate the above differential modules. Four differential modules were identified, they were M4, M5, M7, and M9 (). All these modules also showed differences in the comparison of HCC vs normal (Table S2). M5 and M7 are both associated with the cell cycle but with different expression patterns as they were identified as distinct modules. M5 may participate in G1/S phase transition, while M7 may participate in G2/M phase transition. The hub gene of M5 and M7 is associated with patient survival, which will be presented in the following section.
Figure 5 Box plot showing the differentially expressed modules M4 (A), M5 (B), M7 (C), and M9 (D) in malignant hepatocytes compared to non-malignant hepatocytes in the human liver.
We also used SWIM, a MatLab-based tool that identifies switch genes from gene correlation networks. Switch genes are defined as genes that are important during the transition between two conditions. We examined the overlap of hub genes and switch genes. Four hundred and eighty-four switch genes were identified, although only M11 TAOK2 overlapped with the hub gene. Further checking if these switch genes rank top 10 in each module, we found that 13 genes meet this criterion. Switch genes were enriched within the top 10 genes in each module (Hypergeometric test P < 0.01). They were SNAPC4, AXL, HNF1A, HNF4A, NCAPG, XAB2, TARS2, MED27, TAOK2, CD2BP2, ZNF768, PGP, and NARFL. With top-ranking intramodule connectivity, these switch genes may play important roles in HCC development (Table S3). MIENTURNET tool identified that these switch genes may be regulated by miR-98-5p (P = 0.02) and miR-484 (P = 0.03).
Modules and Hub Genes are Correlated with Patient Survival
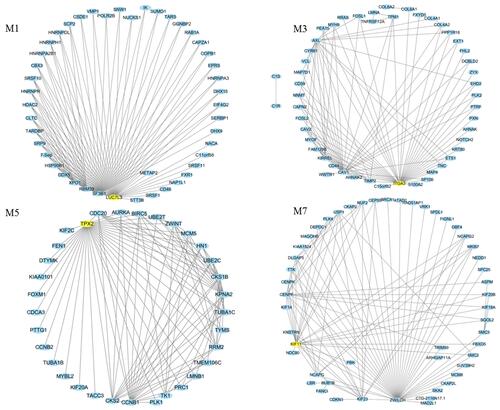
To check if these modules were associated with patient survival, we performed a univariate analysis with the TCGA HCC dataset. Kaplan–Meier plot showed that patients can be separated into two groups with different overall survival rates. It showed that M4 and M5 were indicative of overall survival (OS) (). M3 and hub genes of M5 TPX2 were marginally indicative of OS. Hub genes TPX2, LUC7L3, KIF11, and modules M4, M5, M7 were indicative of disease-specific survival (DSS) (). ITGA3, TPX2, LUC7L3, KIF11, and modules M4, M5, M7 were indicative of disease-free survival (DFS) (). ITGA3 is the hub gene of M3 which has not been reported to be associated with HCC. TPX2 and M5 may play important roles in HCC survival. These hub genes are crucial in HCC development. The top 100 connections of M1, M3, M5, and M7 were visualized (). Besides, several other highly connected genes are important in HCC. M1 SF3B1 is only recently reported to be associated with aggressiveness and survival of HCC.Citation24 M3 CAV1 promotes HCC progression and metastasis.Citation25 M5 CCNB1 is an important cell cycle regulator in HCC.Citation26 M7 ZWILCH is an essential gene in chromosome segregation.Citation27 We also downloaded cell line doubling time data from the Cellosaurus database, and correlated MEs with doubling time. M3 (focal adhesion) is the most significant module that is positively correlated with doubling time (R = 0.25, P < 0.01).
Figure 6 Modules and hub genes are indicative of patient survival. (A) Survival curves indicate that M4 and M5 expression can separate patients into two groups with different overall survival times; (B) survival curves indicate that TPX2, LUC7L3, KIF11, and modules M4, M5, M7 expression can separate patients into two groups with different disease-specific survival times; (C) survival curves indicate that ITGA3, TPX2, LUC7L3, KIF11, and modules M4, M5, M7 expression can separate patients into two groups with different disease-free survival times. Redline: low expression of genes or modules. Greenline: high expression of genes or modules.
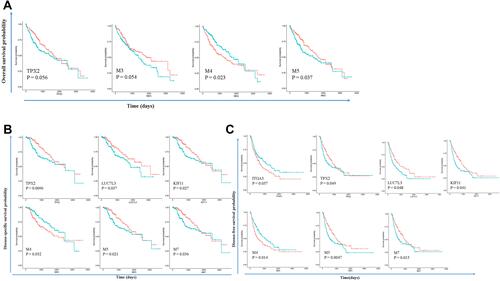
Figure 7 Top 100 connections in modules M1, M3, M5, and M7 were visualized in Cytoscape (v3.7.0). Degree analysis shows that LUC7L3, ITGA3, TPX2, and KIF11 are the hub genes in the modules. These hub genes are yellow nodes in the networks.
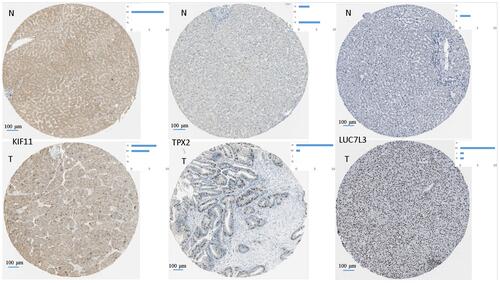
We validate hub genes TPX2 (M5), LUC7L3 (M1) and KIF11 (M7) were all unfavorable (P < 0.001) in liver cancer according to the Human Protein Atlas.Citation28 Immunohistochemical staining also confirms that these proteins are up-regulated in HCC ().
Figure 8 Representative images for immunohistochemical staining of the hub genes TPX2 (M5), LUC7L3 (M1), and KIF11 (M7), which were all up-regulated in liver cancer according to the Human Protein Atlas. The blue bar in the upper right denotes the cases with high, moderate, low, and not detected signals.
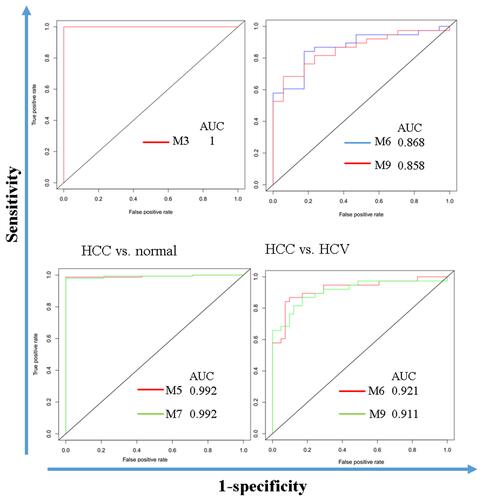
Modules Can Differentiate Patients in Different HCC Stages
To demonstrate the utility of the identified modules, we analyzed the ROC curves to evaluate their sensitivity and specificity in the diagnosis of HCC patients. The ROC curves showed that M5 and M7 can perfectly separate HCC and normal samples. M6 and M9 can well separate HCC and HCV samples (). These results may indicate the importance of the two modules in HCC development. shows a full list of modules that have an AUC larger than 0.8.
Table 3 Sensitivity, Specificity, and Area Under ROC Curve (AUC)
Figure 9 Modules M3, M5, M6, M7, and M9 have good performance in distinguishing normal liver, HCV, and HCC.
Drug Resistance Analysis Based on Correlations Between Module Expression and IC50
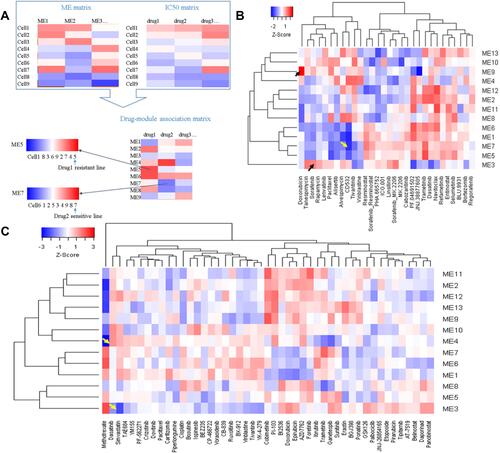
Chemo drug response is different in patients. Mechanisms of drug resistance are important for personalized medicine. To screen potential drug-related modules, we used the drug response data in LIMORE and LCCL databases. The IC50 data was correlated with module MEs in the two datasets, respectively. A high correlation value may indicate possible drug mechanisms (). Drug-MEs heatmap showed that doxorubicin was highly correlated with M9 (R = 0.58, ). It has been revealed that knockdown of ELF4 significantly reduced the TERT expression and sphere-forming ability in HCC cells.Citation29 Thus, high M9 expression cancer cells may need a high concentration of doxorubicin to neutralize. We can infer that cell lines with high M9 expression are resistant. CD532, an Aurora A kinase inhibitor, was highly correlated with M1 (R = −0.64, ). It has been found that the expression of Aurora A kinase is positively regulated by HDAC2. Thus, low M1 expression cancer cells may need a high concentration of CD532 to neutralize.Citation30 Simvastatin was highly correlated with M3 (R = −0.55, ). Simvastatin could disrupt cytoskeleton integrity and focal adhesion complex assembly.Citation31 Sorafenib has a high correlation with M3 (R = 0.48, ). Acquired sorafenib resistance is associated with activation of focal adhesion kinase.Citation32 Dasatinib was highly correlated with M4 (R = 0.54, ). It has been found that dasatinib might have positive as well as negative effects on the metabolism of glucose and lipids.Citation33 All these correlations were significant (P < 0.01). The drug-ME correlation matrix was provided in Tables S4 and S5.
Figure 10 Correlations between module expression and IC50 reveal potential drug mechanisms of action and drug-resistant lines. (A) Workflow for drug-module association analysis; (B) drug-module correlation matrix for LCCL; (C) drug-module correlation matrix for LIMORE.
Based on the drug-ME correlation information, we can also rank cell lines to find potential drug-resistant lines. A positive correlation indicates high ME cell lines are resistant and a negative correlation indicates high ME cell lines are sensitive. For example, CCLE HepG2 has the highest expression of M4, while JHH6 has the lowest expression of M4. It has been reported that HepG2 is not sensitive to dasatinib. Sk-Hep1 was sensitive to dasatinib.Citation34 In our analysis, Sk-Hep1 was among the most sensitive cell lines in our analysis. Another example is M3. In both CCLE and LCCL, JHH2, SNU-423, and SNU-387 cells have high expression of M3, and these cells are sorafenib-resistant.Citation35 Interestingly, simvastatin could re-sensitize hepatocellular carcinoma cells to sorafenib.Citation36 In our analysis, we infer that M3 high expression cells are sorafenib-resistant but simvastatin-sensitive. The ME matrices for LIMORE, CCLE, and LCCL are provided in Tables S6–S8.
Drugs Screening Based on the Hub Genes of Differentially Expressed Modules
To screen potential treatment drugs, we selected the top hub gene with high intramodule connectivity from interesting modules, then submitted it to the Connectivity Map. For HCV, M3 and M6 were selected. For HCC, M1, M5, M6, M7, M9, and M13 were selected as they have good AUC. Enrichment score and P value were returned by Connectivity Map. A positive Enrichment score indicates the database gene signatures have similar changes as the input query genes. A negative score indicates inversely related gene lists, and near-zero indicates unrelated gene lists.Citation4 The top 3 drugs for HCC and HCV are listed in . Alsterpaullone is a CDK1/2 inhibitor and is an antiviral agent in HIV treatment.Citation37
Table 4 Connectivity Map Analysis Identified 6 Candidate Drugs
Discussion
We observed that signatures identified in previous publications are hard to reproduce. As it is well known that complex human diseases such as cancers are rarely caused by a single molecular determinant but are more likely influenced by a network of interacting genes.Citation7 Therefore, the reason behind the phenomenon is neither technical issues nor biological problems.Citation38 A recent review also arise the concern about the gene signatures that lack reproducibility and cannot enter clinical applications.Citation39 Although state-of-the-art bioinformatics tools have been extensively applied to HCC to mine biomarkers, current analysis pipelines still focus on hub genes, ignoring the module-level information.Citation40,Citation41 We also observed that hub genes/signature genes are not so reliable. Thus, in this analysis, we used a module-centric strategy. To avoid interference from cells within the cancer microenvironment, we start our module identification from a panel of 81 HCC cell lines, excluding the influence of non-cancerous cells.Citation42 Furthermore, we used a rank-based method, which has also been proposed to improve reproducibility and accuracy in transcriptome analysis.Citation43 Here, we proposed a new analysis workflow that enables module-level comparisons. Furthermore, the analysis pipeline can be extended to analysis of transcriptome data from other kinds of diseases.
In this study, we chose HCC cell line data to build reference modules. Further transcriptome analysis will always dock the reference modules. Derived ME matrix can be used for differential module expression analysis or associated with external information, such as drug response or survival data. Here, we identified several significant modules that may participate in HCV, HCC, and drug resistance. Based on these valid modules, hub genes were then mined. Associations of modules and survival, drug response were analyzed.
We found that the difference between normal liver and HCC adjacent tissue is not significant. This would help investigators to choose proper control samples if normal tissue is not available. We also observed that normal tissue has a compact module expression range. The HCC tissue has the most variable module expression range. This information may indicate that HCC is diverse. Thus, the gene-level analysis results may vary due to the inherent property of HCC. Module-level analysis may provide more stable results, as genes in a module may participate in a common biological process.
We also provided a pipeline for drug-module association analysis based on the ME matrix and IC50 matrix. Associations between cell lines and drugs can be inferred from those matrices. Thus, ranking the cells according to ME values can provide information about drug resistance or sensitivity. Choosing a proper cell model is the first step in pharmacological mechanism research. However, currently, there is no comprehensive resource about drug resistance for many HCC cell lines. A cell line may be resistant to one drug but sensitive to another drug. The task needs tremendous hard work when considering drug combinations. Researchers can only choose a cell model empirically according to previous publications. Network pharmacology has advantages in predicting valid drug or drug combinations, which will greatly reduce the workload and time. We proposed module-based drug resistance and combination inference. In our analysis, we suggested that if a drug IC50 is positively correlated with a module expression, the cell line with high expression of that module would have resistance potential. However, if another drug IC50 is negatively correlated with that module expression, the cell line with high expression of that module would have sensitive potential. The combination of the two drugs may re-sensitize the resistant drug. A further strategy is the combination of drugs that target different modules and both should be sensitive. If we treat modules as hallmarks of cancer, drugs should be subscribed to maximize the effectiveness of the medicine by targeting different modules. Thus, our analysis may provide important information.
Using these modules, we also correlate them to survival and doubling time. We for the first time found that M3, a focal adhesion module, is positively correlated with doubling time. It has been found that doubling time was correlated with constitutive activation of focal adhesion kinase.Citation44 We found that higher expression of M3 indicates poor survival outcomes. M3 can perfectly classify HCV patients as it is elevated in HCV than normal tissue. We found that simvastatin may target M3. Simvastatin has been used to treat HCV clinically.Citation45 Simvastatin is cytotoxic and could affect HCV infection in lipoprotein receptor-deficient cell lines.Citation46
Finally, using top hub genes in DME and Connectivity Map tool, we identified six drugs that merit further investigation. Some of the drugs have been reported in cancer treatment. For HCV, doxorubicin has been used to treat advanced HCC for tens of years.Citation47 Both GW-8510 and alsterpaullone are CDK inhibitors. Alsterpaullone was identified as the most potent inhibitor of HIV-1 among several drugs. For HCC, a derivative of digoxigenin has been proved to have anticancer activities.Citation48 Coralyne has synergistic effects on cell migration and proliferation of breast cancer cell lines with paclitaxel.Citation49 These drugs merit further investigations.
Conclusion
In summary, we proposed a reference module-based analysis of HCC transcriptome and identify key modules that are associated with HCC development, survival, and drug resistance. M3 and M6 may play important roles during HCV to HCC development. M1, M3, M5, and M7 may play important roles in HCC survival. High M4, high M9, low M1, and low M3 may be associated with dasatinib, doxorubicin, CD532, and simvastatin resistance. Our analysis provides useful information for HCC diagnosis and treatment. The applications of the analysis pipeline can be expanded to the transcriptome data of other kinds of diseases.
Data Sharing Statement
The datasets analyzed in the study are available at the public database NCBI GEO (https://www.ncbi.nlm.nih.gov/geo/), LIMORE (https://www.picb.ac.cn/limore/batch), and LCCL (https://lccl.zucmanlab.com/hcc/download). Codes to generate gene co-expression network is freely available at https://github.com/yhlaile/HCCnetwork.
Ethics Approval and Consent to Participate
This study contained no data from human participants or animals performed by any of the authors, so the need for ethical approval of it was waived by the Ethics Committee of Ningbo Medical Treatment Center Lihuili Hospital.
Disclosure
The authors report no conflicts of interest in this work.
Additional information
Funding
References
- Silverman EK, Schmidt HH, Anastasiadou E, et al. Molecular networks in network medicine: development and applications. Wires Syst Biol Med. 2020;12(6):e1489. doi:10.1002/wsbm.1489
- Paci P, Fiscon G, Conte F, Wang R-S, Farina L, Loscalzo J. Gene co-expression in the interactome: moving from correlation toward causation via an integrated approach to disease module discovery. Npj Syst Biol Appl. 2021;7(1):3. doi:10.1038/s41540-020-00168-0
- Fiscon G, Paci P. SAveRUNNER: an R-based tool for drug repurposing. BMC Bioinform. 2021;22(1):150. doi:10.1186/s12859-021-04076-w
- Lamb J, Crawford ED, Peck D, et al. The Connectivity Map: using gene-expression signatures to connect small molecules, genes, and disease. Science. 2006;313(5795):1929–1935. doi:10.1126/science.1132939
- Langfelder P, Horvath S. WGCNA: an R package for weighted correlation network analysis. BMC Bioinform. 2008;9(1):559. doi:10.1186/1471-2105-9-559
- D’Haeseleer P, Liang S, Somogyi R. Genetic network inference: from co-expression clustering to reverse engineering. Bioinformatics. 2000;16(8):707–726. doi:10.1093/bioinformatics/16.8.707
- Lai X, Lin P, Ye J, Liu W, Lin S, Lin Z. Reference module-based analysis of ovarian cancer transcriptome identifies important modules and potential drugs. Biochem Genet. 2021. doi:10.1007/s10528-021-10101-7
- Finn RS, Aleshin A, Dering J, et al. Molecular subtype and response to dasatinib, an Src/Abl small molecule kinase inhibitor, in hepatocellular carcinoma cell lines in vitro. Hepatology. 2013;57(5):1838–1846. doi:10.1002/hep.26223
- Caruso S, Calatayud AL, Pilet J, et al. Analysis of liver cancer cell lines identifies agents with likely efficacy against hepatocellular carcinoma and markers of response. Gastroenterology. 2019;157(3):760–776. doi:10.1053/j.gastro.2019.05.001
- Qiu Z, Zou K, Zhuang L, et al. Hepatocellular carcinoma cell lines retain the genomic and transcriptomic landscapes of primary human cancers. Sci Rep. 2016;6:27411. doi:10.1038/srep27411
- Qiu Z, Li H, Zhang Z, et al. A pharmacogenomic landscape in human liver cancers. Cancer Cell. 2019;36(2):179–193 e111. doi:10.1016/j.ccell.2019.07.001
- Ghandi M, Huang FW, Jane-Valbuena J, et al. Next-generation characterization of the cancer cell line encyclopedia. Nature. 2019;569(7757):503–508. doi:10.1038/s41586-019-1186-3
- Mas VR, Maluf DG, Archer KJ, et al. Genes involved in viral carcinogenesis and tumor initiation in hepatitis C virus-induced hepatocellular carcinoma. Mol Med. 2009;15(3–4):85–94. doi:10.2119/molmed.2008.00110
- Chiyonobu N, Shimada S, Akiyama Y, et al. Fatty acid binding protein 4 (FABP4) overexpression in intratumoral hepatic stellate cells within hepatocellular carcinoma with metabolic risk factors. Am J Pathol. 2018;188(5):1213–1224. doi:10.1016/j.ajpath.2018.01.012
- Diaz G, Engle RE, Tice A, et al. Molecular signature and mechanisms of Hepatitis D virus-associated hepatocellular carcinoma. Mol Cancer Res. 2018;16(9):1406–1419. doi:10.1158/1541-7786.MCR-18-0012
- Bairoch A. The cellosaurus, a cell-line knowledge resource. J Biomol Tech. 2018;29(2):25–38. doi:10.7171/jbt.18-2902-002
- R: a language and environment for statistical computing [computer program]. Vienna, Austria; 2016.
- Zhang B, Horvath S. A general framework for weighted gene co-expression network analysis. Stat Appl Genet Mol. 2005;4:Article17. doi:10.2202/1544-6115.1128
- Oldham MC, Konopka G, Iwamoto K, et al. Functional organization of the transcriptome in human brain. Nat Neurosci. 2008;11(11):1271–1282. doi:10.1038/nn.2207
- Paci P, Colombo T, Fiscon G, Gurtner A, Pavesi G, Farina L. SWIM: a computational tool to unveiling crucial nodes in complex biological networks. Sci Rep. 2017;7(1):44797. doi:10.1038/srep44797
- Reimand J, Arak T, Adler P, et al. g:Profiler-a web server for functional interpretation of gene lists (2016 update). Nucleic Acids Res. 2016;44(W1):W83–89. doi:10.1093/nar/gkw199
- Licursi V, Conte F, Fiscon G, Paci P. MIENTURNET: an interactive web tool for microRNA-target enrichment and network-based analysis. BMC Bioinform. 2019;20(1):545. doi:10.1186/s12859-019-3105-x
- Langfelder P, Luo R, Oldham MC, Horvath S. Is my network module preserved and reproducible? PloS Comput Biol. 2011;7(1):e1001057. doi:10.1371/journal.pcbi.1001057
- Lopez-Canovas JL, Del Rio-Moreno M, Garcia-Fernandez H, et al. Splicing factor SF3B1 is overexpressed and implicated in the aggressiveness and survival of hepatocellular carcinoma. Cancer Lett. 2021;496:72–83. doi:10.1016/j.canlet.2020.10.010
- Yu H, Shen H, Zhang Y, et al. CAV1 promotes HCC cell progression and metastasis through Wnt/beta-catenin pathway. PLoS One. 2014;9(9):e106451. doi:10.1371/journal.pone.0106451
- Lee JS, Chu IS, Heo J, et al. Classification and prediction of survival in hepatocellular carcinoma by gene expression profiling. Hepatology. 2004;40(3):667–676. doi:10.1002/hep.20375
- Yu DC, Chen XY, Li X, et al. Transcript levels of spindle and kinetochore-associated complex 1/3 as prognostic biomarkers correlated with immune infiltrates in hepatocellular carcinoma. Sci Rep. 2021;11(1):11165. doi:10.1038/s41598-021-89628-z
- Ponten F, Jirstrom K, Uhlen M. The human protein atlas – a tool for pathology. J Pathol. 2008;216(4):387–393. doi:10.1002/path.2440
- Sze KM, Ho DW, Chiu YT, et al. Hepatitis B virus-telomerase reverse transcriptase promoter integration harnesses host ELF4, resulting in telomerase reverse transcriptase gene transcription in hepatocellular carcinoma. Hepatology. 2021;73(1):23–40. doi:10.1002/hep.31231
- Kobayashi T, Nakazono K, Tokuda M, Mashima Y, Dynlacht BD, Itoh H. HDAC2 promotes loss of primary cilia in pancreatic ductal adenocarcinoma. EMBO Rep. 2017;18(2):334–343. doi:10.15252/embr.201541922
- Copaja M, Venegas D, Aranguiz P, et al. Simvastatin disrupts cytoskeleton and decreases cardiac fibroblast adhesion, migration and viability. Toxicology. 2012;294(1):42–49. doi:10.1016/j.tox.2012.01.011
- Zhou Q, Guo X, Choksi R. Activation of focal adhesion kinase and src mediates acquired sorafenib resistance in A549 human lung adenocarcinoma xenografts. J Pharmacol Exp Ther. 2017;363(3):428–443. doi:10.1124/jpet.117.240507
- Iizuka K, Niwa H, Kato T, Takeda J. Dasatinib improves insulin sensitivity and affects lipid metabolism in a patient with chronic myeloid leukaemia. BMJ Case Rep. 2016;2016. doi:10.1136/bcr-2015-214284
- Chang AY, Wang M. Molecular mechanisms of action and potential biomarkers of growth inhibition of dasatinib (BMS-354825) on hepatocellular carcinoma cells. BMC Cancer. 2013;13:267. doi:10.1186/1471-2407-13-267
- Masuda M, Chen WY, Miyanaga A, et al. Alternative mammalian target of rapamycin (mTOR) signal activation in sorafenib-resistant hepatocellular carcinoma cells revealed by array-based pathway profiling. Mol Cell Proteomics. 2014;13(6):1429–1438. doi:10.1074/mcp.M113.033845
- Feng J, Dai W, Mao Y, et al. Simvastatin re-sensitizes hepatocellular carcinoma cells to sorafenib by inhibiting HIF-1alpha/PPAR-gamma/PKM2-mediated glycolysis. J Exp Clin Canc Res. 2020;39(1):24. doi:10.1186/s13046-020-1528-x
- Garcia-Carceles J, Caballero E, Gil C, Martinez A. Kinase inhibitors as underexplored antiviral agents. J Med Chem. 2021. doi:10.1021/acs.jmedchem.1c00302
- Chibon F. Cancer gene expression signatures - the rise and fall? Eur J Cancer. 2013;49(8):2000–2009. doi:10.1016/j.ejca.2013.02.021
- Qian Y, Daza J, Itzel T, et al. Prognostic cancer gene expression signatures: current status and challenges. Cells. 2021;10(3):648. doi:10.3390/cells10030648
- Liu C, Dai Q, Ding Q, Wei M, Kong X. Identification of key genes in hepatitis B associated hepatocellular carcinoma based on WGCNA. Infect Agents Cancer. 2021;16(1):18. doi:10.1186/s13027-021-00357-4
- Liu W, Tu W, Li L, et al. Revisiting connectivity map from a gene co-expression network analysis. Exp Ther Med. 2018;16(2):493–500. doi:10.3892/etm.2018.6275
- Liu W, Li L, Li W. Gene co-expression analysis identifies common modules related to prognosis and drug resistance in cancer cell lines. Int J Cancer. 2014;135(12):2795–2803. doi:10.1002/ijc.28935
- Patil P, Bachant-Winner P-O, Haibe-Kains B, Leek JT. Test set bias affects reproducibility of gene signatures. Bioinformatics. 2015;31(14):2318–2323. doi:10.1093/bioinformatics/btv157
- Denoyer D, Perek N, Le Jeune N, Cornillon J, Dubois F. Correlation between 99mTc-(V)-DMSA uptake and constitutive level of phosphorylated focal adhesion kinase in an in vitro model of cancer cell lines. Eur J Nucl Med Mol I. 2005;32(7):820–827. doi:10.1007/s00259-005-1773-4
- Gibson K, Rindone JP. Experience with statin use in patients with chronic hepatitis C infection. Am J Cardiol. 2005;96(9):1278–1279. doi:10.1016/j.amjcard.2005.06.071
- Zapatero-Belinchon FJ, Otjengerdes R, Sheldon J, et al. Interdependent impact of lipoprotein receptors and lipid-lowering drugs on HCV infectivity. Cells. 2021;10(7):1626. doi:10.3390/cells10071626
- Li M, Wang Q, Lin W, Wang B. Regulation of ovarian cancer cell adhesion and invasion by chloride channels. Int J Gynecol Cancer. 2009;19(4):526–530. doi:10.1111/IGC.0b013e3181a3d6d2
- Li XS, Ren YC, Bao YZ, et al. Synthesis of C3-Neoglycosides of digoxigenin and their anticancer activities. Eur J Med Chem. 2018;145:252–262. doi:10.1016/j.ejmech.2017.12.086
- Kumari S, Badana AK, Mohan GM, Shailender Naik G, Malla R. Synergistic effects of coralyne and paclitaxel on cell migration and proliferation of breast cancer cells lines. Biomed Pharmacother. 2017;91:436–445. doi:10.1016/j.biopha.2017.04.027