
Abstract
Background
There is a surprising paucity of studies investigating the potential mechanism of SKA3 in the progression and prognosis of kidney renal papillary cell carcinoma (KIRP).
Methods
We used TCGA and other databases to analyze the expression, clinical value, and potential mechanisms of SKA3 in KIRP patients. We also explored therapeutic agents for KIRP through GSCALite.
Results
SKA3 mRNA expression was significantly upregulated and the area under the curve was 0.792 (95% CI 0.727–0.856). Increased SKA3 expression was related to shorter overall survival, disease-specific survival and progression-free survival. Hub genes in protein–protein interactions were CDK1, CDC20, CCNB1, CCNA2, BUB1, AURKB, BUB1B, PLK1, CCNB2, and MAD2L1, which were differentially expressed and also associated with KIRP prognosis. Gene-set enrichment analysis indicated that E2F targets, epithelial–mesenchymal transition, glycolysis, the WNT signaling pathway, and other pathways were highly enriched upon SKA3 upregulation. Gene-set variation analysis of SKA3 and its ten hub genes showed that the significant correlation of cancer-related pathways included the cell cycle, DNA damage, hormone androgen receptor, hormone estrogen receptor, PI3K/Akt, and Ras/MAPK. In addition, we found that MEK inhibitors, ie, trametinib, selumetinib, PD0325901, and RDEA119, may be feasible targeting agents for KIRP patients.
Conclusion
SKA3 might contribute to poor prognosis of KIRP through cell cycle, DNA damage, hormone androgen receptor, hormone estrogen receptor, PI3K/Akt, and RAS/MAPK. SKA3 potentially serves as a prognostic biomarker and target for KIRP.
Introduction
Incidence of renal cell carcinoma (RCC) varies widely, with an estimated 431,288 new cases and 179,368 deaths worldwide in 2020.Citation1 Despite improvements in the management of RCC, it remains one of the most fatal urological malignancies.Citation2 Clear-cell carcinoma is the most frequent histological subtype, while kidney renal papillary cell carcinoma (KIRP) accounts for 10%–20%.Citation3 Compared to RCC, the clinical behaviors of KIRP are more changeable in consist with epidemiology. KIRP occurs sporadically, and only around 4% of patients have a hereditary link.Citation4 The clinical manifestations of KIRP and RCC are similar, and radical or partial nephrectomy remains the mainstream treatment for the localized stage, with almost 40% recurrence.Citation3 For some patients at the local advanced stage or metastasis, several agents, including anti-VEGF drugs and mTOR inhibitors, provide limited efficacy.Citation5,Citation6 A considerable number of studies have focused on molecular investigation and clinical trials of RCC, whereas there is a notable paucity of high-quality research on molecular profiling and treatment of KIRP seeking to identify novel targets for precisely individualized therapy.
SKA3 regulates microtubule attachment to kinetochores during mitosis, and may be essential for normal chromosome segregation and cell division.Citation7 Studies have indicated that overexpression of SKA3 is associated with disease progression and prognosis of some malignant tumors.Citation8–Citation11 To date, however, there has been little published information on the role of SKA3 in KIRP. In this study, we sought for the first time to explore the relationship between differential expression of SKA3 and clinical values in KIRP, with insights into potential mechanisms and possible treatments via bioinformatic analysis.
Methods
Data Extraction
We acquired data from the University of California, Santa Cruz Xena database (https://xenabrowser.net/datapages),Citation12 which includes the Cancer Genome Atlas (TCGA) and Genotype–Tissue Expression databases. The data were processed through Toil.Citation13 Prognostic data were obtained from Liu et al.Citation14 Transcripts per million reads were used, and log2 conversion was performed for all data in standardization.
Analysis of Differential Expression and Clinical Values
The data were used to analyze SKA3 mRNA expression in pan-cancer and KIRP. We assessed diagnostic and survival values of SKA3 expression through area under the curve and survival analysis. Overall survival (OS), disease-specific survival (DSS) and progression-free survival (PFS) were used as prognostic factors.
Biological Functional Analysis
Coexpressed genes of SKA3 were identified with Pearson correlation coefficients (R>0.4 and P<0.001). Gene Ontology (GO) and Kyoto Encyclopedia of Genes and Genomes (KEGG) analysis was performed on coexpressed genes with R clusterProfiler to explore possible biological functions and signaling pathways affected by SKA3.Citation15 GO analysis included biological process, cell composition, and molecular function, with P<0.05 taken as statistically significant). TCGA data were analyzed with gene-set enrichment analysis. The threshold for significant enrichment was a false-discovery rate <0.25 and adjusted P<0.05. A protein–protein interaction (PPI) network of SKA3-coexpressed genes was identified through the STRING database (https://www.string-db.org), and high confidence was set as 0.7. The network obtained was imported into Cytoscape 3.7.2,Citation16 and the first ten genes were defined as hub genes using the CytoHubba plug-in and ranked by degree. We further analyzed cancer-related pathways of SKA3 and the ten hub genes through gene-set variation analysis (GSVA) via GSCALite.Citation17
Analysis Using CBioportal and GSCALite
The CBioportal database (www.cbioportal.org)Citation18,Citation19 was used to explore the association between SKA3 mRNA expression (RNA Seq V2 RSEM) and hypoxia-related parameters. We used the GSCALite database to further analyze mutation information, immunoinfiltration of SKA3, and coexpressed genes.Citation17 We also explored the Genomics of Drug Sensitivity in Cancer database and Cancer Therapeutics Response Portal for drug sensitivity and expression correlations of the top ten hub genes coexpressed with SKA3 through GSCALite.Citation17
Statistical Analysis
R 3.6.3 software was used for statistical analysis with the packages ggplot2, pROC, survival, survminer, clusterProfiler, and rms. The chi-square test was used to assess differences between categorical variables and paired or unpaired t-tests used for continuous variables. The Wilcoxon rank-sum test was used if Shapiro–Wilk normality testing yielded significance. Survival was analyzed using Kaplan–Meier curves and log-rank tests. All tests were two-sided. P<0.05 was considered statistically significant
Results
Basic Clinical Features and Values
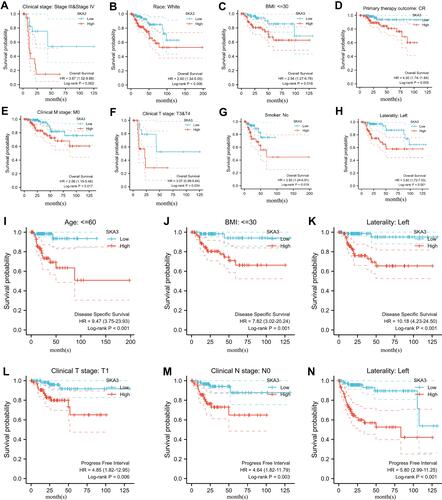
A total of 289 tumor patients in TCGA were enrolled. Median SKA3 expression was used to define the high and low groups. The expression of SKA3 was related to clinical T stage, N stage, M stage, sex, race, and age. presents the relationship of SKA3 expression with basic clinical features. SKA expression was differentially expressed through paired and unpaired analysis of pan-cancer and KIRP level (–). The expression of SKA3 showed an upward trend in stages (). The area under the curve was 0.851 (95% CI 0.796–0.906, ). The top ten positively SKA3-related genes were NUF2, HJURP, CDK1, KIFC1, NCAPG, SKA1, CEP55, TTK, DLGAP5, and NDC80, while negatively SKA3-related genes were LDHD, CKB, OGDHL, MYL3, PHYHD1, ZNF385B, CHCHD10, C3orf18, C16orf86, and RYR2 (). Increased SKA3 expression was significantly related to shorter OS (HR 2.31, 95% CI 1.28–4.18; ), DSS (HR 6.50, 95% CI 3.14–13.64; ) and PFS (HR 3.54, 95% CI 2.10–5.97; ). For advanced-stage (III and IV) patients, Caucasian ethnicity, BMI ≤30, complete remission, M0 stage, T3–T4 stage, no smoking, and left side, higher expression of SKA3 was significantly associated with poorer OS (–). For patients aged <60 years, BMI ≤30, and left side, higher expression of SKA3 was significantly associated with poorer DSS (–). For patients in T1 stage, N0 stage, and left side, higher expression of SKA3 was significantly associated with shorter PFS (–).
Table 1 Relationships between SKA3 expression and clinical features in KIRP patients in TCGA database
Figure 1 Clinical values, coexpressed genes, and expression of SKA3 in KIRP patients. (A) SKA3 expression in unpaired samples in pan-cancer; (B) SKA3 expression in paired samples in pan-cancer; (C) SKA3 expression in unpaired sample in KIRP; (D) SKA3 expression in paired sample in KIRP; (E) SKA3 expression among stages in KIRP; (F) receiver-operating characteristic curve of SKA3 expression in KIRP; (G) heat map of SKA3 and its top ten positively or negatively correlated genes; (H) relationship between SKA3 expression and overall survival in KIRP; (I) relationship between SKA3 expression and disease-specific survival in KIRP; (J) relationship between SKA3 expression and progression-free survivacant mark: nsP≥0.05; *P<<0.05; **P<0.01; ***P<0.001.
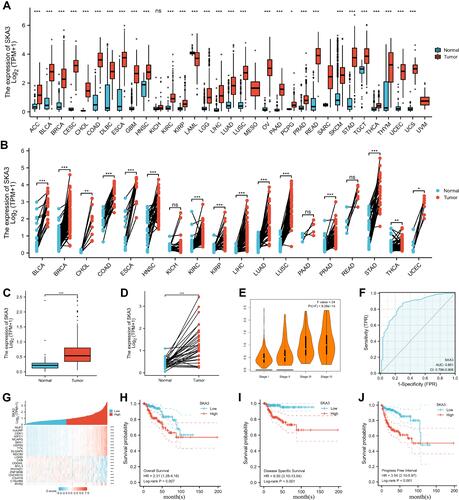
Figure 2 Subgroup analysis of SKA3 expression and survival. (A) Relationship between SKA3 expression and overall survival in stage III and IV; (B) relationship between SKA3 expression and overall survival in white; (C) relationship between SKA3 expression and overall survival in patients with BMI ≤30; (D) relationship between SKA3 expression and overall survival in patients with complete remission (CR); (E) relationship between SKA3 expression and overall survival in patients with stage M0; (F) relationship between SKA3 expression and overall survival in patients with clinical T3–T4; (G) relationship between SKA3 expression and overall survival in nonsmokers; (H) relationship between SKA3 expression and overall survival in left KIRP; (I) relationship between SKA3 expression and disease-specific survival in patients aged ≤60; (J) relationship between SKA3 expression and disease-specific survival in patients with BMI ≤30; (K) relationship between SKA3 expression and disease-specific survival in left KIRP; (L) relationship between SKA3 expression and progression-free survival in patients with T1 stage; (M) relationship between SKA3 expression and progression-free survival in patients with N0 stage; (N) relationship between SKA3 expression and progression-free survival in left KIRP.
Gene Enrichment Analysis
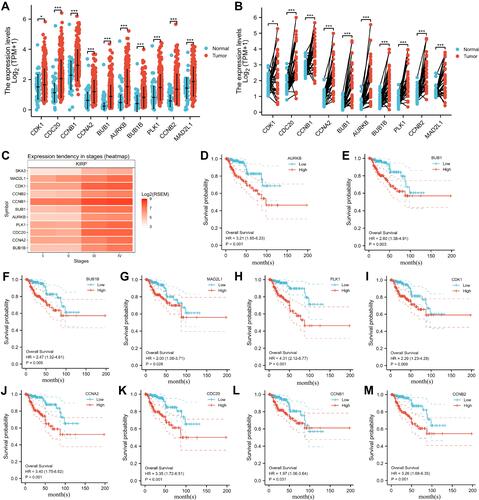
GO and KEGG showed that SKA3 was mainly enriched in the cell cycle, DNA replication, RNA transport, ubiquitin-mediated proteolysis, p53 signaling pathway, organelle fission, nuclear division, chromosome segregation, and chromosomal region ( and ). Gene-set enrichment analysis indicated that highly enriched hallmarks included E2F targets, epithelial–mesenchymal transition, glycolysis, G2M checkpoint, and genes downregulated by KRAS activation upon SKA3 upregulation (). Pathways significantly enriched by SKA3 overexpression included PLK1, FOXM1, and Aurora B signaling, with MET activating PTK2 signaling and cell-cycle checkpoints and promoting cell motility, DNA replication, the Wnt signaling pathway, and GPCR–ligand binding (–). Hub genes in protein–protein interactions were CDK1, CDC20, CCNB1, CCNA2, BUB1, AURKB, BUB1B, PLK1, CCNB2, and MAD2L1 (). GSVA of SKA3 and its ten hub genes showed that the tumor group had higher GSVA scores than the normal group (P<0.001, ). The box plot showed that patients in advanced stages (III and IV) had significantly higher GSVA scores than those in early stages (I and II) in KIRP patients (P=5.73–6, ). Higher GSVA scores were related to greater risk of OS and PFS (). Significantly enriched cancer-related pathways were the cell cycle, DNA damage, hormone androgen receptor, hormone estrogen receptor, PI3K/Akt, and RAS/MAPK (). The ten hub genes were significantly highly expressed in KIRP patients, and their overexpression was significantly associated with poor prognosis ().
Figure 3 Functional enrichment analysis and the top ten hub genes through protein–protein interaction network. (A) Results of Gene Ontology analysis; (B) results of Kyoto Encyclopedia of Genes and Genomes analysis; (C–F) results of gene -set enrichment analysis; (G) top ten hub genes through protein–protein interaction network; (H) box plot comparing GSVA scores of tumor and normal samples in KIRP; (I) box plot comparing GSVA scores among stages in KIRP; (J) survival difference between GSVA-score groups in KIRP; (K) association between GSVA score and activity of cancer-related pathways in KIRP. Significance defined as P≤0.05 and false-discovery rate ≤0.05.
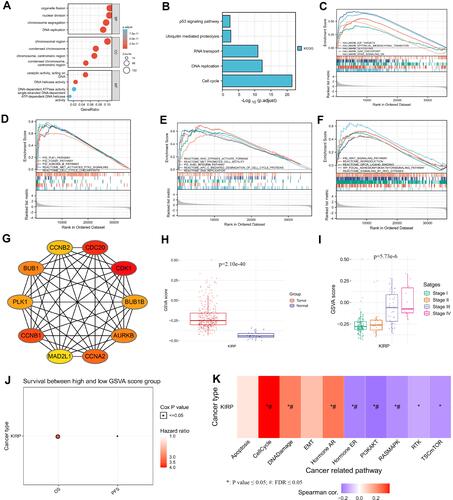
Figure 4 Differential expression of the top ten hub genes and their relationship to prognosis in KIRP patients. (A) Expression in unpaired samples in KIRP; (B) expression in paired samples in KIRP; (C) heat map of gene mRNA-expression profile among stages in KIRP; (D) relationship between AURKB expression and overall survival in KIRP; (E) relationship between BUB1 expression and overall survival in KIRP; (F) relationship between BUB1B expression and overall survival in KIRP; (G) relationship between MAD2L1 expression and overall survival in KIRP; (H) relationship between PLK1 expression and overall survival in KIRP; (I) relationship between CDK1 expression and overall survival in KIRP; (J) relationship between CCNA2 expression and overall survival in KIRP; (K) relationship between CDC20 expression and overall survival in KIRP; (L) relationship between CCNB1 expression and overall survival in KIRP; (M) relationship between CCNB2 expression and overall survival in KIRP. *P<<0.05; ***P<0.001.
Analysis of GSCALite and CBioportal
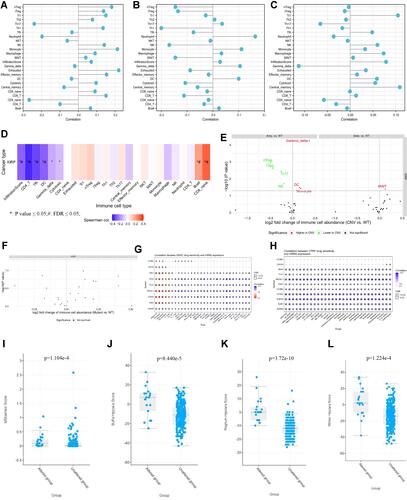
shows genomic alterations of SKA3 and hub genes from three domains: single-nucleotide variation (SNV; –), copy-number variation (CNV; –), and methylation (–). SKA3 showed no effective mutation in KIRP (), and no survival difference was observed between mutants and wild types (). CNV in KIRP patients included heterozygous, homozygous, amplification, and deletion (). No significant correlation was found with regard to heterozygous or homozygous CNV. Correlations of CNV with mRNA expression were significant for SKA3, MAD2L1, and CCNA2 (). In KIRP patients, significant OS and PFS differences were detected between CNV groups and wild groups, except for BUB1 (). Gene-set CNV also had worse prognosis than wild-type in KIRP patients (). There were methylation differences between tumor and normal samples of genes in KIRP (). Hypomethylation of AURKB was associated with worse OS in KIRP (). In addition, we found there were negative correlations between methylation and mRNA expression for SKA3, MAD2L1, CDC20, CCNA2, and AURKB (). In single-gene analysis, we found no associations between mRNA expression, CNV, methylation of SKA3, or immunoinfiltration (–). CD8-naïve and CD8+ T cells were positively correlated with GSVA scores, while infiltration scores, CD4+ T cells, follicular helper T cells, and dendritic cells were negatively related to GSVA scores (). Compared to wild-type samples, dendritic cells, γγ cells, and monocytes were significantly enriched at higher amplification, while Th17, natural killer, nTreg, and iTreg cells were enriched at lower amplification (). There was no significant difference between immunoinfiltration and gene-set SNV group (). With the help of GSCALite,Citation17 we found that MEK inhibitors, ie, trametinib, selumetinib, PD0325901, and RDEA119, may be feasible targeted agents in KIRP patients with high expression of SKA3 and coexpressed genes ( and ). In addition, hypoxia scores (Buffa, Ragnum, and Winter) and MSIsensor score were significantly higher in the SKA3-altered group than in the unaltered group on CBioportal (–).
Figure 5 Genetic altion of SKA3 and coexpressed genes in KIRP patients. (A) SNV of SKA3 and hub genes in KIRP; (B) SNV classes of hub-gene set in KIRP; (C) SNV of top ten mutated genes in gene set in KIRP; (D) transition (Ti) and transversion (Tv) classification of SNV of SKA3 gene set and hub genes in KIRP; (E) survival difference between gene-set mutant and wide type; (F) heterozygous CNV of SKA3 gene set and top ten hub genes in KIRP; (G) pie plot summarizing CNV of SKA3 and top ten hub genes in KIRP; (H) homozygous CNV of SKA3 gene set and top ten hub genes in KIRP; (I) correlation of CNV with mRNA expression of SKA3 and top ten hub genes; (J) differences in survival between CNV and wild type in KIRP; (K) survival among gene-set CNV groups in KIRP; (L) methylation differences among tumor and normal samples of SKA3 and top ten hub genes in KIRP; (M) overall survival differences between high- and lowmethylation groups in KIRP; (N) correlations between methylation and mRNA expression of SKA3 and top ten hub genes in KIRP.
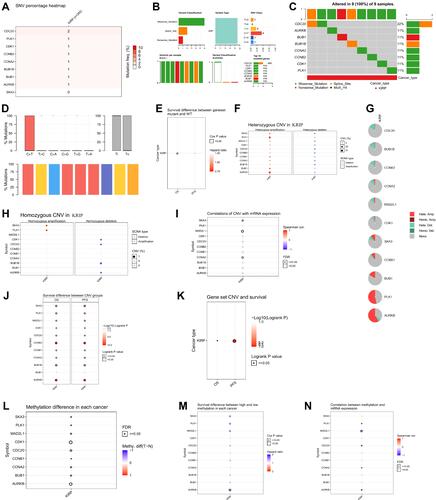
Figure 6 The immunoinfiltration and drug sensitivity of SKA3 and coexpressed genes in KIRP patients and correlation of SKA3 expression and hypoxia-related parameters. (A) association between SKA3 mRNA expression and immunoinfiltration; (B) association between SKA3 CNV and immunoinfiltration; (C) association between SKA3 methylation and immunoinfiltration; (D) associations between SKA3 and top ten hub genes and immunoinfiltration (E) differences in immunoinfiltration between gene-set CNV and wild type (WT); (F) differences in immunoinfiltration among gene-set SNV groups; (G) correlations between gene expression and sensitivity to GDSC drugs (top 30); (H) correlation between gene expression and sensitivity to CTRP drugs (top 30); (I) MSIsensor-score differences of SKA3-altered group and -unaltered group; (J) differences in Buffa hypoxia scores between SKA3-altered group and -unaltered group; (K) differences in Ragnum hypoxia scores between SKA3-altered group and -unaltered group; (L) differences in Winter hypoxia scores between SKA3-altered group and -unaltered group.
Discussion
KIRP has been demonstrated to be a heterogeneous disease in response to genomic alterations and clinical behaviors.Citation20 One study classified KIRP into two types, with type 1 altered in the MET pathway and type 2 related to activation of the NRF2–antioxidant response element pathway.Citation21 However, what is not yet understood is the actual relationship between genome variants and clinical behaviors due to relatively low incidence and lack of solid data. Despite several agents, including mTOR inhibitors and VEGF receptor inhibitors, being possible options in the treatment of advanced and metastatic KIRP, the efficacy is unsatisfactory.Citation5,Citation6 Given this, there is an urgent need to uncover new target for diagnosis, treatment, and prognosis of KIRP.
SKA3 is a component of the SKA1 complex, a microtubule-binding subcomplex of the outer kinetochore that is essential for proper chromosome segregation.Citation22,Citation23 The SKA complex contributes to the stabilization of the kinetochore–microtubule interface through the network of KNL1, Mis12, and Ndc80.Citation23,Citation24 The phosphorylation of SKA3 with CDK1 is essential for kinetochore localization of the SKA complex during mitosis.Citation9,Citation25 SKA3 can also integrate BUB3 via competing BUB1/BUBR1, helping to silence spindle-assembly checkpoint.Citation22,Citation26,Citation27 Both BUB1 and CDK1 were members of the SKA3 hub-gene set, and thus we thought that gene interactions contributed to cell proliferation through regulation of the cell cycle. We also observed enrichment of the p53 signaling pathway upon SKA3 upregulation in KIRP patients. The TP53 gene is well known as a tumor-suppressor gene that plays a pivotal role in regulation of the cell cycle and DNA restoration.Citation28–Citation30 Mutated TP53 can lead to tumorigenesis through regulating downstream target-gene expression or binding with other antioncogenes of its family that are involved in apoptosis and repairing damaged DNA, thus promoting tumor-cell growth.Citation31–Citation34 Studies have shown that CDK2 overexpression is closely associated with the formation and development of tumors.Citation9,Citation35,Citation36 Furthermore, DNA damage can increase p53-protein levels and CDK2 can also phosphorylate p53 and activate downstream signal-transduction pathways.Citation9,Citation37 We also found a positive correlation between SKA3 mRNA expression and TP53 (r=0.370, P<0.001). Therefore, SKA3–CDK2/p53 might be a possible pathway contributing to oncogenesis and progression of KIRP and deserves to be further validated. The other enriched pathways, including PLK1,Citation8,Citation38 Aurora B,Citation39 Wnt signaling,Citation10,Citation40 and PI3K/Akt,Citation11,Citation41,Citation42 have been elucidated in other cancers, but their roles in KIRP warrant further exploration.
A strong relationship between hypoxia and tumors has been reported in other studies.Citation43,Citation44 Hypoxia leads to a series of biological changes that induce tumorigenesis and are associated with resistance to chemotherapy, radiation therapy, drug therapy, and immunotherapy.Citation45 We found that altered SKA3 was positively associated with the namely Buffa, Ragnum, and Winter hypoxia scores. Therefore, identification of hypoxia involving SKA3 carcinogenesis is also needed. We found that MEK inhibitors, ie, trametinib, selumetinib, PD0325901, and RDEA119, may be sensitive in KIRP patients with high expression of SKA3 and coexpressed genes. This discovery needs further verification. Our study did have some limitations: validation using the clinical samples was absent, and further verification of SKA3 function in vitro and in vivo was needed. Further research determining the relationship between SKA3 expression and KIRP type is warranted to help in achieving more precisely personalized treatment.
Conclusion
SKA3 might contribute to poor prognosis of KIRP through the cell cycle, DNA damage, hormone androgen receptor, hormone estrogen receptor, PI3K/Akt, and Ras/MAPK. SKA3 potentially serves as a prognostic biomarker and target for KIRP.
Ethics
Data are from the literature and public databases. As such, approval from the West China Hospital of Sichuan University Biomedical Research Ethics Committee was not required. The authors are accountable for all aspects of the work in ensuring that questions related to the accuracy or integrity of any part of the work are appropriately investigated and resolved.
Acknowledgments
The results shown here are in whole or part based upon data generated by TCGA (https://www.cancer.gov/tcga). Dechao Feng, Facai Zhang, and Ling Liu contributed equally to this work, and should be considered co–first authors. Zhenghua Liu and Lu Yang are co–corresponding authors.
Disclosure
The authors have no conflicts of interest related to this work to declare.
Additional information
Funding
References
- Sung H, Ferlay J, Siegel RL, et al. Global cancer statistics 2020: GLOBOCAN estimates of incidence and mortality worldwide for 36 cancers in 185 countries. CA Cancer J Clin. 2021;71(3):209–249. doi:10.3322/caac.21660
- Capitanio U, Bensalah K, Bex A, et al. Epidemiology of renal cell carcinoma. Eur Urol. 2019;75(1):74–84. doi:10.1016/j.eururo.2018.08.036
- Courthod G, Tucci M, Di Maio M, et al. Papillary renal cell carcinoma: a review of the current therapeutic landscape. Crit Rev Oncol Hematol. 2015;96(1):100–112. doi:10.1016/j.critrevonc.2015.05.008
- Gago-Dominiguez M, Yuan JM, Castelao JE, et al. Family history and risk of renal cell carcinoma. Cancer Epidemiol Biomark Prev. 2011;10:1001–1004.
- Tannir NM, Jonasch E, Albiges L, et al. everolimus versus sunitinib prospective evaluation in metastatic non‐clear cell renal cell carcinoma (ESPN): a randomized multicenter phase 2 trial. Eur Urol. 2016;69(5):866‐874. doi:10.1016/j.eururo.2015.10.049
- Armstrong AJ, Halabi S, Eisen T, et al. Everolimus versus sunitinib for patients with metastatic non‐clear cell renal cell carcinoma (ASPEN): a multicentre, open‐label, randomised phase 2 trial. Lancet Oncol. 2016;17(3):378–388. doi:10.1016/S1470-2045(15)00515-X
- Foley EA, Kapoor TM. Microtubule attachment and spindle assembly checkpoint signalling at the kinetochore. Nat Rev Mol Cell Biol. 2013;14(1):25–37. doi:10.1038/nrm3494
- Gao W, Zhang Y, Luo H, et al. Targeting SKA3 suppresses the proliferation and chemoresistance of laryngeal squamous cell carcinoma via impairing PLK1-AKT axis-mediated glycolysis. Cell Death Dis. 2020;11(10):919. doi:10.1038/s41419-020-03104-6
- Hou Y, Wang Z, Huang S, et al. SKA3 promotes tumor growth by regulating CDK2/P53 phosphorylation in hepatocellular carcinoma. Cell Death Dis. 2019;10(12):929. doi:10.1038/s41419-019-2163-3
- Zhang J, Liu Y, Pu S, et al. Spindle and kinetochore‑associated complex subunit 3 accelerates breast cancer cell proliferation and invasion through the regulation of Akt/Wnt/β-catenin signaling. Breast Cancer Res Treat. 2021;186(1):247–258. doi:10.1007/s10549-020-06078-3
- Hu DD, Chen HL, Lou LM, et al. SKA3 promotes lung adenocarcinoma metastasis through the EGFR-PI3K-Akt axis. Biosci Rep. 2020;40(2):BSR20194335. doi:10.1042/BSR20194335
- Goldman MJ, Craft B, Hastie M, et al. Visualizing and interpreting cancer genomics data via the Xena platform. Nat Biotechnol. 2020;38(6):675–678. doi:10.1038/s41587-020-0546-8
- Vivian J, Rao AA, Nothaft FA, et al. Toil enables reproducible, open source, big biomedical data analyses. Nat Biotechnol. 2017;35(4):314–316. doi:10.1038/nbt.3772
- Liu J, Lichtenberg T, Hoadley KA, et al. An integrated TCGA pan-cancer clinical data resource to drive high-quality survival outcome analytics. Cell. 2018;173(2):400–416.e11.
- Yu G, Wang LG, Han Y, et al. clusterProfiler: an R package for comparing biological themes among gene clusters. Omics. 2012;16(5):284–287. doi:10.1089/omi.2011.0118
- Shannon P, Markiel A, Ozier O, et al. Cytoscape: a software environment for integrated models of biomolecular interaction networks. Genome Res. 2003;13(11):2498–2504. doi:10.1101/gr.1239303
- Liu CJ, Hu FF, Xia MX, et al. GSCALite: a web server for gene set cancer analysis. Bioinformatics. 2018;34(21):3771–3772. doi:10.1093/bioinformatics/bty411
- Cerami E, Gao J, Dogrusoz U, et al. The cBio cancer genomics portal: an open platform for exploring multidimensional cancer genomics data. Cancer Discov. 2012;2(5):401–404. doi:10.1158/2159-8290.CD-12-0095
- Gao J, Aksoy BA, Dogrusoz U, et al. Integrative analysis of complex cancer genomics and clinical profiles using the cBioPortal. Sci Signal. 2013;6(269):pl1. doi:10.1126/scisignal.2004088
- Wang Z, Song Q, Yang Z, et al. Construction of immune-related risk signature for kidney renal papillary cell carcinoma. Cancer Med. 2019;8(1):289–304. doi:10.1002/cam4.1905
- Cancer Genome Atlas Research Network. Comprehensive molecular characterization of papillary renal-cell carcinoma. N Engl J Med. 2016;374(2):135–145. doi:10.1056/NEJMoa1505917
- Welburn JP, Grishchuk EL, Backer CB, et al. The human kinetochore Ska1 complex facilitates microtubule depolymerization-coupled motility. Dev Cell. 2009;16(3):374–385. doi:10.1016/j.devcel.2009.01.011
- Gaitanos TN, Santamaria A, Jeyaprakash AA, et al. Stable kinetochore-microtubule interactions depend on the Ska complex and its new component Ska3/C13Orf3. EMBO J. 2009;28(10):1442–1452. doi:10.1038/emboj.2009.96
- Cheeseman IM, Niessen S, Anderson S, et al. A conserved protein network controls assembly of the outer kinetochore and its ability to sustain tension. Genes Dev. 2004;18(18):2255–2268. doi:10.1101/gad.1234104
- Zhang Q, Sivakumar S, Chen Y, et al. Ska3 phosphorylated by Cdk1 binds Ndc80 and recruits Ska to kinetochores to promote mitotic progression. Curr Biol. 2017;27(10):1477–1484.e4. doi:10.1016/j.cub.2017.03.060
- Theis M, Paszkowski-Rogacz M, Buchholz F. SKAnking with Ska3: essential role of Ska3 in cell division revealed by combined phenotypic profiling. Cell Cycle. 2009;8:3435–3437. doi:10.4161/cc.8.21.9813
- Daum JR, Wren JD, Daniel JJ, et al. Ska3 is required for spindle checkpoint silencing and the maintenance of chromosome cohesion in mitosis. Curr Biol. 2009;19(17):1467–1472. doi:10.1016/j.cub.2009.07.017
- Li T, Kon N, Jiang L, et al. Tumor suppression in the absence of p53-mediated cell-cycle arrest, apoptosis, and senescence. Cell. 2012;149(6):1269–1283. doi:10.1016/j.cell.2012.04.026
- Hager KM, Gu W. Understanding the non-canonical pathways involved in p53-mediated tumor suppression. Carcinogenesis. 2014;35(4):740–746. doi:10.1093/carcin/bgt487
- Bieging KT, Mello SS, Attardi LD. Unravelling mechanisms of p53-mediated tumour suppression. Nat Rev Cancer. 2014;14(5):359–370. doi:10.1038/nrc3711
- Wei CL, Wu Q, Vega VB, et al. A global map of p53 transcription-factor binding sites in the human genome. Cell. 2006;124(1):207–219. doi:10.1016/j.cell.2005.10.043
- Strano S, Fontemaggi G, Costanzo A, et al. Physical interaction with human tumor-derived p53 mutants inhibits p63 activities. J Biol Chem. 2002;277(21):18817–18826. doi:10.1074/jbc.M201405200
- Di Como CJ, Gaiddon C, Prives C. p73 function is inhibited by tumor-derived p53 mutants in mammalian cells. Mol Cell Biol. 1999;19(2):1438–1449. doi:10.1128/MCB.19.2.1438
- Schärer E, Iggo R. Mammalian p53 can function as a transcription factor in yeast. Nucleic Acids Res. 1992;20(7):1539–1545. doi:10.1093/nar/20.7.1539
- Wright RH, Castellano G, Bonet J, et al. CDK2-dependent activation of PARP-1 is required for hormonal gene regulation in breast cancer cells. Genes Dev. 2012;26(17):1972–1983. doi:10.1101/gad.193193.112
- Li KK, Ng IO, Fan ST, et al. Activation of cyclin-dependent kinases CDC2 and CDK2 in hepatocellular carcinoma. Liver. 2002;22(3):259–268. doi:10.1046/j.0106-9543.2002.01629.x
- Price BD, Hughes-Davies L, Park SJ. Cdk2 kinase phosphorylates serine 315 of human p53 in vitro. Oncogene. 1995;11(1):73–80.
- Ruan LW, Li PP, Jin LP. SKA3 promotes cell growth in breast cancer by inhibiting PLK-1 protein degradation. Technol Cancer Res Treat. 2020;19:1533033820947488. doi:10.1177/1533033820947488
- Chan YW, Jeyaprakash AA, Nigg EA, et al. Aurora B controls kinetochore-microtubule attachments by inhibiting Ska complex-KMN network interaction. J Cell Biol. 2012;196(5):563–571. doi:10.1083/jcb.201109001
- Li C, Yang J, Lei S, et al. SKA3 promotes glioblastoma proliferation and invasion by enhancing the activation of Wnt/β-catenin signaling via modulation of the Akt/GSK-3β axis. Brain Res. 2021;1765:147500. doi:10.1016/j.brainres.2021.147500
- Hu R, Wang MQ, Niu WB, et al. SKA3 promotes cell proliferation and migration in cervical cancer by activating the PI3K/Akt signaling pathway. Cancer Cell Int. 2018;18:183. doi:10.1186/s12935-018-0670-4
- Liang Y, Zheng Y, Mou K, et al. Inhibition of spindle and kinetochore associated complex subunit 3 suppresses the proliferation and invasion and induced the apoptosis of cutaneous melanoma by affecting the PI3K/Akt pathway. J Biochem Mol Toxicol. 2021;2021:e22895.
- Zhang Q, Huang R, Hu H, et al. Integrative analysis of hypoxia-associated signature in pan-cancer. iScience. 2020;23(9):101460. doi:10.1016/j.isci.2020.101460
- Bhandari V, Li CH, Bristow RG, et al. Divergent mutational processes distinguish hypoxic and normoxic tumours. Nat Commun. 2020;11(1):737. doi:10.1038/s41467-019-14052-x
- Ye Y, Hu Q, Chen H, et al. Characterization of hypoxia-associated molecular features to aid hypoxia-targeted therapy. Nat Metab. 2019;1(4):431–444. doi:10.1038/s42255-019-0045-8