
Abstract
Objective
To explore the relationship between the plasma total homocysteine (tHcy) levels and slow coronary flow (SCF) measured by mean corrected TIMI frame count (CTFC) in patients with acute myocardial infarction (AMI).
Methods
Ninety-one patients with primary myocardial infarction were enrolled in this study. The quantitative measurement of coronary blood flow was performed using the mean CTFC method. Plasma tHcy levels were determined using enzymatic assay from venous blood samples. Multivariable linear regression models indicated were used to estimate the effect size (β) of plasma tHcy levels on mean CTFC levels.
Results
Compared with patients with the mean CTFC ≤23.61 frames per second (FPS) group, there were increased plasma tHcy levels in patients of the second, third and highest mean CTFC quartiles (P < 0.001). Linear regression models indicated that plasma tHcy levels were positively associated with mean CTFC levels (adjusted-β per SD increase: 1.96, 95% CI 1.20 to 2.73, P < 0.001). Compared to the tHcy ≤12.30 μmol/L group, the third and highest tHcy-quartile groups had higher mean CTFC levels (adjusted-β: 2.52, 95% CI 0.39 to 4.65, P = 0.023; adjusted-β: 5.07, 95% CI 2.98 to 7.16, P < 0.001, respectively; P for trend <0.001). Moreover, this positive relationship was modified by diabetes mellitus (P-value for interaction was 0.046).
Conclusion
We found a positive relationship between plasma tHcy levels and mean CTFC levels in patients with AMI. Moreover, diabetes mellitus played an interactive role in this positive association between the plasma tHcy levels and mean CTFC levels.
Introduction
Slow coronary flow (SCF), a syndrome presenting with chest pain or tightness related to a delay in the progression of contrast injected into the distal coronary vasculature during coronary angiography, was first proposed in 1972.Citation1 Although its pathogenesis is still not fully elucidated, it has been reported that coronary microcirculation dysfunction (CMD) was responsible for the development of SCF phenomenon.Citation1–Citation3
In the setting of acute myocardial infarction (AMI) after primary percutaneous transluminal coronary intervention (PCI), CMD is an indicator of poor long-term clinical prognosis.Citation4 There are multiple founded techniques to assess microvascular injury or dysfunction in the catheterization room.Citation5 Corrected TIMI frame count (CTFC) is an angiographic argument that can re-stratify the risk of patients with post-procedural thrombolysis in myocardial infarction (TIMI) grade III flow and reflect the existence of SCF and CMD.Citation6,Citation7
Homocysteine is a sulfur-containing amino acid that functions as a key intermediate in methionine metabolism and hyperhomocysteinemia (HHcy) is well established risk factor for cardiovascular disease.Citation8 Angiographic findingsCitation9–Citation16 found that patients with SCF had significantly higher plasma total homocysteine (tHcy) levels than those with normal coronary flow and HHcy was strongly correlated with SCF phenomenon in patients without organic coronary stenosis. In addition, HHcy was a potential predictor for SCF prognosis and related to cumulative cardiac events.Citation14 Moreover, Li et alCitation17 observed that increased plasma tHcy levels (≥17.55 μmol/L) were independent negative predictor of spontaneous reperfusion (defined as achievement of TIMI grade III flow in the infarct-related artery (IRA) before primary PCI) in patients with AMI, implying the potential relationship between HHcy with less early IRA patency. However, to our knowledge, there is no detailed study evaluating the relationship between plasma tHcy levels and SCF measured by mean CTFC in patients with AMI. Therefore, the aim of this study was to investigate the relationship between plasma tHcy levels and mean CTFC in patients with AMI.
Methods
Study Population
This single-center study enrolled 91 angiographically identified patients with AMI, admitted to chest pain center at the Second Affiliated Hospital of Nanchang University between July 2019 and December 2020. There were 60 patients with ST-segment elevation myocardial infarction (STEMI), 31 cases with non-ST-segment elevation myocardial infarction (NSTEMI) in our analysis. Patients with diagnosed coronary artery disease, history of myocardial infarction, left ventricular dysfunction (left ventricular ejection fraction <50%), severe heart valve disease, cardiomyopathy, arrhythmia, left ventricular hypertrophy, uncontrolled hypertension, diabetes mellitus, connective tissue disease and liver, kidney, thyroid dysfunction or vitamin intake were excluded from the study. Left ventricular ejection fraction (LVEF) and left ventricle end diastolic diameter (LVEDD) were collected and analyzed independently by a third part. Written approved informed consent was obtained from each participant. All procedures performed in studies involving human participants were in accordance with the ethical standards of the institutional and national research committee and with the 1964 Helsinki declaration and its later amendments or comparable ethical standards. The study was approved by the Ethical Review Committee of the Second Affiliated Hospital of Nanchang University (Number: 2018242).
Coronary Angiography and Corrected TIMI Frame Count
All enrolled patients were accepted urgent coronary angiography and we used iohexol as contrast agent. All angiograms were performed using Standard Judkin’s left and right 6 French diagnostic catheters. Acquisition positions were right anterior oblique 30° for the left anterior descending (LAD) and the left circumflex artery (LCX), and left anterior oblique 50° for the right coronary artery (RCA). The speed of imaging collection was 15 frames per second (FPS). The angiographic analysis was performed retrospectively by an independent core lab using software of iMedical 8.0. Coronary flow rates of these subjects were measured by CTFC according to the means described by Gibson et al.Citation6 In brief, the first frame was considered that where a column of dye extended across the entire width of the origin of the artery, touching both its borders with evidence of antegrade motion of the dye. The last frame was defined as the frame when the dye first entered a certain distal landmark branch of (but did not necessarily fill) each vessel.Citation6 Because the LAD artery TFC is approximately 1.7- times greater than that of the LCX and RCA, the TIMI frame count (TFC) of the LAD was corrected by dividing by 1.7.Citation6 We calculated mean CTFC = (LAD TFC/1.7+LCX TFC+RCA TFC)/3. The subjects with mean CTFC greater than 27 FPS were accepted as having SCF in the present study according to previous reports.Citation18 Furthermore, the risk of nosocomial death was assessed by Grace Score which stratified the risk of AMI patients and accurately predicted the mortality during hospitalization or in the long term.Citation19 The severity of coronary artery lesions was evaluated by the Gensini scoring system according to the narrowing degree and functional significance of each coronary vessel.Citation20
Laboratory Assay
Blood samples were collected utilizing venipuncture after an overnight fast of at least 12 hours. The levels of plasma tHcy were measured by enzymatic cycling assay analysis using a commercially available “Immulite Homocysteine” kit (Product ID: YZB/JI 0163–2013, Hebei aioulu biotechnology company, CHINA). The levels of B-type natriuretic peptide (BNP), hyper-sensitivity cTnI, blood urea nitrogen (BUN), estimated glomerular filtration rate (eGFR); serum creatinine and uric acid, white blood cells, hemoglobin, platelets, plasma albumin, total cholesterol (TC), total triglyceride (TG), low density lipoprotein-cholesterol (LDL-C), high-density lipoprotein-cholesterol (HDL), and non-high-density lipoprotein cholesterol (NHDLC) were measured using automatic clinical analyzers (Beckman Coulter). The estimated glomerular filtration rate (eGFR) was calculated by the equation of Chronic Kidney Disease Epidemiology Collaboration (CKD-EPI).
Statistical Analysis
Continuous variables are presented as the means ± standard deviation (SD) or the median (quartiles), as appropriate, and are compared using the Student’s t-test, one-way analysis or the Mann Whitney U-test, depending on whether the quantitative data were consistent with a normal distribution. Categorical variables were presented as count (percentage), differences between groups were measured by chi-square test.
Linear regression models indicated were used to estimate the effect size (β) of plasma tHcy levels on mean CTFC levels. The crude model was not adjusted for any confounder. The model I was only adjusted for age and sex. The model II was confounder model. The confounder model screened covariates including age, sex, systolic blood pressure (SBP), diastolic blood pressure (DBP), heart rate (HR), current smoking and drinking status, the type of AMI, Killip classification, hypertension, diabetes mellitus, TC, TG, HDL-C, LDL-C, NHDLC, serum uric acid, eGFR, LVEF, Grace risk scores and Gensini coronary lesion scores. We selected these confounders on the basis of their associations with the outcomes of interest more than 10%. We considered the confounder model to be the main model.
Furthermore, the generalized additive model and smooth curve fitting (penalized spline method) was used to visually show the relationship between plasma tHcy levels and mean CTFC levels.
All statistical analyses were performed using the statistical package R (http://www.R-project.org, The R Foundation, version 3.4.3) and the Empower (R; www.empowerstats.com; X&Y Solutions, Inc, Boston, MA, USA). All P-values are two-tailed, and P < 0.05 was considered to be statistically significant.
Results
Patient Characteristics
The present study included 91 AMI patients (age: 65.34 ± 11.12 years, range 38–86 years; male, 75.82%). The clinical characteristics of the study participants were presented grouped by quartiles of mean CTFC. There were no significant differences between the groups in terms of clinical parameters other than the plasma tHcy levels (). Compared with patients with mean CTFC ≤23.61 FPS, there were increased plasma tHcy levels in patients of the second, third and highest mean CTFC quartiles (P < 0.001, ). Furthermore, compared with patients with mean CTFC ≤23.61 FPS, there were increased numbers of slow flow arteries in patients of the third and highest mean CTFC quartiles (P < 0.001, ). However, there were no significant differences between the groups in terms of Gensini score of epicardial coronary artery lesion and Grace score of nosocomial death risk (P > 0.05, ).
Table 1 Clinical Characteristics of Participants Grouped by Quartiles of Mean CTFC
Table 2 The Severity of Coronary Artery Disease Grouped by Quartiles of Mean CTFC
Association Between Plasma tHcy Levels and Mean CTFC Levels
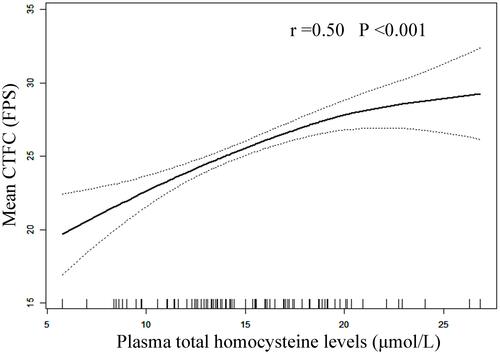
Linear regression models indicated that plasma tHcy levels were positively associated with mean CTFC levels (adjusted-β per SD increase: 1.96, 95% CI 1.20 to 2.73, P < 0.001; ). Compared without HHcy group (Hcy <15 μmol/L), patients with HHcy had higher mean CTFC levels (adjusted-β: 2.89, 95% CI 1.35 to 4.43, P < 0.001; ). Compared to the tHcy ≤12.30 μmol/L group, the third and highest tHcy-quartile groups had higher mean CTFC levels (adjusted-β: 2.52, 95% CI 0.39 to 4.65, P = 0.023; adjusted-β: 5.07, 95% CI 2.98 to 7.16, P < 0.001, respectively; P for trend <0.001; ). The smooth curve fitting further confirmed this positive relationship between plasma tHcy levels and mean CTFC levels ().
Table 3 Relationship Between Plasma tHcy Levels and Mean CTFC Levels in Different Models
Figure 1 Smooth curve of correlation between plasma tHcy levels and mean CTFC levels. Smooth curve and r adjusted for sex, HR, SBP, Killip classification, hypertension, diabetes mellitus and eGFR.
Subgroup Analyses by Potential Effect Modifiers
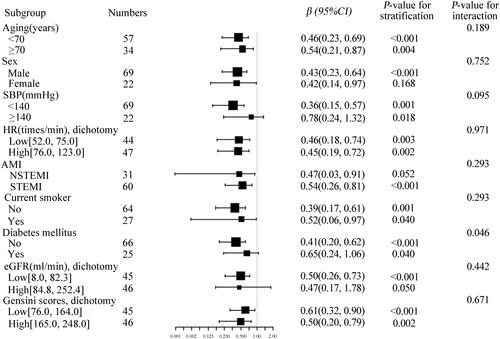
To explore whether this positive correlation between plasma tHcy levels and mean CTFC levels was still stable in different subgroups, we conducted stratified and interaction analyses. We found that this association between plasma tHcy levels and mean CTFC levels was modified by diabetes mellitus (P-value for interaction was 0.046, ). There were not significant interactions in any of the following subgroups, including aging, sex (male vs female), SBP (<140 vs ≥140 mmHg), HR dichotomy (≤75 vs ≥76 times/min), AMI (NSTEMI vs STEMI), current smoker (no vs yes), eGFR dichotomy (≤82.3 vs ≥84.8 mL/min/1.73m^2) and Grace risk scores dichotomy (≤164 vs ≥165) (all P-values for interaction respectively were greater than 0.05, ).
Figure 2 Effect size of plasma tHcy levels on mean CTFC in prespecified and exploratory subgroups. Each stratification adjusted for age, sex, HR, SBP, Killip classification, hypertension, diabetes mellitus and eGFR except the subgroup variable.
Discussion
The present study showed that plasma tHcy levels were significantly positively associated with mean CTFC levels, a metric of reflecting SCF and CMD, in patients with AMI. Moreover, diabetes mellitus played an interactive role in this positive association between the plasma tHcy levels and mean CTFC levels.
The risk factors and pathophysiology for the appearance of SCF are still unclear, and different ethnic populations have different risk factors on account of the different prevalence rates of comorbidities and genetic variation regarding predisposition to SCF. In a study performed by Beltrame et alCitation21 in an Australian population, male sex and smoking were found to be independent risk factors for SCF. In two studies done in North Indian subjects, body mass indexCitation18 or hypertension, dyslipidemia, smoking and tobacco chewing were independently positively associated with SCF phenomenon.Citation22 A study done on Iranian population identified smoking, total cholesterol, hematocrit, fasting blood glucose and red cell distribution to be independent risk factors associated with SCF.Citation23 Demirci et alCitation16 showed that patients with SCF had significantly higher plasma tHcy levels than those with normal coronary flow. Li et alCitation14 found HHcy and mean platelet volume to be independent risk factors for SCF in a Chinese Han population. The coronary microvasculature is the dominant gatekeeper for myocardial blood flow below the visible epicardial arteries. The CMD can lead to angina pectoris which is prolonged or poorly responsive to nitrates and may persist despite successful revascularization, affect ventricular function and remodeling in the long term.Citation24 The evidence suggests that CMD in AMI patients is associated with adverse long-term survival.Citation4
The development of CMD in AMI patients involved multiple pathophysiological processes, especially for endothelial dysfunction (ED).Citation5 Homocysteine is a possibly cytotoxic amino acid synthesized during methionine metabolic cycle. Celermajer et alCitation25 found that HHcy was associated with impaired endothelial function of systemic arteries and decreased nitric oxide bioavailability in hyperhomocystinuria children. Tanriverdi et alCitation13 showed that HHcy impaired endothelial function via oxidative stress in SCF patients. Cheng et alCitation26 found that HHcy impaired endothelium-dependent micro-vasculature relaxation to acetylcholine in mouse small mesenteric artery via oxidation of SKCa/IKCa. Intermediate HHcy potentiated diabetes impaired endothelium-derived hyperpolarizing factor-induced microvasculature relaxation via H2S-downregulation and IKCa tyrosine nitration in T2DM/HHcy mice.Citation27 Otherwise, recent research showed HHcy could cause mitochondrial dysfunction and tissue damage mostly by inhibiting mitochondrial complex I gene expression which leads to impaired etransfer, complex assembly and redox homeostasis dysregulation in human disease and experimental models.Citation28 Therefore, we speculated that HHcy might cause endothelial dysfunction or injury, which further result in CMD and SCF in AMI patients.
Moreover, previous studies have proved that plasma tHcy levels were relevant with coronary slow flow in patients without occlusive coronary arteries.Citation9–Citation15 It’s worth noting that partially differed from that of stable coronary artery disease, microvascular embolism or spasm might play a vital role due to severe thrombus burden on the onset of acute coronary events.
We found diabetes mellitus might play an interactive role in the association between the plasma tHcy levels and mean CTFC levels after adjusted all possible covariates. It is widely recognized that diabetes mellitus was associated with ED and CMDCitation29 in animal modelsCitation27,Citation30,Citation31 and clinical studies.Citation32–Citation36 Verma et alCitation31 showed that diabetic microcirculatory disturbances were provoked by deposition of amyloid-forming amylin in red blood cells (RBC) and micro vasculatures, which thus altering RBC-capillary interaction leading to activation of hypoxia signaling pathways and pathologic erythropoiesis. Di et alCitation32 found that markedly reduced and similar endothelium-dependent and -independent coronary vasodilator function in subjects with both type I and type II diabetes mellitus, by measuring myocardial blood flow measured in a different state using Positron emission tomography imaging. Von et alCitation34 showed that type II diabetic patients had a reduced coronary flow reserve, especially with concomitant albuminuria, suggesting a common microvascular impairment occurring in multiple microvascular beds. But the P-value for interaction was 0.046, belonging to marginal significance. Therefore, more researches with larger sample size is needed to prove this correlation.
In addition to the improvement of pharmacological and interventional therapy, the integrated management of CMD in AMI patients should incorporate lifestyle modification and the control of numerous risk factors, such as tHcy-lowering therapy, hypoglycaemic therapy, and cardiac rehabilitation therapy. Treatment combining drug therapy and cardiac rehabilitation could reduce the plasma levels of high-sensitivity C-reactive protein, homocysteine and arginine, significantly improve the symptoms of SCF phenomenon and increase coronary blood flow velocity.Citation37
Limitations
Our study has some limitations. First, mean CTFC is not that stability because of the difference between physiological status, operator technique, the force of injection and catheter engagement. Second, the angiographic definition of SCF relies on axial contrast angiograms of the vessel lumen. Hence, future studies call for establish a diagnostic criteria for CMD using precise verified techniques, such as coronary flow velocity reserve (CFVR), cardiovascular magnetic resonance myocardial perfusion imaging and Index of microvascular resistance (IMR).Citation7,Citation38,Citation39 Moreover, another restriction is that plasma levels of the folic acid, vitamin B12 and helicobacter pylori infectionCitation40 as well as methylenetetrahydrofolate reductase gene polymorphism were not able to be surveyed to determine the possible disturbance of methionine metabolism.Citation15 Finally, in consideration of the small sample size in our study, further studies with larger samples are needed to confirm our results and to evaluate the effectiveness of homocysteine reducing treatment.
Conclusions
In conclusion, we found a positive relationship between plasma tHcy levels and mean CTFC levels in patients with AMI. HHcy may play an important role in the pathogenesis of SCF in patients with AMI. Moreover, diabetes mellitus played an interactive role in this positive association between the plasma tHcy levels and mean CTFC levels.
Data Sharing Statement
The data used to support the findings of this study are available from the corresponding author on request.
Ethics Approval
Written approved informed consent was obtained from each participant. All procedures performed in studies involving human participants were in accordance with the ethical standards of the institutional and national research committee and with the 1964 Helsinki declaration and its later amendments or comparable ethical standards. The study was approved by the Ethical Review Committee of the Second Affiliated Hospital of Nanchang University (Number: 2018242).
Disclosure
The authors have no conflicts of interest regarding this work or the publication of this paper.
Additional information
Funding
References
- Tambe AA, Demany MA, Zimmerman HA, et al. Angina pectoris and slow flow velocity of dye in coronary arteries – a new angiographic finding. Am Heart J. 1972;84(1):66–71. doi:10.1016/0002-8703(72)90307-9
- Mangieri E, Macchiarelli G, Ciavolella M, et al. Slow coronary flow: clinical and histopathological features in patients with otherwise normal epicardial coronary arteries. Cathet Cardiovasc Diagn. 1996;37(4):375–381. doi:10.1002/(SICI)1097-0304(199604)37:4<375::AID-CCD7>3.0.CO;2-8
- Mosseri M, Yarom R, Gotsman MS, et al. Histologic evidence for small-vessel coronary artery disease in patients with angina pectoris and patent large coronary arteries. Circulation. 1986;74(5):964–972. doi:10.1161/01.CIR.74.5.964
- Papapostolou S, Andrianopoulos N, Duffy SJ, et al. Long-term clinical outcomes of transient and persistent no-reflow following percutaneous coronary intervention (PCI): a multicentre Australian registry. EuroIntervention. 2018;14(2):185–193. doi:10.4244/EIJ-D-17-00269
- Armstrong R, De Maria GL, Scarsini R, et al. Assessing and managing coronary microcirculation dysfunction in acute ST-segment elevation myocardial infarction. Expert Rev Cardiovasc Ther. 2019;17(2):111–126. doi:10.1080/14779072.2019.1561279
- Gibson CM, Cannon CP, Daley WL, et al. TIMI frame count: a quantitative method of assessing coronary artery flow. Circulation. 1996;93(5):879–888. doi:10.1161/01.CIR.93.5.879
- Vijayan S, Barmby DS, Pearson IR, et al. Assessing coronary blood flow physiology in the cardiac catheterisation laboratory. Curr Cardiol Rev. 2017;13(3):232–243. doi:10.2174/1573403X13666170525102618
- Fu Y, Wang X, Kong W. Hyperhomocysteinaemia and vascular injury: advances in mechanisms and drug targets. Br J Pharmacol. 2018;175(8):1173–1189. doi:10.1111/bph.13988
- Riza Erbay A, Turhan H, Yasar AS, et al. Elevated level of plasma homocysteine in patients with slow coronary flow. Int J Cardiol. 2005;102(3):419–423. doi:10.1016/j.ijcard.2004.05.064
- Barutcu I, Sezgin AT, Sezgin N, et al. Elevated plasma homocysteine level in slow coronary flow. Int J Cardiol. 2005;101(1):143–145. doi:10.1016/j.ijcard.2004.01.030
- Yurtdaş M, Özcan IT, Seyis AS, et al. Plasma homocysteine is associated with ischemic findings without organic stenosis in patients with slow coronary flow. J Cardiol. 2013;61(2):138–143. doi:10.1016/j.jjcc.2012.10.001
- Alihanoglu YI, Yildiz BS, Özcan EE, et al. Impaired coronary blood flow may be related to elevated homocysteine levels in patients with metabolic syndrome. Wien Klin Wochenschr. 2015;127(21–22):864–870. doi:10.1007/s00508-015-0854-z
- Tanriverdi H, Evrengul H, Enli Y, et al. Effect of homocysteine-induced oxidative stress on endothelial function in coronary slow-flow. Cardiology. 2007;107(4):313–320. doi:10.1159/000099068
- Li N, Tian L, Ren J, et al. Evaluation of homocysteine in the diagnosis and prognosis of coronary slow flow syndrome. Biomark Med. 2019;13(17):1439–1446. doi:10.2217/bmm-2018-0446
- Tang O, Wu J, Qin F. Relationship between methylenetetrahydrofolate reductase gene polymorphism and the coronary slow flow phenomenon. Coron Artery Dis. 2014;25(8):653–657. doi:10.1097/MCA.0000000000000151
- Demirci E, Çelik O, Kalçık M, et al. Evaluation of homocystein and asymmetric dimethyl arginine levels in patients with coronary slow flow phenomenon. Interv Med Appl Sci. 2019;11:89–94.
- Li J, Zhou Y, Zhang Y, et al. Admission homocysteine is an independent predictor of spontaneous reperfusion and early infarct-related artery patency before primary percutaneous coronary intervention in ST-segment elevation myocardial infarction. BMC Cardiovasc Disord. 2018;18(1):125. doi:10.1186/s12872-018-0868-3
- Mukhopadhyay S, Kumar M, Yusuf J, et al. Risk factors and angiographic profile of coronary slow flow (CSF) phenomenon in North Indian population: an observational study. Indian Heart J. 2018;70(3):405–409. doi:10.1016/j.ihj.2017.09.001
- Fox KA, Anderson FA Jr, Dabbous OH, et al. Intervention in acute coronary syndromes: do patients undergo intervention on the basis of their risk characteristics? The Global Registry of Acute Coronary Events (GRACE). Heart. 2007;93(2):177–182. doi:10.1136/hrt.2005.084830
- Gensini GG. A more meaningful scoring system for determining the severity of coronary heart disease. Am J Cardiol. 1983;51(3):606. doi:10.1016/S0002-9149(83)80105-2
- Beltrame JF, Limaye SB, Horowitz JD. The coronary slow flow phenomenon – a new coronary microvascular disorder. Cardiology. 2002;97(4):197–202. doi:10.1159/000063121
- Sanghvi S, Mathur R, Baroopal A, et al. Clinical, demographic, risk factor and angiographic profile of coronary slow flow phenomenon: a single centre experience. Indian Heart J. 2018;70:S290–294. doi:10.1016/j.ihj.2018.06.001
- Ghaffari S, Tajlil A, Aslanabadi N, et al. Clinical and laboratory predictors of coronary slow flow in coronary angiography. Perfusion. 2017;32(1):13–19. doi:10.1177/0267659116659918
- Herrmann J, Kaski JC, Lerman A. Coronary microvascular dysfunction in the clinical setting: from mystery to reality. Eur Heart J. 2012;33(22):2771b–2782b. doi:10.1093/eurheartj/ehs246
- Celermajer DS, Sorensen K, Ryalls M, et al. Impaired endothelial function occurs in the systemic arteries of children with homozygous homocystinuria but not in their heterozygous parents. J Am Coll Cardiol. 1993;22(3):854–858. doi:10.1016/0735-1097(93)90203-D
- Cheng Z, Jiang X, Kruger WD, et al. Hyperhomocysteinemia impairs endothelium-derived hyperpolarizing factor-mediated vasorelaxation in transgenic cystathionine beta synthase-deficient mice. Blood. 2011;118:1998–2006.
- Cheng Z, Shen X, Jiang X, et al. Hyperhomocysteinemia potentiates diabetes-impaired EDHF-induced vascular relaxation: role of insufficient hydrogen sulfide. Redox Biol. 2018;16:215–225. doi:10.1016/j.redox.2018.02.006
- Cueto R, Zhang L, Shan HM, et al. Identification of homocysteine-suppressive mitochondrial ETC complex genes and tissue expression profile - novel hypothesis establishment. Redox Biol. 2018;17:70–88. doi:10.1016/j.redox.2018.03.015
- Kibel A, Selthofer-Relatic K, Drenjancevic I, et al. Coronary microvascular dysfunction in diabetes mellitus. J Int Med Res. 2017;45(6):1901–1929. doi:10.1177/0300060516675504
- Yang J, Park Y, Zhang H, et al. Feed-forward signaling of TNF-α and NF-κB via IKK-β pathway contributes to insulin resistance and coronary arteriolar dysfunction in type 2 diabetic mice. Am J Physiol Heart Circ Physiol. 2009;296(6):1850–1858. doi:10.1152/ajpheart.01199.2008
- Verma N, Liu M, Ly H, et al. Diabetic microcirculatory disturbances and pathologic erythropoiesis are provoked by deposition of amyloid-forming amylin in red blood cells and capillaries. Kidney Int. 2020;97(1):143–155. doi:10.1016/j.kint.2019.07.028
- Di Carli MF, Janisse J, Grunberger G, et al. Role of chronic hyperglycemia in the pathogenesis of coronary microvascular dysfunction in diabetes. J Am Coll Cardiol. 2003;41(8):1387–1393. doi:10.1016/S0735-1097(03)00166-9
- Woodman RJ, Watts GF, Playford DA, et al. Oxidized LDL and small LDL particle size are independently predictive of a selective defect in microcirculatory endothelial function in type 2 diabetes. Diabetes Obes Metab. 2005;7(5):612–617. doi:10.1111/j.1463-1326.2005.00478.x
- von Scholten BJ, Hasbak P, Christensen TE, et al. Cardiac (82) Rb PET/CT for fast and non-invasive assessment of microvascular function and structure in asymptomatic patients with type 2 diabetes. Diabetologia. 2016;59(2):371–378. doi:10.1007/s00125-015-3799-x
- Nitenberg A, Valensi P, Sachs R, et al. Impairment of coronary vascular reserve and ACh-induced coronary vasodilation in diabetic patients with angiographically normal coronary arteries and normal left ventricular systolic function. Diabetes. 1993;42(7):1017–1025. doi:10.2337/diab.42.7.1017
- Yokoyama I, Momomura S, Ohtake T, et al. Reduced myocardial flow reserve in non-insulin-dependent diabetes mellitus. J Am Coll Cardiol. 1997;30(6):1472–1477. doi:10.1016/S0735-1097(97)00327-6
- He W, Huang Y, Zhang Y, et al. Cardiac rehabilitation therapy for coronary slow flow phenomenon. Herz. 2020;45(5):468–474. doi:10.1007/s00059-018-4742-y
- Löffler AI, Bourque JM. Coronary microvascular dysfunction, microvascular angina, and management. Curr Cardiol Rep. 2016;18(1):1. doi:10.1007/s11886-015-0682-9
- Mittal SR. Diagnosis of coronary microvascular dysfunction - present status. Indian Heart J. 2015;67:552–560.
- Evrengul H, Tanriverdi H, Kuru O, et al. Elevated homocysteine levels in patients with slow coronary flow: relationship with Helicobacter pylori infection. Helicobacter. 2007;12(4):298–305. doi:10.1111/j.1523-5378.2007.00505.x