
Abstract
Background
Stomach adenocarcinoma (STAD) is one of the most prevalent malignances, ranking fifth in incidence and third in mortality among all malignances. Interferon regulatory factors (IRFs) play a vital role in immune response and tumor cellular biological process. The roles of IRFs in STAD are far from being systematically clarified.
Methods
A series of bioinformatics tools, including GEPIA, UALCAN, TIMER, Kaplan–Meier plotter and LinkedOmics, were applied to explore the expression and clinical significance of IRFs in STAD.
Results
IRF3/7 expression were upregulated in STAD in sub-group analyses based on race, gender, age, H. Pylori infection status, histological subtypes, tumor grade, individual cancer stages, and nodal metastasis status. High IRF3/7 expression were associated with poor overall survival (OS), post-progression survival (PFPS) and first progression (FP) in STAD. IRF3 and IRF7 were altered in 5% and 6% of all TCGA STAD patients. Further analysis revealed that IRF7 was significantly associated with the abundance of immune cells (B cells, Neutrophils and Dendritic cells) and the expression of most immune biomarkers. Enrichment analysis indicated that IRF7 was mainly involved in adaptive immune response, NOD-like receptor signaling pathway, Necroptosis, and Toll-like receptor signaling pathway. We also identified several IRF7-associated kinase and miRNA targets in STAD. The result of verified experiment revealed that ITF7 expression was increased in STAD tissues compared with normal tissues and prognosis analysis revealed that STAD patients with high IRF7 expression had a poor overall survival.
Conclusion
IRF7 is upregulated in STAD and associated with poor OS, PPS and FP. Moreover, IRF7 is significantly associated with the abundance of immune cells and the expression of most immune biomarkers, suggesting that IRF7 is as a prognostic biomarker and associated with immune infiltration in STAD.
Introduction
Gastric cancer (GC) is one of the most prevalent malignances, ranking fifth in incidence and third in mortality among all malignances.Citation1 Over 95% of all gastric cancer cases are stomach adenocarcinoma (STAD). In 2018, a total of 1,033,701 patients were estimated to be diagnosed with STAD globally.Citation1 In addition, the molecular mechanism of the occurrence and progression of gastric cancer is still unclear, and the treatment options are limited, resulting in a poor prognosis for GC patients. According to the literature, the overall survival of GC patients with advanced or metastatic disease was only approximately 12 months.Citation2 These alarming evidence indicates that STAD urgently needs new prognostic biomarkers and therapeutic targets.
Interferon regulatory factors (IRFs) family is a series of transcription factors firstly identified in 1988.Citation3 A total of 9 IRF family are presented in mammals (IRF1/2/3/4/5/6/7/8/9).Citation4 The vital role of IRFs in innate and adaptive immunity, and immune response has been well established.Citation5 Moreover, IRFs also play a vital role in cell growth and differentiation as well as apoptosis of many tumor cells.Citation6 For example, IRF-1 inhibits cell growth in breast cancer by inhibiting NF-κB activity and suppressing TRAF2 and cIAP1.Citation7 In gastric cancer, certain studies about the functions of IRFs in STAD have been performed. IRF2 can suppress tumor cell invasion and migration via MMP-1 in STAD.Citation8 However, the prognostic value of IRFs in STAD and their association with immune infiltration are far from systematically clarified.
Thus, we embarked on the current study and aimed to clarify the expression and prognostic value of IRFs in STAD. Moreover, we also detected the association between IRFs and immune infiltration in STAD as well as IRFs-associated functions. The results of our study may provide more information about the role of IRFs in human cancer and the prognostic biomarkers and therapeutic targets for STAD.
Materials and Methods
GEPIA
GEPIA (http://gepia.cancer-pku.cn/) is a bioinformatics tool for analyzing the mRNA data of various types of cancers.Citation9 GEPIA is an online analysis tool for The Cancer Genome Atlas Program (TCGA), which is a landmark cancer genomics program, molecularly characterized over 20,000 primary cancer and matched normal samples spanning 33 cancer types. In our study, data from 375 TCGA STAD patients were used for tumor/normal differential expression analysis of IRFs in GEPIA using ANOVA analysis with 0.05 as the threshold value.
UALCAN
UALCAN (http://ualcan.path.uab.edu/cgi-bin/ualcan-res.pl) is a bioinformatics tool that could visualize the data from TCGA. Prognosis and methylation analysis could be performed in UALCAN.Citation10 In our study, TCGA STAD dataset (n = 375) was used for the correlation analysis (IRFs expression and clinicopathological characters of STAD patients, including patients’ race, patients’ gender, patients’ age, H. Pylori infection status, histological subtypes, tumor grade, individual cancer stages, and nodal metastasis status) with a p-value <0.05 as statistical significance.
The Human Protein Atlas
The Human Protein Atlas (https://www.proteinatlas.org/) is a Swedish-based program designed for mapping all the human proteins in cells, tissues and organs. In the current study, we explored the protein expression of IRFs in gastric tissues and STAD tissues using “Tissue” module and “Pathology” module.
The Kaplan Meier Plotter (KM Plotter)
KM plotter (http://www.kmplot.com/) is a bioinformatics tool used for prognostic analysis of breast cancer, lung cancer, and gastric cancer using the data of TCGA database.Citation11 Kaplan–Meier curve was applied to explore the prognostic value of IRFs in STAD and overall survival (OS), post-progression survival (PPS) and first progression (FP) were performed. It was noteworthy that we distinguished STAD patients into high/low expression group with the medium expression of IRFs and p-value <0.05 indicated statistical significance.
GSCALite
GSCALite (http://bioinfo.life.hust.edu.cn/web/GSCALite/) is a web-based analysis platform for gene set cancer analysis using TCGA data.Citation12 In cancer-related pathway analysis, IRFs expression was divided into High/Low group by median expression, the difference of pathway activity score (PAS) between groups is defined by student T test, p value was adjusted by FDR, FDR < 0.05 is considered as significant. When PAS (IRFs High-group) > PAS (IRFs Low-group), we consider IRFs may have a activate effect to a pathway, otherwise have a inhibit effect to a pathway. In drug sensitivity analysis, the Spearman correlation was performed to detect the correlation between IRFs expression and the drug using the data from from Genomics of Drug Sensitivity in Cancer (GDSC). The positive correlation means that the gene high expression is resistant to the drug, vise verse. These analyses were performed with TCGA STAD dataset (n=375) and a p-value < 0.05 indicates statistical significance.
cBioportal
cBioportal (https://www.cbioportal.org/) is a bioinformatics tool performing cancer genomics analysis with the data from TCGA database.Citation13 In our study, the genetic alteration and mutation of IRFs in STAD was explored with cBioportal using TCGA STAD dataset (n = 375). It is noteworthy that a z score threshold of ±2.0 was set when acquiring mRNA expression z scores (RNA Seq V2 RSEM) and Protein expression z scores (RPPA).
TIMER
TIMER (http://timer.cistrome.org/) is a bioinformatics tool for immune infiltrates analysis using the data of TCGA database.Citation14 In the current study, “Gene” module was allowed to explore the correlation between IRFs expression and the abundance of immune cell using Spearman correlation analysis. Moreover, “SCNA” module provides a comparison of tumor infiltration levels among tumors with different somatic copy number alterations for IRFs using the two-sided Wilcoxon rank-sum test. “Correlation” module was allowed to explore the correlation between IRFs expression and the expression of gene biomarkers of immune cells using Spearman correlation analysis.Citation15–Citation17 These analyses were performed with TCGA STAD dataset (n=375) and a p-value < 0.05 indicates statistical significance.
LinkedOmics
LinkedOmics (http://www.linkedomics.org/) is a publicly available portal, and we can use it for accessing, analyzing and comparing cancer multi-omics data from the TCGA database.Citation18 In the current study, “LinkFinder” module was allowed to detect IRFs-associated genes in STAD using Spearman correlation test, and the results were shown as volcano map and heat map. Moreover, “LinInterpreter” module was allowed to detect IRFs-associated functions (GO analysis and KEGG pathways analysis), IRFs-associated Kinase and miRNA target using Gene Set Enrichment Analysis (GSEA) with 3 as the minimum number of genes. These analyses were performed with TCGA STAD dataset (n = 375) and a p-value <0.05 indicates statistical significance.
Validation of the Expression and Prognosis Value of IRF7 in STAD
Approved by the Ethics Committee of Shengjing Hospital (Ethical Review (2019) No. (18)), a total of 35 STAD and 35 corresponding normal gastric tissues aging from 27 to 76 were obtained from patients who underwent tumor resection in the Shengjing Hospital. All patients provided written informed consent. Our study was performed in accordance with the Declaration of Helsinki. Each patient did not receive any treatment before the operation. The follow-up of STAD patients was conducted by a qualified and experienced doctor. The survival time of STAD patients was from the first postoperative day to the time of death or the end of follow-up.
Total RNA of STAD tissues and normal gastric tissues were extracted with TRIzol reagent (Vazyme, Nanjing, China). The synthesis of cDNAs corresponding to the mRNAs of interest depended on PrimeScript RT-polymerase (Vazyme). SYBR-Green Premix (Vazyme) with specific PCR primers (Sangon Biotech Co., Ltd., Shanghai, China). Glyceraldehyde-3-phosphate dehydrogenase was used as an internal control. The 2−ΔΔCt method was used to calculate fold-changes. Primer sequences were as follows: GAPDH, Forward: GCACCGTCAAGGCTGAGAAC; Reverse: TGGTGAAGACGCCAGTGGA and IRF7 forward: GTAAGGGTTTTTGTCGTAGTAGACGTTAG and IRF7 reverse: AACGTAATAATTCATACCTATAATCCCAAC. The difference between the expression of IRF7 and the prognosis of IRF7 in STAD were evaluated with Student’s paired t‑test and Kaplan–Meier analysis, respectively, in GraphPad Prism7 software (GraphPad, Inc., La Jolla, CA, USA).
Results
The Level of IRFs in STAD
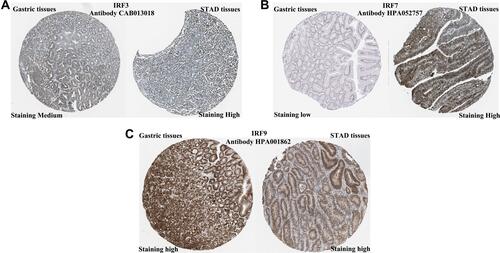
We firstly detected the level of IRFs in STAD in GEPIA using TCGA STAD dataset (n = 375). The results are shown in . We found that the level of IRF3 (, P < 0.05), IRF7 (, P < 0.05) and IRF9 (, P < 0.05) were upregulated in tumor tissues in STAD. In addition, we also noticed that no difference was found between tumor tissues and normal tissues about the level of IRF1 (), IRF2 (), IRF4 (), IRF5 (), IRF6 (), IRF8 () in STAD. In order to further verify the expression of IRF3/7/9, we then detected the protein level of IRF3/7/9 in STAD. As a result, IRF3 was staining medium in gastric tissues, while it was staining high in STAD tissues (). Moreover, IRF7 was staining low in gastric tissues, while it was staining high in STAD tissues (). However, IRF9 was staining high in both gastric and STAD tissues (). These data suggested that the level of IRF3 and IRF7 were upregulated in STAD tissues compared with normal tissues. And IRF3 and IRF7 were selected for further study.
Figure 1 The mRNA level of IRFs in STAD (GEPIA). The expression of IRF1 (A), IRF2 (B), IRF3 (C), IRF4 (D), IRF5 (E), IRF6 (F), IRF7 (G), IRF8 (H) and IRF9 (I) in STAD tissues and normal tissues. *P < 0.05.
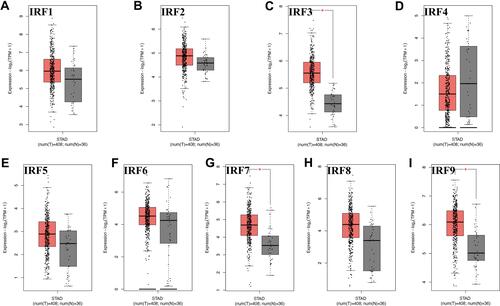
Figure 2 The protein level of IRFs in STAD (The Human Protein Atlas). The protein staining of IRF3 (A), IRF7 (B) and IRF9 (C) were STAD tissues and normal tissues.
IRF3/7 Served as Prognostic Biomarkers in STAD
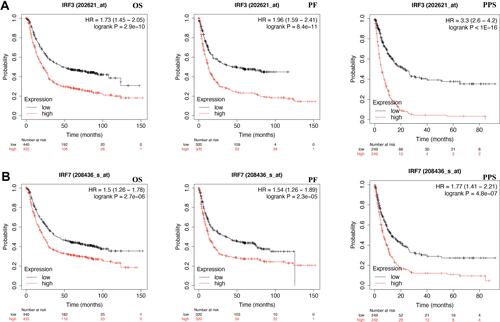
We then detected the prognostic value of IRF3/7 in STAD using KM plotter with TCGA STAD dataset (n = 375). As expected, the data demonstrated STAD patients with high IRF3 expression associated with a poor OS (HR = 1.73 (1.45–2.05), p = 2.9e−10), FP (HR = 1.96 (1.59–2.41), p = 8.4e−11), p = 0.00076), and PPS (HR = 3.3 (2.6–4.2), p < 1e−16) (). Interestingly, the data also demonstrated STAD patients with high IRF7 expression associated with a poor OS (HR = 1.5 (1.26–1.78), p = 2.7e−6), FP (HR = 1.54 (1.26–1.89), p = 2.3e−5), and PPS (HR = 1.77 (1.41–2.21), p = 4.8e−7) (). These data suggested that IRF3/7 served as prognostic biomarkers for STAD.
Figure 3 The prognostic value of IRF3/7 in STAD (KM plotter). (A) STAD patients with high mRNA level of IRF3 had a worse OS, PF and PPS. (B) STAD patients with high mRNA level of IRF7 had a worse OS, PF and PPS. All the analyses were performed with Kaplan-Meier analysis.
Subgroup Analysis on IRF3/7 Expression in STAD
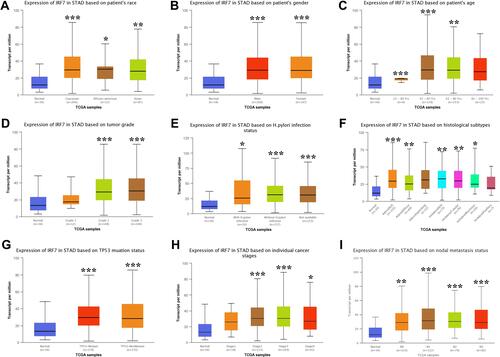
We also detected the expression levels of IRF3/7 in subgroups of STAD patients. As shown in and , the mRNA levels of IRF3 were upregulated in STAD patients compared with healthy control in sub-group analyses based on the race, gender, age, H. pylori infection status, histological subtype, tumor grade, cancer stage, and nodal metastasis status of patients (, all p < 0.05). Moreover, similar results were obtained in the expression analysis of IRF3. And the mRNA levels of IRF3 were upregulated in STAD patients and compared with healthy control in sub-group analyses based on the race, gender, age, H. pylori infection status, histological subtype, tumor grade, cancer stage, and nodal metastasis status of patients (, all p < 0.05). Therefore, IRF3/7 may play a vital role in tumorigenesis, progression, and aggressiveness of STAD.
Figure 4 The expression of IRF3 in STAD in sub-group analyses (UALCAN). Sub-group analyses were performed based on patients’ race (A), patients’ gender (B), patients’ age (C), H. pylori infection status (D), histological subtypes (E), tumor grade (F), TP53 mutation status (G), individual cancer stages (H), and nodal metastasis status (I). *P < 0.05, ***P < 0.001.
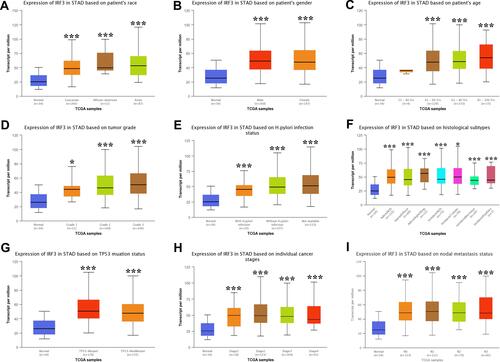
Figure 5 The expression of IRF7 in STAD in sub-group analyses (UALCAN). Sub-group analyses were performed based on patients’ race (A), patients’ gender (B), patients’ age (C), H. pylori infection status (D), histological subtypes (E), tumor grade (F), TP53 mutation status (G), individual cancer stages (H), and nodal metastasis status (I). *P < 0.05, **P < 0.01, ***P < 0.001.
Cancer-Related Pathways and Drug Sensitivity Analysis of IRFs in STAD
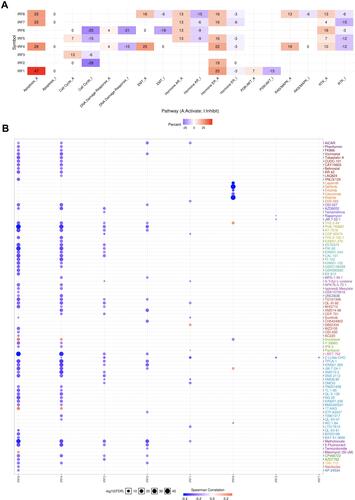
shows the result of IRFs in the famous cancer-related pathways in STAD. IRFs in STAD were mainly associated with activating apoptosis pathway, hormone ER pathway, RAS/MAPK pathway and inhibiting cell cycle pathway and DNA damage response pathway (). Drug resistance is one of main reason of failure treatment of STAD. We then analyzed the correlation between IRFs expression and drug sensitivity in STAD, which revealed that patients with low expression of IRF2/4/6/8 show resistance to most drugs or small molecules of GDSC in STAD ().
Figure 6 The association between IRF7 and the cancer hallmarks (GSCALite). (A) The role of IRF7 in cancer-related pathways. (B) The correlation between IRF7 and drug sensitivity.
Genetic Alteration of IRF3/7 in STAD
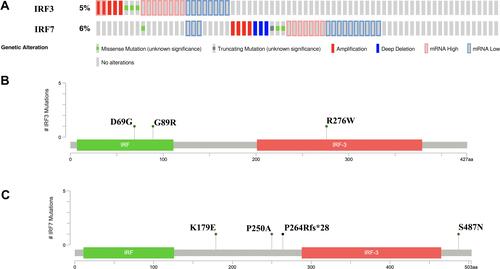
Genetic alteration is an initiating factor in many tumors. cBioportal was applied to determine the genetic alteration of IRF3/7 in STAD. We found that IRF3 and IRF7 were altered in 5% and 6% of all TCGA STAD patients, respectively (). Besides, the genetic alteration of IRF3 and IRF7 in STAD were composed of missense mutation, truncating mutation, amplification, deep deletion, mRNA high, and mRNA low. IRF3 mutation could lead to the change of protein D69G, G89R and R276W (). And IRF7 mutation could lead to the change of protein K179E, P250A and P264Rfs*28 and S487N. ().
Figure 7 Genetic alteration of IRF3/IRF7 in STAD (cBioportal). (A) OncoPrint of IRF7 alterations in STAD. (B and C) mutation sites of IRF7 in STAD.
IRF7 Correlated with Immune Infiltration in STAD
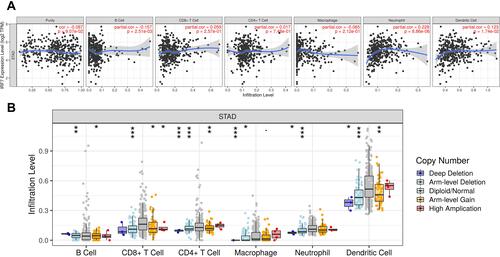
The role of IRF3 has been reported in previous studies.Citation19,Citation20 Therefore, we select IRF7 for further study. Previous studies have revealed that IRFs play a vital function in immune-related functions and pathways.Citation3,Citation21 Thus, the correlation between IRF7 and immune infiltration in STAD was also explored. The data revealed that the expression of IRF7 was negatively correlated with the abundance of B cells (Cor=−0.157, P = 2.51e−3) and positively correlated with the abundance of Neutrophils (Cor = 0.228, P = 8.86e−06) and Dendritic cells (Cor = 0.123, P = 1.74e−2) (). Moreover, SCNA of IRF7 could partially inhibit the immune infiltration in STAD ().
Figure 8 The correlation between IRF7 and immune infiltration (TIMER). (A) The correlation between IRF7 expression the abundance of B cells, CD8+ T cells, CD4+ T cells, Macrophage, Neutrophils and Dendritic cells. (B) the correlation between SCNA of IRF7 and immune cell infiltration. *P < 0.05, **P < 0.01, ***P < 0.001.
Moreover, the correlation between IRF7 expression and the expression of immune biomarkers in STAD was also explored. Interestingly, the expression of IRF7 was positively associated with the expression of most immune biomarkers in STAD (). To be more specific, IRF7 expression showed a positive correlation with the expression of the biomarkers of CD8+ T cell (CD8A and CD8B) and T cell (CD3D, CD3E and CD2). Moreover, the expression of IRF5, CD163, VSIG4 and ITGAM was positively correlated with IRF7 in STAD. All the biomarkers of Dendritic cell (KIR2DL1, KIR2DL3, KIR2DL4, KIR3DL1, KIR3DL2, KIR3DL3, and KIR2DS4), Th1 (TBX21, STAT4, STAT1, IIFNG, and TNF), Th2 (GATA3, STAT6, STAT5A) show positive correlation with IRF7. Similarly, all the biomarker of Tfh (BCL6 and IL21), Th17 (STAT3 and IL17A), Treg cell (FOXP3, CCR8, STAT5B, and TGFB1) and T cell exhaustion (PD-1, CTLA4, LAG3, TIM-3, GZMB) show positive correlation with IRF7. These evidences indicated that IRF7 played a vital role in immune escape in the STAD microenvironment.
Table 1 Correlation Analysis Between IRF7 and Gene Biomarkers of Immune Cells in STAD (TIMER)
Enrichment Analysis of IRF7 in STAD
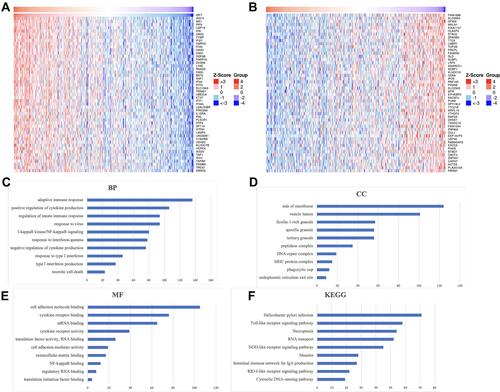
In order to clarify the role of IRF7 in STAD, we further performed an enrichment analysis of IRF7 in STAD using the Function module of LinkedOmics. IRF7-associated gene analysis revealed that a total of 4978 genes (dark red dots) showed a positive correlation with IRF7 and 3659 genes (dark green dots) were negative correlation with IRF7 in STAD (Supplementary Figure 1, p < 0.01). The heat map in and showed the fifty significant gene sets most positively and negatively correlated with IRF7 in STAD, respectively. GSEA was performed, revealing that IRF7 in STAD was mainly enriched in necrotic cell death, negative regulation of cytokine production, I-kappaB kinase/NF-kappaB signaling, adaptive immune response, mRNA binding, cell adhesion molecule binding, regulatory RNA binding and cytokine receptor binding in GO analysis (–). KEGG were also performed, suggesting that IRF7 in STAD was mainly enriched in cytosolic DNA-sensing pathway, RIG-I-like receptor signaling pathway, NOD-like receptor signaling pathway, RNA transport, necroptosis, toll-like receptor signaling pathway and helicobacter pylori infection ().
Figure 9 The enrichment analysis of IRF7 in STAD (LinkedOmics). (A and B) Heat maps showing genes positively and negatively correlated with IRF7 in STAD (TOP 50). Red indicates positively correlated genes and green indicates negatively correlated genes. (C–E) Heatmap of GO enrichment in CC terms, BP terms and MF terms. (F) KEGG pathways analysis. GO and KEGG were performed by Gene Set Enrichment Analysis.
IRF7 Associated Kinase and miRNA Target in STAD
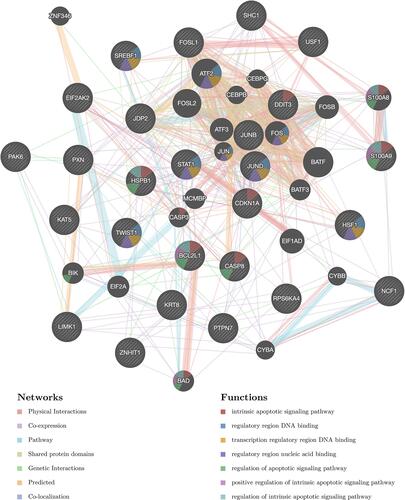
In order to further clarify the molecular mechanism of IRF7 in STAD, IRF7 associated kinase and miRNA target in STAD were also explored. As shown in , the most significant five kinase targets of IRF7 in STAD Kinase_ LCK, Kinase_TBK1, Kinase_MAPK14, Kinase_MAPK8, and Kinase_PIK3CA. PPI network was constructed with GeneMANIA to explore the potential functions in the kinases LCK network, which revealed that kinase LCK network is responsible mainly for antigen receptor-mediated signaling pathway, T cell activation and receptor signaling pathway and regulation of lymphocyte activation (). Moreover, the most significant five miRNA targets of IRF7 in STAD were (CTACTGT)MIR-199A, (ATGAAGG)MIR-205, (ATGTTTC)MIR-494, (GTTTGTT)MIR-495 and (ATATGCA)MIR-448 . PPI network was constructed with GeneMANIA to explore the potential functions in the miR-199A network, which revealed miR-199A network is responsible mainly for apoptosis-associated signaling pathway, regulatory region DNA binding, and regulatory regions of nucleic acid binding ().
Table 2 The Kinase and miRNA-Target Networks of IRF7 in STAD (LinkedOmics)
Figure 10 Protein–protein interaction (PPI) network of LCK kinase-target networks (GeneMANIA). PPI network and functional analysis indicating the gene set that was enriched in the target networks of kinase LCK. Different colors of the network edge indicate the bioinformatics methods applied: co-expression, website prediction, co-localization, shared protein domains, physical interaction, pathway and genetic interactions. The different colors for the network nodes indicate the biological functions of the set of enrichment genes.
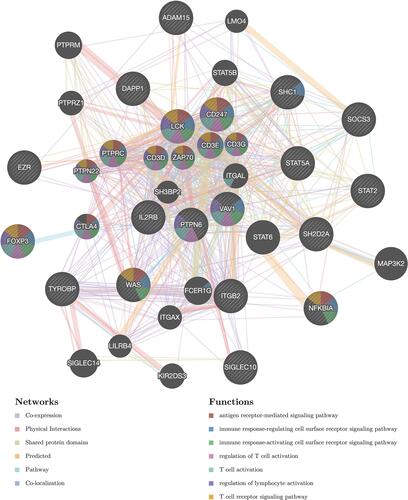
Figure 11 Protein–protein interaction (PPI) network of miR-199A-target networks (GeneMANIA). PPI network and functional analysis indicating the gene set that was enriched in the target networks of miR-199A. Different colors of the network edge indicate the bioinformatics methods applied: co-expression, website prediction, co-localization, shared protein domains, physical interaction, pathway and genetic interactions. The different colors for the network nodes indicate the biological functions of the set of enrichment genes.
Validation of the Expression and Prognostic Value of TLR7 in STAD
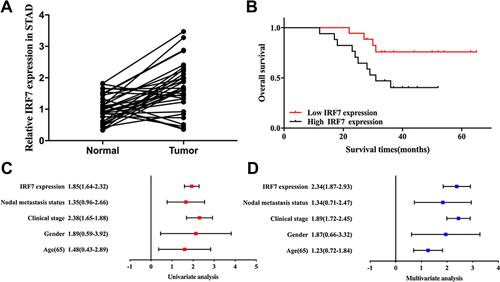
We then verified the expression and prognostic value of IRF7 in STAD. As expected, the result revealed that ITF7 expression was increased in STAD tissues compared with normal tissues (, p<0.001). Moreover, prognosis analysis revealed that STAD patients with high IRF7 expression had a poor overall survival (, p=0.03). Further analysis revealed that IRF7 and clinical stage were factors affecting the prognosis of STAD patients ( and ). These results were further verified by our result.
Figure 12 Validation of the expression and prognostic value of IRF7 in STAD. (A) The relative expression of IRF7 in STAD tissues and normal tissues. (B) The overall survival in STAD patients with high and low expression of IRF7. (C and D) Univariate and multivariate analysis of IRF7 and clinical characters in STAD.
Discussion
Recent studies have highlighted the important role of IRFs in immune response.Citation22 Moreover, IRFs play a vital role in basic cellular mechanisms, such as cell invasion, proliferation and apoptosis.Citation23,Citation24 Increasing evidence indicated that IRFs were associated with tumorigenesis and progression of various types of cancers, including colorectal cancer, hepatocellular carcinoma, and esophageal cancer.Citation25–Citation27 However, the specific role of IRFs in STAD is far from systematically clarified, and our study was performed to study the role of IRFs in STAD.
We first explored the expression of IRFs in STAD, which revealed that the expression of IRF3 and IRF7 were upregulated in STAD tissues at mRNA and protein level. Moreover, prognosis analysis indicated that IRF3 and IRF7 served as prognostic biomarkers in STAD associated with poor prognosis. These results were consistent with previous study. Jiao et al revealed that the expression of IRF3 was up-regulated and prognosticated patient survival.Citation19 IRF3 and IRF7 were also reported to be prognosis biomarkers for other cancers. In the upper tract of urothelial carcinoma, IRFs were independent predictors of prognosis.Citation28 Moreover, IRF2 was suggested as an independent prognostic biomarker predicting overall survival in patients with colorectal cancer.Citation29
Another significant finding of our study is that IRF7 is associated with an abundance of immune cells, including B cells, neutrophil and dendritic cells. And IRF7 showed positive correlation with the expression of most immune biomarkers in STAD. This evidence revealed that IRF7 and other IRFs may play a vital role in immune escape in the STAD microenvironment. Silencing of IRF7 pathways in breast cancer cells could facilitate bone metastasis through immune escape.Citation30 Bidwell et al suggested that IRF7 was the master regulator of type-I interferon-dependent immune responses.Citation30 Moreover, Type I interferon/IRF7 axis instigates chemotherapy-induced immunological dormancy in breast cancer.Citation31
Our study also performed enrichment analysis, indicating that IRF7 was mainly involved in IRF7 in STAD was mainly enriched in necrotic cell death, I-kappaB kinase/NF-kappaB signaling, adaptive immune response, mRNA binding, cell adhesion molecule binding, regulatory RNA binding and cytokine receptor binding, cytosolic DNA-sensing pathway, NOD-like receptor signaling pathway, RNA transport, Necroptosis, Toll-like receptor signaling pathway and Helicobacter pylori infection. Interestingly, NF-kappaB signaling pathway is associated with immune response and plays an important function in cancer initiation and progression.Citation32 Moreover, NOD-like receptor signaling pathway was also found to be involved in the initiation and progression of gastric cancer.Citation33 Necroptosis may generate an immunosuppressive tumor microenvironment and exert an antimetastatic role in cancer.Citation34
Several IRF7-associated kinases target in STAD were also identified, including Kinase_ LCK, Kinase_TBK1, Kinase_MAPK14, Kinase_MAPK8, and Kinase_PIK3CA. Interestingly, these kinases could regulate genomic stability, mitosis, the cell cycle and immune response.Citation35–Citation37 LCK has been suggested as one of the vital molecules regulating T-cell functions, and plays a vital role in cancer cellular functions like proliferation, survival and memory.Citation38 A deficiency in LCK could result in a cell-cycle arrest in G2.Citation39 In STAD, IRF7 may regulate cell cycle progression and immune response via LCK kinase.
Some limitations could be found in our study. First, most analysis was performed at mRNA level but not protein level and gene level. Furthermore, it would be better to validate our results by performing in vivo and in vitro experiments
All in all, IRF7 is upregulated in STAD and associated with poor OS, PPS and FP. Moreover, IRF7 is significantly associated with the abundance of immune cells and the expression of most immune biomarkers, suggesting that IRF7 is as a prognostic biomarker and associated with immune infiltration in STAD. Our study provided additional data on biomarkers for the prognosis and therapy of STAD.
Data Sharing Statement
The analyzed data sets generated during the study are available from the corresponding authors on reasonable requests.
Consent for Publication
Our research was approved and supported by an ethics committee of Shengjing Hospital. All patients provided written informed consent.
Acknowledgments
We acknowledge that the dataset using TCGA database was followed as the requirements: https://www.cancer.gov/about-nci/organization/ccg/research/structural-genomics/tcga/using-tcga/citing-tcga.
Disclosure
The authors declare that they have no competing interests.
Additional information
Funding
References
- Bray F, Ferlay J, Soerjomataram I, Siegel RL, Torre LA, Jemal A. Global cancer statistics 2018: GLOBOCAN estimates of incidence and mortality worldwide for 36 cancers in 185 countries. CA Cancer J Clin. 2018;68:394–424. doi:10.3322/caac.21492
- Digklia A, Wagner AD. Advanced gastric cancer: current treatment landscape and future perspectives. World J Gastroenterol. 2016;22:2403–2414. doi:10.3748/wjg.v22.i8.2403
- Tamura T, Yanai H, Savitsky D, Taniguchi T. The IRF family transcription factors in immunity and oncogenesis. Annu Rev Immunol. 2008;26:535–584. doi:10.1146/annurev.immunol.26.021607.090400
- Alsamman K, El-Masry OS. Interferon regulatory factor 1 inactivation in human cancer. Biosci Rep. 2018;38. doi:10.1042/BSR20171672
- Borden EC, Sen GC, Uze G, et al. Interferons at age 50: past, current and future impact on biomedicine. Nat Rev Drug Discov. 2007;6:975–990. doi:10.1038/nrd2422
- Yan Y, Zheng L, Du Q, Yan B, Geller DA. Interferon regulatory factor 1 (IRF-1) and IRF-2 regulate PD-L1 expression in hepatocellular carcinoma (HCC) cells. Cancer Immunol Immunother. 2020;69:1891–1903. doi:10.1007/s00262-020-02586-9
- Armstrong MJ, Stang MT, Liu Y, Yan J, Pizzoferrato E, Yim JH. IRF-1 inhibits NF-κB activity, suppresses TRAF2 and cIAP1 and induces breast cancer cell specific growth inhibition. Cancer Biol Ther. 2015;16:1029–1041. doi:10.1080/15384047.2015.1046646
- Chen YJ, Liang L, Li J, et al. IRF-2 inhibits gastric cancer invasion and migration by down-regulating MMP-1. Dig Dis Sci. 2020;65:168–177. doi:10.1007/s10620-019-05739-8
- Tang Z, Li C, Kang B, Gao G, Li C, Zhang Z. GEPIA: a web server for cancer and normal gene expression profiling and interactive analyses. Nucleic Acids Res. 2017;45:W98–w102. doi:10.1093/nar/gkx247
- Chandrashekar DS, Bashel B, Balasubramanya SAH, et al. UALCAN: a portal for facilitating tumor subgroup gene expression and survival analyses. Neoplasia (New York, N Y). 2017;19:649–658. doi:10.1016/j.neo.2017.05.002
- Szász AM, Lánczky A, Nagy Á, et al. Cross-validation of survival associated biomarkers in gastric cancer using transcriptomic data of 1065 patients. Oncotarget. 2016;7:49322–49333. doi:10.18632/oncotarget.10337
- Liu C-J, Hu -F-F, Xia M-X, Han L, Zhang Q, Guo A-Y. GSCALite: a web server for gene set cancer analysis. Bioinformatics. 2018;34:3771–3772. doi:10.1093/bioinformatics/bty411
- Gao J, Aksoy BA, Dogrusoz U, et al. Integrative analysis of complex cancer genomics and clinical profiles using the cBioPortal. Sci Signal. 2013;6:pl1. doi:10.1126/scisignal.2004088
- Li T, Fan J, Wang B, et al. TIMER: a web server for comprehensive analysis of tumor-infiltrating immune cells. Cancer Res. 2017;77:e108–e110. doi:10.1158/0008-5472.CAN-17-0307
- Siemers NO, Holloway JL, Chang H, et al. Genome-wide association analysis identifies genetic correlates of immune infiltrates in solid tumors. PLoS One. 2017;12:e0179726. doi:10.1371/journal.pone.0179726
- Danaher P, Warren S, Dennis L, et al. Gene expression markers of tumor infiltrating leukocytes. J Immunother Cancer. 2017;5:18. doi:10.1186/s40425-017-0215-8
- Sousa S, Maatta J. The role of tumour-associated macrophages in bone metastasis. J Bone Oncol. 2016;5:135–138. doi:10.1016/j.jbo.2016.03.004
- Vasaikar SV, Straub P, Wang J, Zhang B. LinkedOmics: analyzing multi-omics data within and across 32 cancer types. Nucleic Acids Res. 2017;46:D956–D963. doi:10.1093/nar/gkx1090
- Jiao S, Guan J, Chen M, et al. Targeting IRF3 as a YAP agonist therapy against gastric cancer. J Exp Med. 2018;215:699–718. doi:10.1084/jem.20171116
- Zhuang H, Dai X, Zhang X, Mao Z, Huang H. Sophoridine suppresses macrophage-mediated immunosuppression through TLR4/IRF3 pathway and subsequently upregulates CD8(+) T cytotoxic function against gastric cancer. Biomed Pharmacother. 2020;121:109636. doi:10.1016/j.biopha.2019.109636
- Honda K, Taniguchi T. IRFs: master regulators of signalling by Toll-like receptors and cytosolic pattern-recognition receptors. Nat Rev Immunol. 2006;6:644–658. doi:10.1038/nri1900
- Battistini A. Interferon regulatory factors in hematopoietic cell differentiation and immune regulation. J Interferon Cytokine Res. 2009;29:765–780. doi:10.1089/jir.2009.0030
- Yi Y, Wu H, Gao Q, et al. Interferon regulatory factor (IRF)-1 and IRF-2 are associated with prognosis and tumor invasion in HCC. Ann Surg Oncol. 2013;20:267–276. doi:10.1245/s10434-012-2487-z
- Velloso FJ, Trombetta-Lima M, Anschau V, Sogayar MC, Correa RG. NOD-like receptors: major players (and targets) in the interface between innate immunity and cancer. Biosci Rep. 2019;39. doi:10.1042/BSR20181709
- Hong M, Zhang Z, Chen Q, et al. IRF1 inhibits the proliferation and metastasis of colorectal cancer by suppressing the RAS-RAC1 pathway. Cancer Manag Res. 2019;11:369–378. doi:10.2147/CMAR.S186236
- Yu M, Xue H, Wang Y, et al. miR-345 inhibits tumor metastasis and EMT by targeting IRF1-mediated mTOR/STAT3/AKT pathway in hepatocellular carcinoma. Int J Oncol. 2017;50:975–983. doi:10.3892/ijo.2017.3852
- Zhang M, Zhang L, Cui M, et al. miR-302b inhibits cancer-related inflammation by targeting ERBB4, IRF2 and CXCR4 in esophageal cancer. Oncotarget. 2017;8:49053–49063. doi:10.18632/oncotarget.17041
- Wang LA, Yang B, Rao W, Xiao H, Wang D, Jiang J. The correlation of BER protein, IRF3 with CD8+ T cell and their prognostic significance in upper tract urothelial carcinoma. Onco Targets Ther. 2019;12:7725–7735. doi:10.2147/OTT.S222422
- Mei Z, Wang G, Liang Z, et al. Prognostic value of IRF-2 expression in colorectal cancer. Oncotarget. 2017;8:38969–38977. doi:10.18632/oncotarget.17163
- Bidwell BN, Slaney CY, Withana NP, et al. Silencing of Irf7 pathways in breast cancer cells promotes bone metastasis through immune escape. Nat Med. 2012;18:1224–1231. doi:10.1038/nm.2830
- Lan Q, Peyvandi S, Duffey N, et al. Type I interferon/IRF7 axis instigates chemotherapy-induced immunological dormancy in breast cancer. Oncogene. 2019;38:2814–2829. doi:10.1038/s41388-018-0624-2
- Hoesel B, Schmid JA. The complexity of NF-κB signaling in inflammation and cancer. Mol Cancer. 2013;12:86. doi:10.1186/1476-4598-12-86
- Castaño-Rodríguez N, Kaakoush NO, Goh KL, Fock KM, Mitchell HM. The NOD-like receptor signalling pathway in Helicobacter pylori infection and related gastric cancer: a case-control study and gene expression analyses. PLoS One. 2014;9:e98899. doi:10.1371/journal.pone.0098899
- Gong Y, Fan Z, Luo G, et al. The role of necroptosis in cancer biology and therapy. Mol Cancer. 2019;18:100. doi:10.1186/s12943-019-1029-8
- Liang F, Liang H, Li Z, Huang P. JAK3 is a potential biomarker and associated with immune infiltration in kidney renal clear cell carcinoma. Int Immunopharmacol. 2020;86:106706. doi:10.1016/j.intimp.2020.106706
- Zhou L, Li Y, Li Z, Huang Q. Mining therapeutic and prognostic significance of STATs in renal cell carcinoma with bioinformatics analysis. Genomics. 2020;112(6):4100–4114. doi:10.1016/j.ygeno.2020.06.032
- Lin Y, Liang R, Qiu Y, et al. Expression and gene regulation network of RBM8A in hepatocellular carcinoma based on data mining. Aging (Albany NY). 2019;11:423–447. doi:10.18632/aging.101749
- Bommhardt U, Schraven B, Simeoni L. Beyond TCR signaling: emerging functions of Lck in cancer and immunotherapy. Int J Mol Sci. 2019;20(14):3500. doi:10.3390/ijms20143500
- al-Ramadi BK, Zhang H, Bothwell AL. Cell-cycle arrest and apoptosis hypersusceptibility as a consequence of Lck deficiency in nontransformed T lymphocytes. Proc Natl Acad Sci U S A. 1998;95:12498–12503. doi:10.1073/pnas.95.21.12498