
Abstract
Background
Thyroid cancer is the most common endocrine malignancy. However, the molecular mechanism involved in its pathogenesis is not well characterized.
Purpose
The objective of this study is to identify key cellular pathways and differentially expressed genes along the thyroid cancer pathogenesis sequence as well as to identify potential prognostic and therapeutic targets.
Methods
Publicly available transcriptomics data comprising a total of 95 samples consisting of 41 normal, 28 non-aggressive and 26 metastatic papillary thyroid carcinoma (PTC) cases were used. Transcriptomics data were normalized and filtered identifying 9394 differentially expressed genes. The genes identified were subjected to pathway analysis using absGSEA identifying PTC related pathways. Three of the genes identified were validated on 508 thyroid cancer biopsies using RNAseq and TNMplot.
Results
Pathway analysis revealed a total of 2193 differential pathways among non-aggressive samples and 1969 among metastatic samples compared to normal tissue. Pathways for non-aggressive PTC include calcium and potassium ion transport, hormone signaling, protein tyrosine phosphatase activity and protein tyrosine kinase activity. Metastatic pathways include growth, apoptosis, activation of MAPK and regulation of serine threonine kinase activity. Genes for non-aggressive are KCNQ1, CACNA1D, KCNN4, BCL2, and PTK2B and metastatic PTC are EGFR, PTK2B, KCNN4 and BCL2. Three of the genes identified were validated using clinical biopsies showing significant overexpression in aggressive compared to non-aggressive PTC; EGFR (p < 0.05), KCNN4 (p < 0.001) and PTK2B (p < 0.001). DrugBank database search identified several FDA approved drug targets including anti-EGFR Vandetanib used to treat thyroid cancer in addition to others that may prove useful in treating PTC.
Conclusion
Transcriptomics analysis identified putative prognostic targets including EGFR, PTK2B, BCL2, KCNQ1, KCNN4 and CACNA1D. EGFR, PTK2B and KCN44 were validated using thyroid cancer clinical biopsies. The drug search identified FDA approved drugs including Vandetanib in addition to others that may prove useful in treating the disease.
Introduction
Thyroid cancer was ranked as the most common endocrine malignancy.Citation1 Globally, thyroid cancer incidence has been on the rise over the past three decades. Between 2006 and 2012, the annual incidence rate was 6.5% in women and 5.4 in men.Citation2,Citation3 In the United States between 2000 and 2009, thyroid cancer incidence rate was the highest among all cancers.Citation4 The mortality rate of thyroid cancer is considered to be low, whilst the reoccurrence and persistence of the disease is still considered high.Citation5
Morphologically, thyroid cancers are classified into different cellular subtypes such as papillary, follicular, medullary and anaplastic. Differentiated papillary thyroid carcinoma (PTC) form is the most common type comprising more than 80% of all thyroid cases as shown in . Genetic mutations have been associated with PTC.Citation6
Table 1 List of Subtypes of Thyroid Carcinoma and the Current Treatment Provided
Whilst many genomic mutational screening studies were carried out on thyroid cancer in general and PTC in particular, only few have identified mutated genes that are correlated with progression of PTC including TP53 and KRAS/BRAFCitation7. However, although such studies suggested that thyroid cancer has high degree of intra-tumoral heterogeneity,Citation8 the mutations identified did not provide clear insights into the molecular mechanism of thyroid cancer phenotypes and progression. Thus, for better clinical outcomes, there is a compelling need to actively study alterations in cellular pathways linked to the underlying mechanism of thyroid cancer initiation and progression.
Few transcriptomic analyses were carried out on PTC identifying some of the cellular pathways involved in its pathogenesisCitation9. However, such studies were generally carried out on small number of patients using standard bioinformatics analysis focusing on list of differentially expressed genes. This provided limited insights into the molecular basis of PTC without clear association to diagnostic, prognostic and therapeutic targets.
In this study, we carried out comprehensive and systematic in silico pathway analysis of PTC using in-house bioinformatics pipeline that has shown good ability to identify the transcriptomic profiles and related differentially expressed genes between different subtypes of the same disease.Citation10 The aim of this study is to attempt to identify the key transcriptomic signatures that drive non-aggressive and metastatic PTC as well as using such signature to identify putative drug targets for PTC. Such approach can provide insights into some of the molecular mechanisms involved in PTC progression and facilitate the identification of key prognostic and therapeutic targets that might help provide better ways for patient management of PTC.
Methods
Publicly Available Data Sets for Papillary Thyroid Carcinoma
Discovery Set
In order to identify the cellular pathways and differentially expressed genes related to papillary thyroid carcinoma, PTC gene sets were searched and retrieved from gene expression omnibus (GEO). Datasets inclusive of patient’s matched normal thyroid tissue transcriptome were considered for analysis. In order to eliminate platform bias, the gene sets obtained were from the Affymetrix Human Genome U133 Plus 2.0 Array platform. Three gene sets that met such criteria were downloaded. Those were GSE6004, GSE60542, and GSE3678 (). In total 95 cases were identified and the raw CEL files corresponding to these gene sets were extracted and further processed for Gene Set Enrichment Analysis (GSEA).
Table 2 List of Gene Sets Included in the Study
Validation Set
In order to validate the pathways and genes identified from the discovery set, an independent validation set was constructed from 3 independent gene sets from different populations; Ukraine GSE35570 with 51 normal and 32 thyroid cancer tissue biopsies, Brazil GSE50901 with 4 matched normal thyroid and tumor samples and 57 unmatched thyroid tumor biopsies and South Korea GSE129562 with 8 matched normal and thyroid tumor samples (). The analysis for this study was approved by the Research Ethics Committee of University Hospital Sharjah (UHS); the ethical approval number of the study is UHS-HERC- 011-10062019.
Raw Microarray Normalization and Adaptive Filtering
Each Affymetrix microarray consists of > 54,000 probes. The raw CEL files for the 95 PTC patients obtained from the GEO for normal, non-aggressive and metastatic thyroid samples were normalized using in house R script as described previously.Citation10 Briefly, Affymetrix microarray suite 5 (MAS5) and Gene Chip Robust Multiarray Averaging (GCRMA) packages in R software were applied to normalize and remove the background noise. The invariant probes were removed from the transcripts list, and non-specific filtering was performed to obtain the common set of variant probes. Adaptive filtering was carried out using R script. Probes with MAS5 value >50 and coefficient of variation (CV) 10–100% in GCRMA across all cases were generated and intersected to obtain probes with common variant probes set. The filtered probes from all the samples were then mapped to gene list using Broad Institute software (http://software.broadinstitute.org/gsea/downloads.jsp).Citation11 The probes with maximum expression for each gene were chosen as the expression value for the gene. Probes corresponding to housekeeping genes or not assigned to any gene were excluded.
Pathway Analysis Using Gene Set Enrichment Analysis
The mapped gene expression list was subjected to Gene set enrichment analysis (GSEA) to identify the activated and enriched cellular pathways in non-aggressive (NAG) and metastatic papillary thyroid carcinoma (PTC) samples in comparison to normal tissue. Absolute GSEA search was carried out on the expression data using around 20,500 annotated cellular pathways obtained across seven well annotated gene sets C1 to C7 obtained from the Broad Institute’s database (https://www.gsea-msigdb.org). The significantly activated pathways in different types of PTC samples were selected based on p < 0.05 and FDR < 0.25 as previously described.Citation10,Citation12 The selected pathways were further processed to identify differentially enriched genes between the normal versus non-aggressive and normal versus metastatic PTC cases. This was followed by reducing the set of available genes by identifying the frequency of gene occurrence across differentially activated cellular pathways.
Differential Gene Expression in PTC Samples Compared to Normal Thyroid Tissue
The differential gene expression analysis was carried out using two approaches in order to obtain information based on pathway enrichment as well as microarray gene expression. Firstly, the significantly enriched pathways for each sample set were used to obtain genes occurring frequently across all the enriched pathways using R script as described previously.Citation10 Using statistical analysis, the 95-percentile cut-off was calculated for each sample. Secondly, the differentially expressed genes in both non-aggressive and metastatic samples were obtained by calculating the average expression value across each sample set for each gene and a fold change value based on normal tissue expression was determined. Genes with fold change >1.5 were considered as upregulated and fold change <0.5 as downregulated.
In vitro Validation of the Pathways and Genes Identified by GSEA in Independent Cohort
Metascape Analysis
In order to validate the pathways identified by GSEA, the most frequent genes from non-aggressive and metastatic samples were considered. The commonly occurring genes with high frequency amongst both groups were inputted in the Metascape software (https://metascape.org/)Citation13 to identify significantly activated cellular pathways.
Drug Bank Database Search
The genes differentially expressed and enriched with high frequency in GSEA in NAG and metastatic PTC were used to search in drug bank database to identify the potential drug targets for papillary thyroid carcinoma. Pharmacoinformatics search using the differentially expressed genes identified as targets to search for matching drug using DrugBank repositoryCitation14 was carried out. Among these, the approved drugs used to treat thyroid cancer were sorted and novel drug targets were listed for the ones not prescribed.
In order to determine the putative therapeutic targets based on different populations, the most upregulated unique genes from each population were used to search DrugBank for associated drugs.
In vivo Validation from Early and Late Thyroid Cancer Tissue Biopsies
Sample Details
Six well characterized United Arab Emirates (UAE) patients biopsies from early and late thyroid cancer were recruited for the study (). The formalin fixed paraffin embedded (FFPE) tissue biopsies from those cases were subjected to microdissection to enrich the tumour content followed by RNA extraction using modified Recover All protocol as previously described.Citation10 The transcriptomic analysis for this study was approved by the Research Ethics Committee of University Hospital Sharjah (UHS); the ethical approval number of the study is UHS-HERC- 011-10062019.
Table 3 Patient Characteristics for the Six Biopsies Collected from Thyroid Cancer Patients in UAE
RNA Sequencing
Next Generation Sequencing (NGS) RNAseq was applied to the RNA extracted from the microdissected FFPE thyroid samples using AmpliSeq Whole Transcriptome on S5 System (ThermoFisher) as previously described.Citation15 Briefly, the targeted RNA-seq library was prepared using Ion AmpliSeq Transcriptome Human Gene Expression Kit (Thermo Fisher Scientific) which is designed to profile over 21,000 distinct human RNA targets. The prepared template libraries were then sequenced on the Ion S5 XL Semiconductor sequencer using the Ion 540 Chip (Life Technologies Corporation, Carlsbad, CA).
Bioinformatic Analysis
RNAseq data were analyzed using the Ion Torrent Software Suite version 5.4. Alignment was carried out using the Torrent Mapping Alignment Program (TMAP) optimized for Ion Torrent sequencing data for aligning the raw sequencing reads against reference sequence derived from hg19 (GRCh37) assembly. Differential gene expression (DGE) analysis was performed using R/Bioconductor package DESeq2Citation30 with raw read counts from RNA-seq data. Read count genes with less than ten normalized read counts were excluded from further analysis. Differentially expressed genes were selected at significance of p<0.05.
Cross Validation of the Molecular Targets on Large Cohort of Cases
Additional validation for the differentially expressed genes from in silico analysis was performed on a larger independent cohort for thyroid cancer RNA-seq data obtained from The Cancer Genome Atlas Program (TCGA). The cohort comprises of 502 non-metastatic thyroid tumor samples, 8 metastatic cases and 58 normal thyroid tissue. The analysis was carried out using TNM plotter (https://tnmplot.com/analysis/)Citation16 and Kruskal–Wallis test was used for statistical comparison. p<0.05 was considered to be statistically significant.
Results
Normalization and Filtration of the Transcriptome Data for Papillary Thyroid Carcinoma
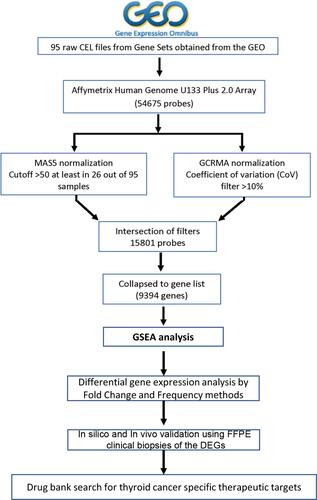
The flow chart for the process of normalization and filtration is shown in . From the total number of 54,675 probes in the Affymetrix Human Genome U133 Plus 2.0 Array, following MAS5 and GCRMA filter 15,801 probes were extracted. These filtered probes were mapped to 9394 genes in GSEA as described in the methods section.
Figure 1 Flow chart of transcriptomics data normalisation and gene set enrichment analysis
Gene Set Enrichment Analysis Identifies the Activated Cellular Pathways in Non-Aggressive and Metastatic PTC Compared to Normal Tissue
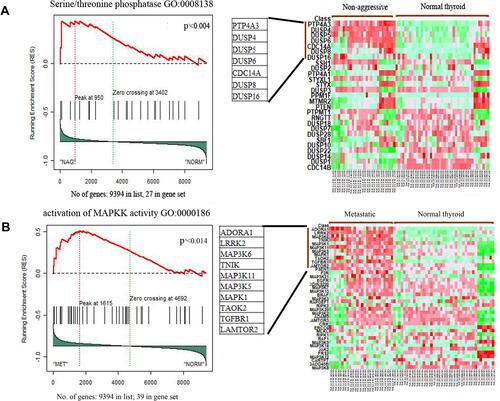
The three groups; normal, non-aggressive and metastatic papillary thyroid cancer samples were processed using absolute GSEA. The differentially activated significant pathways across the three different samples were identified by comparing the cancer samples with normal tissue. Significantly differentially activated pathways were obtained based on p < 0.05 as well as false discovery rate (FDR) < 0.05 cutoffs. The results identified around 1795 significantly differentially activated pathways from the molecular functions and biological processes ontology gene sets (). The most significantly enriched pathways include transforming growth factor beta receptor binding, phosphatase regulator activity, protein tyrosine phosphatase activity, protein kinase activity and calcium dependent protein kinase activity in normal versus non-aggressive set (). The complete list of pathways enriched can be seen in Supplementary Material.
Table 4 List of Number of Significant Pathways Enriched in Non-Aggressive and Metastatic PTC Compared to Normal Thyroid Tissue in Absolute GSEA
Table 5 List of the Pathways Activated in Non-Aggressive Samples in Comparison to Normal Thyroid Tissue Analyzed by GSEA
Amongst the normal versus metastatic set, negative regulation of peptide hormone secretion, insulin like growth factor receptor signaling pathway, activation of MAPK activity, regulation of MAPK cascade, regulation of protein serine threonine kinase activity, and transmembrane receptor protein tyrosine kinase signaling pathway were among the significantly enriched pathways (). Example representation of the output from the gene set analysis for each data set is shown in .
Table 6 List of the Pathways Activated in Metastatic Samples in Comparison to Normal Thyroid Tissue Analyzed by GSEA
Figure 2 Representation of heatmaps and graphs for GSEA for significant pathways with enrichment scores. (A) The result file for normal and non-aggressive dataset is presented here with graph for enrichment score. (B) Graphical representation for the GSEA for normal versus metastatic data
Genes Differentially Expressed Among Non-Aggressive and Metastatic PTC in Comparison to Normal Thyroid Tissue
The enriched pathways from GSEA were subjected to gene frequency cutoff using the 95-percentile as a cut-off. Gene frequency can be defined as the number of times a gene occurs across all the enriched gene component from the significantly activated cellular pathways. This type of analysis showed the value for the frequency for non-aggressive (NAG) to be 13 and metastatic (MET) to be 10. Based on those frequency cutoff values, the number of genes with frequency higher than the cutoff in NAG was 355 and in MET was 280. The top 40 genes based on frequency cutoff were shown in and
Table 7 List of the Top 40 Genes Based on Frequency in Normal versus NAG Set
Table 8 List of the Top 40 Genes Based on Frequency in Normal versus MET Set
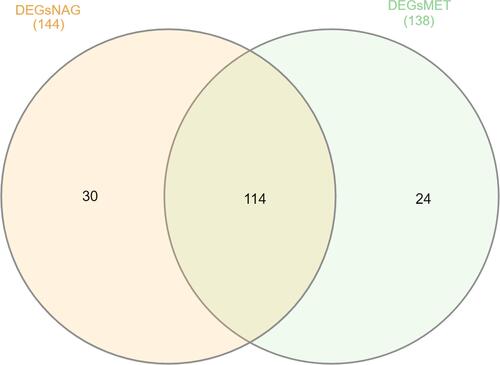
Based on fold change method, 144 genes upregulated in non-aggressive samples 27 genes down regulated. Among metastatic PTC 138 genes were upregulated and 20 genes down regulated (Supplementary Material). The intersection of genes upregulated between both the NAG and MET samples were determined using InteractiVennCitation17 (http://www.interactivenn.net). Around 114 genes were seen commonly upregulated in both the sets. The genes unique to NAG set were 30 and for MET was 24 (). The list of commonly upregulated genes in both the sets given in .
Table 9 List of the 114 Genes Commonly Upregulated in Both the Types of PTC
Figure 3 Intersection of DEGs among non-aggressive and metastatic set compared to normal samples
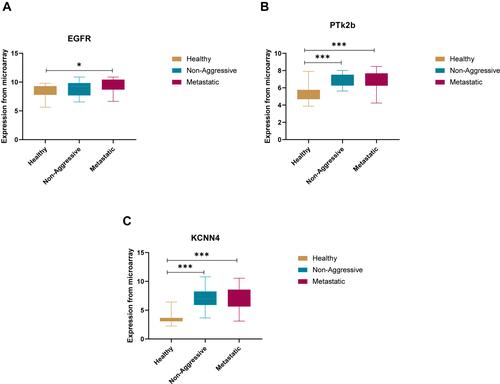
The fold change in expression for the most frequent genes were retrieved from the microarray data and plotted to compare the differential expression pattern among NAG (n=28), MET (n=26) patients’ samples in comparison to healthy thyroid tissue (n=41). Three genes showed significant differential expression between healthy and thyroid cancer; EGFR (p < 0.05), PTK2B (p < 0.001), KCNN4 (p < 0.001). The 3 genes showed significantly higher expression in NAG and MET samples compared to healthy thyroid tissue ().
Figure 4 Box plots for log fold expression from microarray data for the three differentially expressed genes identified from in silico analysis between healthy, non-aggressive and metastatic groups. (A) differential expression of EGFR, (B) differential expression of PTK2B and (C) differential expression of KCNN4. *p < 0.05, ***p < 0.01
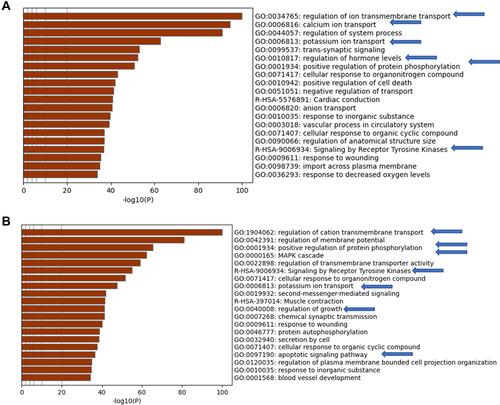
In silico Validation of GSEA Using Metascape Analysis
The most frequently present genes across the enriched pathways identified using the absolute GSEA were used to validate the significantly activated cellular pathways between non-aggressive and metastatic samples in comparison to normal samples. The validation was carried out using Metascape relying on large and well annotated cellular pathways derived from gene ontology.Citation18,Citation19 The analysis showed that calcium ion transport, positive regulation of protein phosphorylation and signaling by receptor tyrosine kinase were enriched in non-aggressive PTC (). In the metastatic PTC, significantly activated pathways included positive regulation of protein phosphorylation, MAPK cascade, apoptotic and growth signaling pathways (). Interestingly, although the MAPK pathway activation was present in both NAG and metastatic thyroid the data showed that MAPK pathway came up 3 times in the metastatic set.
Figure 5 Metascape analysis for the high frequent genes from (A) normal versus non-aggressive set and (B) normal versus metastatic set
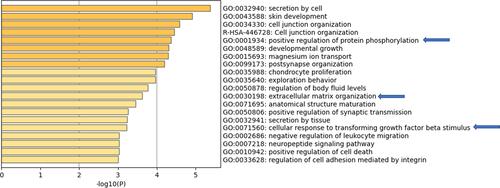
Similarly, when the commonly upregulated genes were input in Metascape, positive regulation of protein phosphorylation, extracellular matrix organization and cellular response to transforming growth factor beta stimulus pathways were identified ().
Figure 6 Metascape for DEGs commonly upregulated in both non-aggressive and metastatic PTC
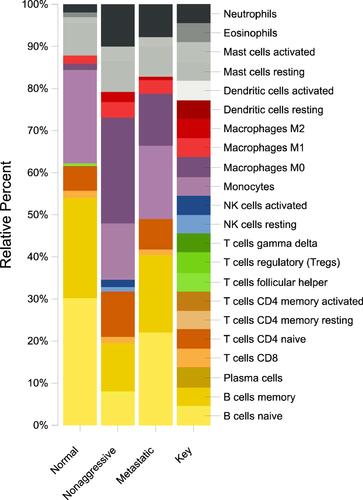
Analysis of the immune component using the enriched genes from both the NAG and metastatic PTC revealed that NAG has less inflammatory component than the metastatic PTC as shown by imbalance in the M1/M2 ratio as well as the decrease in the NK fraction in the metastatic compared to the non-aggressive PTC. In addition, increase in memory:naïve B-cell ratio was observed in NAG set ().
Figure 7 Immune cells enriched in non-aggressive and metastatic PTC in comparison to normal thyroid tissue
DEGs and Enriched Pathways of Thyroid Cancer Across Different Populations
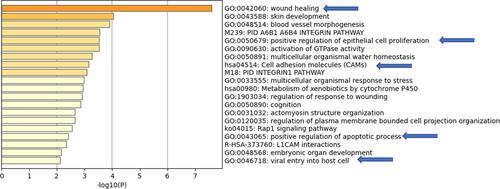
Differentially expressed genes from the microarray data available from other populations such as Ukraine, Brazil and South Korea were analyzed and the top genes upregulated in thyroid cancer in each population were subjected to pathway analysis using Metascape. The results identified unique set of pathways activated for each population. However, key pathways known to be affected in thyroid cancer such as PI3 kinase, MAP kinase and tyrosine metabolism were identified across the various populations (–) indicating that MAPK pathway is probably commonly activated in thyroid cancer across different population cohort. Interestingly, the study identified response to steroid hormone and hormone metabolism activated more in the Ukrainian patients whereas response to inorganic substance and small molecule metabolism was detected in Brazilian thyroid cancer patients. In case of South Korean patients, viral entry and wound healing pathways were observed.
Figure 8 Pathway analysis using Metascape on Ukrainian thyroid cancer samples
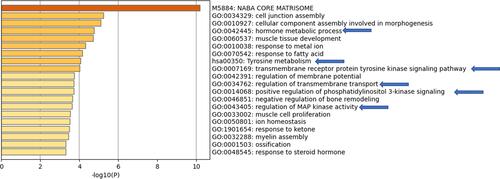
Figure 9 Pathway analysis using Metascape on Brazilian thyroid cancer samples
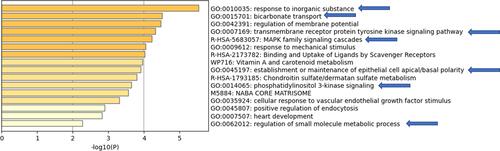
Figure 10 Pathway analysis using Metascape on South Korean thyroid cancer samples
Drugs Associated with Genes Identified from Bioinformatics Analysis
The pharmacoinformatics search using the differentially enriched genes to search the DrugBank database identified many FDA approved drug targets that are currently used in treating metastatic thyroid cancer. Most of those drugs targeted EGFR and vascular EGFR (). In addition, the search also identified other drugs that target molecules linked to thyroid cancer () some of which might be useful as target for pre-clinical trials to treat thyroid cancer pending future studies.
Table 10 List of Drugs Approved by FDA to Treat Thyroid Cancer
Table 11 List of Drugs Related to Other Genes Possibly Involved in Thyroid Cancer
Drugs targeting the genes specific for population were also searched. Only the population of Ukraine and Brazil showed drugs targeting the genes CRABP1 and MAPK4 respectively ().
Table 12 List of Drugs Targeting the Genes Highly Upregulated in Population Specific Set
In vivo Validation of DEGs Using NGS
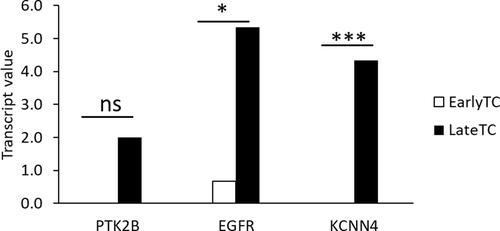
The 3 genes identified from in silico analysis; EGFR, PTK2B and KCNN4 were validated on a cohort of 6 well characterized thyroid carcinoma tissue biopsies collected from patients in the UAE. RNA seq data analyzed for the expression of the genes identified from in silico analysis revealed a significantly higher transcript value for the genes KCNN4 (p < 0.001) and EGFR (p < 0.05) in late PTC samples in comparison to early thyroid cancer samples. PTK2B showed relatively higher expression trend in late PTC samples compared to early ().
Figure 11 Differential gene expression in six tissue biopsies from thyroid cancer patients from UAE. *p < 0.05, ***p < 0.01
In vivo Validation of DEGs Using TNM Plot
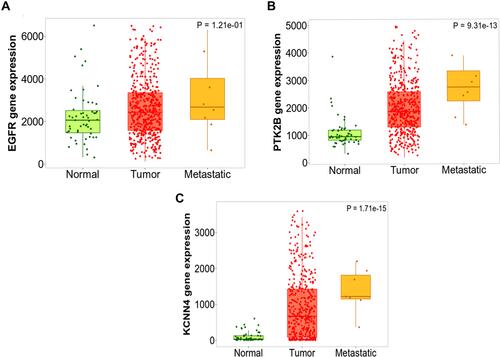
The expression values for the three genes identified from in silico analysis; EGFR, KCNN4 and PTK2B was examined using an independent larger cohort of RNAseq data from 502 thyroid cancer. The data showed that in this cohort the three genes had higher expression in tumour compared to normal thyroid samples with EGFR (p < 0.01), KCNN4 (p < 0.0001) and PTK2B (p < 0.0001). Thus, the expression fold change confirmed the results from both the microarray and the tissue biopsy for the expression of the EGFR, PTK2B and KCNN4 genes ().
Figure 12 TNM Plot output of the three differentially expressed genes identified from in silico analysis on large independent cohort of 58 normal and 502 non-aggressive and 8 metastatic thyroid cancer cases. (A) differential expression of EGFR, (B) differential expression of PTK2B and (C) differential expression of KCNN4
Discussion
This study identified cellular pathways unique to non-aggressive and metastatic PTC as well as common between the two different entities. Interestingly, many of the genes and pathways overlapped between the two clinical groups, these include calcium and potassium ion transport and tyrosine kinase and protein phosphatase pathways. The NAG group showed more unique association with regulation of hormone levels and cell signaling related to hormone whereas the study identified more impact of MAPK activation as well as activation of other cancer hallmark pathways such as regulation of apoptosis and growth in the metastatic pathways.
Validating the data using pathway analysis from the differential expressed genes across different populations showed that MAPK is active in diverse populations including that from Ukraine (Europe), Brazil (South America) and South Korea (Asia). However, each population had set of unique cellular pathways activated. Ukrainian patients had more pathways linked to response to hormones and hormone metabolic processes. Brazilian patients had pathways linked to environmental triggers including response to inorganic substances and vitamin A metabolism suggesting the perhaps pollutionCitation20 and poor dietCitation21 may have partially contributed to PTC cases. The South Korean patients seem to have more cancer hallmark pathways activated such as apoptosis and growth in addition to possibly pro-inflammatory pathway activation as shown by the activation of viral entry into the cell pathway suggesting that there might be additional genetic components within that population leading to chronic inflammatory response which when not treated immediately might lead to PTC. Overall, pathway analysis indicated that PTC is highly complex disease with high level intra-tumoral heterogeneity as shown by the activation of different cellular pathways across different populations but with a commonly activated pathway such as the MAPK related pathways. This difference in activated pathways might be reflected by the diverse genetics between the different population. For example, Brazilian population have shown prevalence to inherited TP53 mutation which can lead to tumours in multiple tissue types as characterised by Li-Fraumeni patients.Citation22 Also the Brazilian population show prevalence to mutations in BRCA1 and BRCA2 which are DNA repair genes.Citation23 Ukrainian population show more prevalence to a different DNA repair gene; RAD51.Citation24 However, the South Korean population seem to have prevalence of deletion mutations in Sialic Acid Binding Ig Like Lectin 14 (SIGLEC14)Citation25 which is linked to inflammasome activation in macrophage.Citation26 Thus, the different mutations in the different populations may have role in shaping the transcriptomics profile in those populations. In addition, GSEA of the pathways identified unique upregulated genes for each of the population; CRABP1 for Ukrainian population, MAPK4 for Brazil and LAMB3 for South Korea. DrugBank search using those genes identified retinoid receptors for CRABP1 such as Tretinoin and Alitretinoin which are used for eczema, Fostamatinib for MAPK4 which is used for chronic immune thrombocytopenia. Taken together, the transcriptomic analysis indicated the possibility of repurposing different drugs in different populations for thyroid cancer treatment.
The immune response analysis suggested an imbalance in the tumour immune microenvironment as it showed that NAG has more inflammatory component than metastatic thyroid. This is partly demonstrated by the fact that NAG has both resting and activated NK fraction and higher memory:naïve B-cell ratio whereas metastatic cancer did not show the NK fraction suggesting that the disease stage has passed the inflammatory stage to the cancer stage. This is supported by the fact that other studies showed that in PTC, NK cell infiltration is in early stages of PTC is higher compared to the metastatic stages.Citation27 Additionally, the immune analysis showed an imbalance in the M1/M2 ratio in both the the NAG and MET types of PTC with slightly higher ratio in the metastatic stage indicating that in this cohort might have different mechanism of PTC pathogenesis warranting further studies of the genes involved in the M1 and M2 polarization in thyroid cancer as done in previous studies.Citation28
The study identified the following targets linked to PTC initiation and progression: BCL2, CACNA1D, KCNQ1, KCNN4, EGFR and PTK2B.
B cell Lymphoma-2 (BCL2) is anti-apoptotic protein responsible for inhibiting programmed cell death or apoptosis.Citation29 Aksoy et al found that lower BCL2 expression in thyroid cancer supports the formation of oncocytic neoplasms in early thyroid cancer stages by inhibiting apoptosis of tumor cells.Citation30 This finding from this study supports the results obtained in our study where the frequency of BCL2 overexpression is present in both the NAG and metastatic groups. In addition, few studies have shown that BCL2 is likely to be involved in early PTC as few studies have shown that BCL2 expression decreases in microcarcinomas of PTCCitation30 which indicates that it is probably not a reliable prognostic marker since it is probably involved in very early PTC and continues in the metastatic phase. However, its related drugs such as NavitoclaxCitation31 might be useful in treating some forms of PTC.
One of the recurrent activated pathways identified from this study is related to ion transport and more specifically calcium and potassium transport. Many genes related to calcium and potassium transport were identified. CACNA1D gene is responsible for regulating positively charged calcium channels (CaV1.3) across cell membranes and specifically adrenal gland to form alpha-1 subunit. These subunits act as pores to calcium ions to flow through. It is also involved in the regulation of adrenal hormones production such as aldosterone which maintains blood pressure and fluid balance in the body.Citation32,Citation33 Somatic mutations of CACNA1D is associated with tumorigenesis such as in adrenal aldosterone-producing adenomas.Citation33 Interestingly, it has been shown that cancer cells can undergo oncogenic switch by transforming apoptosis inducing Ca influx pathway to proliferative calcium influx which in turn can promote growth and apoptosis resistance in cancerous cells.Citation34 This was also confirmed by the fact that pathway analysis showed the activation of calcium ion transport pathways in both NAG and metastatic PTC. The results from this study, showed that CACNA1D is more frequently overexpressed in the NAG and metastatic PTC compared to healthy suggesting that it is probably involved in PTC progression. In addition, the results indicates that although drugs that targets CACNA1D such as IsradipineCitation35 are used to treat hypertension by regulating the calcium transport, they may help in treating some of the thyroid cancer patients.
Another gene implicated is the KCNQ1 gene which belongs to family genes responsible for potassium channels formation. Channels formed by KCNQ1 genes are located in the inner ear, cardiac muscles, kidney, liver, intestine and stomach. Voltage gated K+ channels (Kv1.3) were identified as novel tumor markersCitation36 Somatic mutations of KCNQ1 and specifically KCNA3 promoter’s methylation contributes to gene silencingCitation37 and dysregulation of potassium ion transport which in turn causes several disease such as cardiovascular diseases, sudden infant death syndrome and cancers.Citation38–Citation41 The results showed that KCNQ1 was the top most frequently present gene across the significantly activated cellular pathways in NAG PTC. However, it remains to be seen whether the drugs that targets KCNQ1 such as Promethazine and Enflurane which are sedative drugs () might be worth considered for thyroid cancer pending future studies.
Another gene identified from this study that is implicated in thyroid cancer is Potassium Calcium-Activated Channel Subfamily N Member 4 (KCNN4), a known oncogene, very recently was reported to be upregulated in PTC and was proposed as a diagnostic and prognostic marker for PTC.Citation42 Apart from thyroid cancer, differential expression of KCNN4 in various cancers was indicated either in poor prognosis, drug resistance and/or poor survival.Citation43–Citation45 In the present study, KCNN4 was occurring in both the datasets with high frequency and showed approximately 2 fold change in expression. Hence, potassium calcium activated channels can be targeted to control the progression of PTC to metastatic phase. Interestingly, the results of the RNAseq from the clinical biopsies of both the NGS as well as the TNMplot carried out in this study showed that KCNN4 is significantly overexpressed in metastatic and non-aggressive compared to normal PTC (p < 0.001).
The results also found Epidermal Growth Factor Receptor (EGFR) to be associated with thyroid cancer. EGFR is known to mediate cell proliferation and survival signaling pathways. The transmembrane tyrosine kinase receptor is expressed in different subtypes of cancers such as thyroid carcinoma, glioblastoma and lung cancer.Citation46 EGFR signaling pathways are altered in human cancers due to somatic mutation, gene amplification and protein overexpression which are associated with aggressiveness of the disease and poor survival.Citation47 In this study, EGFR is the most frequently differentially expressed gene in metastatic PTC and also present halfway in the non-aggressive set suggesting that EGFR play a key role in PTC progression and metastasis. Interestingly, search for Thyroid cancer treating drugs identified many FDA approved drugs that targets EGFR including Cabozantinib-S-Malate and Vandetanib.Citation48–Citation60 The results of the RNAseq of the clinical biopsies carried out in this study showed that EGFR is significantly overexpressed in metastatic and non-aggressive compared to normal PTC (p < 0.05).
Another protein identified is Protein tyrosine kinase 2 beta (PTK2B). This has many functions including regulator of cell growth, survival, proliferation and invasion.Citation61 It encodes a cytoplasmic protein tyrosine kinase that is involved in calcium-induced regulation of ion channels and activation of the MAP kinase signaling pathway. Methylated PTK2B favouring overexpression is linked to c-Src activation, development of Pyk2/c-Src complex and the activation of ERK/MAPK signaling pathway. Activation of ERK/MAPK signaling pathway is responsible for regulating the activation of more than 160 downstream signaling transcription factors affecting cancer progressionCitation62. The results of the RNAseq from the clinical biopsies of both the NGS as well as the TNMplot carried out in this study showed that PTK2B is significantly overexpressed in metastatic and non-aggressive compared to normal PTC (p < 0.001). Since it is involved in calcium ion regulation and MAPK activation, the drugs which target PTK2B include GenisteinCitation63,Citation64 (used to treat calcium deficiency), LeflunomideCitation65–Citation70 (used to treat rheumatoid Arthritis) and FostamatinibCitation71–Citation83 (used to treat chronic immune thrombocytopenia). Few studies have shown some links between EGFR and PTK2B. Notably, a recent report indicated that overexpression of EGFR and focal adhesion kinases (FAKs) correlated with PTC progression more specifically in aggressive clinicopathological condition and lymph node metastasisCitation84. PTK2B is one of the FAKs, also known to be associated with lymph nodes, tumor size and pathologic state in thyroid cancer samples.Citation85 Moreover, a combinatorial drug Crizotinib (receptor tyrosine kinase targeting drug) was proven effective in reducing tumor size of triple negative breast cancer graft when used along with erlotinib (EGFR targeting drug).Citation86 PTK2B is also one of the targets for the drug Crizotinib.Citation87 The current study also indicates that the metastatic samples were enriched with EGFR and PTK2B genes and the combination might be effective in treating aggressive or metastatic PTC. Therefore, since PTK2B is linked to EGFR, MAP kinase activation and calcium ion transport, it is probably an attractive therapeutic target and since it is linked with poor survival it can be a good prognostic target.
In summary, the absolute gene set enrichment and the pathway analysis indicated strongly that most of pathways overlapped among the non-aggressive and metastatic PTC. The key regulatory proteins among the pathways integrated in PTC pathophysiology are receptor protein tyrosine kinases, calcium channels, potassium channels, potassium activated calcium channels and MAP/ERK kinase family. The genes involved in these processes were seen occurring in high frequency and also seen upregulated in both the datasets which could be used as potential therapeutic targets to treat PTC.
Conclusions
In conclusion, the differentially activated cellular pathways and genes from this study showed the involvement of ion transport as well as other cancer related pathways including tyrosine kinase and protein phosphatase and the modulation of MAPK related pathways in the initiation of PTC during the non-aggressive phase and further progression to PTC metastatic phase. Transcriptomic analysis in different populations highlighted common and unique pathways involved in thyroid cancer pathogenesis further highlighting its heterogeneity. Understanding of genes mediated pathways during carcinogenesis, invasion and metastasis can have significant clinical outcome in developing better prognostic assays and molecular inhibitors that can replace classic generalized PTC treatments.
In addition, the transcriptomics analysis in this study identified interesting putative prognostic targets including EGFR, PTK2B, KCNQ1, KCNN4, BCL2 and CACNA1D which may be involved in key mechanisms of thyroid cancer. EGFR, PTK2B and KCNN4 showed significant higher expression in non-aggressive and metastatic compared to normal using PTC clinical biopsies. Search for corresponding drugs identified FDA approved drugs such as Vandetanib as well as other drugs that may prove useful treating the PTC.
Data Sharing Statement
The data used in this study from the sets GSE6004, GSE60542 and GSE3678 for the discovery sets and GSE35570, GSE50901, GSE129562 for the validation sets are available from Gene Expression Omnibus (https://www.ncbi.nlm.nih.gov/geo).
Author Contributions
All authors made a significant contribution to the work reported, whether that is in the conception, study design, execution, acquisition of data, analysis and interpretation, or in all these areas; took part in drafting, revising or critically reviewing the article; gave final approval of the version to be published; have agreed on the journal to which the article has been submitted; and agree to be accountable for all aspects of the work.
Acknowledgments
We would like to acknowledge the University of Sharjah for supporting this work. We would like to acknowledge Dr Noura AlKhayal for providing the thyroid cancer cases and Dr Sulaman Magdub for providing histopathology service.
Disclosure
The authors report no competing interests in this work.
References
- Xing M. Molecular pathogenesis and mechanisms of thyroid cancer. Nat Rev Cancer. 2013;13(3):184–199. doi:10.1038/nrc3431
- Miranda-Filho A, Lortet-Tieulent J, Bray F, et al. Thyroid cancer incidence trends by histology in 25 countries: a population-based study. Lancet Diabetes Endocrinol. 2021;9(4):225–234. doi:10.1016/S2213-8587(21)00027-9
- Cramer JD, Fu P, Harth KC, Margevicius S, Wilhelm SM. Analysis of the rising incidence of thyroid cancer using the surveillance, epidemiology and end results national cancer data registry. Surgery. 2010;148(6):1147–1152; discussion 1152–1143. doi:10.1016/j.surg.2010.10.016
- Noone A-M, Cronin KA, Altekruse SF, et al. Cancer incidence and survival trends by subtype using data from the surveillance epidemiology and end results program, 1992–2013. Cancer Epidemiol Biomarkers Prev. 2017;26(4):632–641. doi:10.1158/1055-9965.EPI-16-0520
- Tuttle RM, Ball DW, Byrd D, et al. Thyroid carcinoma. J Natl Comprehen Cancer Netw. 2010;8(11):1228–1274. doi:10.6004/jnccn.2010.0093
- Schneider DF, Chen H. New developments in the diagnosis and treatment of thyroid cancer. CA Cancer J Clin. 2013;63(6):374–394. doi:10.3322/caac.21195
- Al-Salam S, Sharma C, Afandi B, et al. BRAF and KRAS mutations in papillary thyroid carcinoma in the United Arab Emirates. PLoS One. 2020;15(4):e0231341. doi:10.1371/journal.pone.0231341
- Fugazzola L, Muzza M, Pogliaghi G, Vitale M. Intratumoral genetic heterogeneity in papillary thyroid cancer: occurrence and clinical significance. Cancers. 2020;12(2):383. doi:10.3390/cancers12020383
- Teng H, Mao F, Liang J, et al. Transcriptomic signature associated with carcinogenesis and aggressiveness of papillary thyroid carcinoma. Theranostics. 2018;8(16):4345–4358. doi:10.7150/thno.26862
- Hamoudi RA, Appert A, Ye H, et al. Differential expression of NF-kappaB target genes in MALT lymphoma with and without chromosome translocation: insights into molecular mechanism. Leukemia. 2010;24(8):1487–1497. doi:10.1038/leu.2010.118
- Subramanian A, Tamayo P, Mootha VK, et al. Gene set enrichment analysis: a knowledge-based approach for interpreting genome-wide expression profiles. Proc Natl Acad Sci. 2005;102(43):15545–15550. doi:10.1073/pnas.0506580102
- Hachim MY, Hachim IY, Elemam NM, Hamoudi RA. Toxicogenomic analysis of publicly available transcriptomic data can predict food, drugs, and chemical-induced asthma. Pharmgenomics Pers Med. 2019;12:181–199. doi:10.2147/PGPM.S217535
- Zhou Y, Zhou B, Pache L, et al. Metascape provides a biologist-oriented resource for the analysis of systems-level datasets. Nat Commun. 2019;10(1):1523. doi:10.1038/s41467-019-09234-6
- Wishart DS, Feunang YD, Guo AC, et al. DrugBank 5.0: a major update to the DrugBank database for 2018. Nucleic Acids Res. 2018;46(D1):D1074–D1082. doi:10.1093/nar/gkx1037
- Muhammad JS, Jayakumar MN, Elemam NM, et al. Gasdermin D hypermethylation inhibits pyroptosis and LPS-induced IL-1beta release from NK92 cells. ImmunoTargets Ther. 2019;8:29–41. doi:10.2147/ITT.S219867
- Bartha A, Gyorffy B. TNMplot.com: a web tool for the comparison of gene expression in normal, tumor and metastatic tissues. Int J Mol Sci. 2021;22(5):2622. doi:10.3390/ijms22052622
- Heberle H, Meirelles GV, da Silva FR, Telles GP, Minghim R. InteractiVenn: a web-based tool for the analysis of sets through Venn diagrams. BMC Bioinform. 2015;16(1):169. doi:10.1186/s12859-015-0611-3
- Ashburner M, Ball CA, Blake JA, et al. Gene ontology: tool for the unification of biology. Nat Genet. 2000;25(1):25–29. doi:10.1038/75556
- Mi H, Muruganujan A, Ebert D, Huang X, Thomas PD. PANTHER version 14: more genomes, a new PANTHER GO-slim and improvements in enrichment analysis tools. Nucleic Acids Res. 2019;47(D1):D419–D426. doi:10.1093/nar/gky1038
- Benedetti M, Zona A, Contiero P, D’Armiento E, Iavarone I, Group AW. Incidence of thyroid cancer in Italian contaminated sites. Int J Environ Res Public Health. 2021;18(1):191. doi:10.3390/ijerph18010191
- Harach HR, Ceballos GA. Thyroid cancer, thyroiditis and dietary iodine: a review based on the Salta, Argentina model. Endocr Pathol. 2008;19(4):209–220. doi:10.1007/s12022-008-9038-y
- Achatz MI, Zambetti GP. The inherited p53 mutation in the Brazilian population. Cold Spring Harb Perspect Med. 2016;6(12):a026195. doi:10.1101/cshperspect.a026195
- Fernandes GC, Michelli RA, Galvao HC, et al. Prevalence of BRCA1/BRCA2 mutations in a Brazilian population sample at-risk for hereditary breast cancer and characterization of its genetic ancestry. Oncotarget. 2016;7(49):80465–80481. doi:10.18632/oncotarget.12610
- Oleksyk TK, Wolfsberger WW, Weber AM, et al. Genome diversity in Ukraine. GigaScience. 2021;10(1). doi:10.1093/gigascience/giaa159
- Lee S, Seo J, Park J, et al. Korean Variant Archive (KOVA): a reference database of genetic variations in the Korean population. Sci Rep. 2017;7(1):4287. doi:10.1038/s41598-017-04642-4
- Tsai CM, Riestra AM, Ali SR, et al. Siglec-14 enhances NLRP3-inflammasome activation in macrophages. J Innate Immun. 2020;12(4):333–343. doi:10.1159/000504323
- Gogali F, Paterakis G, Rassidakis GZ, et al. Phenotypical analysis of lymphocytes with suppressive and regulatory properties (Tregs) and NK cells in the papillary carcinoma of thyroid. J Clin Endocrinol Metab. 2012;97(5):1474–1482. doi:10.1210/jc.2011-1838
- Zhuang G, Zeng Y, Tang Q, He Q, Luo G. Identifying M1 macrophage-related genes through a co-expression network to construct a four-gene risk-scoring model for predicting thyroid cancer prognosis. Front Genet. 2020;11:591079. doi:10.3389/fgene.2020.591079
- Youle RJ, Strasser A. The BCL-2 protein family: opposing activities that mediate cell death. Nat Rev Mol Cell Biol. 2008;9(1):47–59. doi:10.1038/nrm2308
- Aksoy M, Giles Y, Kapran Y, Terzioglu T, Tezelman S. Expression of bcl-2 in papillary thyroid cancers and its prognostic value. Acta Chir Belg. 2005;105:644–648. doi:10.1080/00015458.2005.11679794
- Cleary JM, Lima CM, Hurwitz HI, et al. A phase I clinical trial of navitoclax, a targeted high-affinity Bcl-2 family inhibitor, in combination with gemcitabine in patients with solid tumors. Invest New Drugs. 2014;32(5):937–945. doi:10.1007/s10637-014-0110-9
- Azizan EA, Poulsen H, Tuluc P, et al. Somatic mutations in ATP1A1 and CACNA1D underlie a common subtype of adrenal hypertension. Nat Genet. 2013;45(9):1055–1060. doi:10.1038/ng.2716
- Scholl UI, Goh G, Stölting G, et al. Somatic and germline CACNA1D calcium channel mutations in aldosterone-producing adenomas and primary aldosteronism. Nat Genet. 2013;45(9):1050–1054. doi:10.1038/ng.2695
- Monteith GR. Prostate cancer cells alter the nature of their calcium influx to promote growth and acquire apoptotic resistance. Cancer Cell. 2014;26(1):1–2. doi:10.1016/j.ccr.2014.06.015
- Wegener JW, Lee M, Hofmann F. Hypothyroidism does not affect the dihydropyridine sensitivity of precontracted murine uterus. Can J Physiol Pharmacol. 2003;81(9):890–893. doi:10.1139/y03-090
- Pardo LA, Contreras-Jurado C, Zientkowska M, Alves F, Stühmer W. Role of voltage-gated potassium channels in cancer. J Membrane Biol. 2005;205(3):115–124. doi:10.1007/s00232-005-0776-1
- Comes N, Serrano-Albarrás A, Capera J, et al. Involvement of potassium channels in the progression of cancer to a more malignant phenotype. Biochimica et Biophysica Acta. 2015;1848(10, Part B):2477–2492.
- Huang L, Bitner-Glindzicz M, Tranebjaerg L, Tinker A. A spectrum of functional effects for disease causing mutations in the Jervell and Lange-Nielsen syndrome. Cardiovasc Res. 2001;51(4):670–680. doi:10.1016/S0008-6363(01)00350-9
- Ellinor PT, Moore RK, Patton KK, Ruskin JN, Pollak MR, Macrae CA. Mutations in the long QT gene, KCNQ1, are an uncommon cause of atrial fibrillation. Heart. 2004;90(12):1487–1488. doi:10.1136/hrt.2003.027227
- Jespersen T, Grunnet M, Olesen SP. The KCNQ1 potassium channel: from gene to physiological function. Physiology. 2005;20:408–416. doi:10.1152/physiol.00031.2005
- Melman YF, Um SY, Krumerman A, Kagan A, McDonald TV. KCNE1 binds to the KCNQ1 pore to regulate potassium channel activity. Neuron. 2004;42(6):927–937. doi:10.1016/j.neuron.2004.06.001
- Wen J, Lin B, Lin L, Chen Y, Wang O. KCNN4 is a diagnostic and prognostic biomarker that promotes papillary thyroid cancer progression. Aging. 2020;12(16):16437–16456. doi:10.18632/aging.103710
- Liu X, Wei L, Zhao B, Cai X, Dong C, Yin F. Low expression of KCNN3 may affect drug resistance in ovarian cancer. Mol Med Rep. 2018;18(2):1377–1386. doi:10.3892/mmr.2018.9107
- Jiang S, Zhu L, Yang J, et al. Integrated expression profiling of potassium channels identifys KCNN4 as a prognostic biomarker of pancreatic cancer. Biochem Biophys Res Commun. 2017;494(1–2):113–119. doi:10.1016/j.bbrc.2017.10.072
- Ibrahim S, Dakik H, Vandier C, et al. Expression profiling of calcium channels and calcium-activated potassium channels in colorectal cancer. Cancers. 2019;11(4):561. doi:10.3390/cancers11040561
- Fisher KE, Jani JC, Fisher SB, et al. Epidermal growth factor receptor overexpression is a marker for adverse pathologic features in papillary thyroid carcinoma. J Surg Res. 2013;185(1):217–224. doi:10.1016/j.jss.2013.05.003
- Roskoski R. The ErbB/HER family of protein-tyrosine kinases and cancer. Pharmacol Res. 2014;79:34–74. doi:10.1016/j.phrs.2013.11.002
- Wang SX, Zhang XW, Wang XX, et al. [Efficacy and safety of vandetanib on advanced medullary thyroid carcinoma: single center result from a phase III study]. Zhonghua Er Bi Yan Hou Tou Jing Wai Ke Za Zhi. 2019;54(6):439–444. Chinese. doi:10.3760/cma.j.issn.1673-0860.2019.06.008
- Elisei R, Schlumberger MJ, Müller SP, et al. Cabozantinib in progressive medullary thyroid cancer. J Clin Oncol. 2013;31(29):3639–3646. doi:10.1200/JCO.2012.48.4659
- Schlumberger M, Elisei R, Müller S, et al. Overall survival analysis of EXAM, a phase III trial of cabozantinib in patients with radiographically progressive medullary thyroid carcinoma. Ann Oncol. 2017;28(11):2813–2819. doi:10.1093/annonc/mdx479
- Sherman SI, Clary DO, Elisei R, et al. Correlative analyses of RET and RAS mutations in a phase 3 trial of cabozantinib in patients with progressive, metastatic medullary thyroid cancer. Cancer. 2016;122(24):3856–3864. doi:10.1002/cncr.30252
- Cabanillas ME, de Souza JA, Geyer S, et al. Cabozantinib as salvage therapy for patients with tyrosine kinase inhibitor-refractory differentiated thyroid cancer: results of a multicenter phase II international thyroid oncology group trial. J Clin Oncol. 2017;35(29):3315–3321. doi:10.1200/JCO.2017.73.0226
- Brose MS, Robinson B, Sherman SI, et al. Cabozantinib for radioiodine-refractory differentiated thyroid cancer (COSMIC-311): a randomised, double-blind, placebo-controlled, phase 3 trial. Lancet Oncol. 2021;22(8):1126–1138. doi:10.1016/S1470-2045(21)00332-6
- Kurzrock R, Sherman SI, Ball DW, et al. Activity of XL184 (Cabozantinib), an oral tyrosine kinase inhibitor, in patients with medullary thyroid cancer. J Clin Oncol. 2011;29(19):2660–2666. doi:10.1200/JCO.2010.32.4145
- Hu MI, Elisei R, Dedecjus M, et al. Safety and efficacy of two starting doses of vandetanib in advanced medullary thyroid cancer. Endocr Relat Cancer. 2019;26(2):241–250. doi:10.1530/ERC-18-0258
- Del Rivero J, Edgerly M, Ward J, et al. Phase I/II trial of vandetanib and bortezomib in adults with locally advanced or metastatic medullary thyroid cancer. Oncologist. 2019;24(1):16–e14. doi:10.1634/theoncologist.2018-0452
- Leboulleux S, Bastholt L, Krause T, et al. Vandetanib in locally advanced or metastatic differentiated thyroid cancer: a randomised, double-blind, Phase 2 trial. Lancet Oncol. 2012;13(9):897–905. doi:10.1016/S1470-2045(12)70335-2
- Johansson S, Read J, Oliver S, et al. Pharmacokinetic evaluations of the co-administrations of vandetanib and metformin, digoxin, midazolam, omeprazole or ranitidine. Clin Pharmacokinet. 2014;53(9):837–847. doi:10.1007/s40262-014-0161-2
- Fox E, Widemann BC, Chuk MK, et al. Vandetanib in children and adolescents with multiple endocrine neoplasia type 2B associated medullary thyroid carcinoma. Clin Cancer Res. 2013;19(15):4239–4248. doi:10.1158/1078-0432.CCR-13-0071
- Wells SA, Gosnell JE, Gagel RF, et al. Vandetanib for the treatment of patients with locally advanced or metastatic hereditary medullary thyroid cancer. J Clin Oncol. 2010;28(5):767–772. doi:10.1200/JCO.2009.23.6604
- Schaller MD. Cellular functions of FAK kinases: insight into molecular mechanisms and novel functions. J Cell Sci. 2010;123(7):1007–1013. doi:10.1242/jcs.045112
- Yoon S, Seger R. The extracellular signal-regulated kinase: multiple substrates regulate diverse cellular functions. Growth Factors. 2006;24(1):21–44. doi:10.1080/02699050500284218
- Marini H, Polito F, Adamo E, Bitto A, Squadrito F, Benvenga S. Update on genistein and thyroid: an overall message of safety. Front Endocrinol (Lausanne). 2012;3:94. doi:10.3389/fendo.2012.00094
- Zhang K, Wang Y, Ma W, Hu Z, Zhao P. Genistein improves thyroid function in Hashimoto’s thyroiditis patients through regulating Th1 cytokines. Immunobiology. 2017;222(2):183–187. doi:10.1016/j.imbio.2016.10.004
- Xu X, Williams JW, Gong H, Finnegan A, Chong AS. Two activities of the immunosuppressive metabolite of leflunomide, A77 1726. Inhibition of pyrimidine nucleotide synthesis and protein tyrosine phosphorylation. Biochem Pharmacol. 1996;52(4):527–534. doi:10.1016/0006-2952(96)00303-6
- Mall JW, Myers JA, Xu X, Saclarides TJ, Philipp AW, Pollmann C. [Leflunomide reduces the angiogenesis score and tumor growth of subcutaneously implanted colon carcinoma cells in the mouse model]. Der Chirurg. 2002;73(7):716–720. German. doi:10.1007/s00104-002-0453-1
- Li EK, Tam LS, Tomlinson B. Leflunomide in the treatment of rheumatoid arthritis. Clin Ther. 2004;26(4):447–459. doi:10.1016/S0149-2918(04)90048-3
- O’Donnell EF, Saili KS, Koch DC, et al. The anti-inflammatory drug leflunomide is an agonist of the aryl hydrocarbon receptor. PLoS One. 2010;5(10). doi:10.1371/journal.pone.0013128
- Alhefdhi A, Burke JF, Redlich A, Kunnimalaiyaan M, Chen H. Leflunomide suppresses growth in human medullary thyroid cancer cells. J Surg Res. 2013;185(1):212–216. doi:10.1016/j.jss.2013.05.089
- Grzywa M, Kadziela M. [The conversion of hypothyroidism into hyperthyroidism during leflunomide with povidone iodine treatment of rheumatoid arthritis]. Polski merkuriusz lekarski. 2013;34(204):348–350. Polish.
- Skinner M, Philp K, Lengel D, et al. The contribution of VEGF signalling to fostamatinib-induced blood pressure elevation. Br J Pharmacol. 2014;171(9):2308–2320. doi:10.1111/bph.12559
- Bussel J, Arnold DM, Grossbard E, et al. Fostamatinib for the treatment of adult persistent and chronic immune thrombocytopenia: results of two phase 3, randomized, placebo-controlled trials. Am J Hematol. 2018;93(7):921–930. doi:10.1002/ajh.25125
- Duliege A-M, Arnold DM, Boccia R, et al. Two-year safety and efficacy outcomes with fostamatinib in adult patients with immune thrombocytopenia (ITP): open-label extension to phase 3 trial program. Blood. 2018;132(Supplement 1):736. doi:10.1182/blood-2018-99-110482
- Markham A. Fostamatinib: first Global Approval. Drugs. 2018;78(9):959–963. doi:10.1007/s40265-018-0927-1
- McKeage K, Lyseng-Williamson KA. Fostamatinib in chronic immune thrombocytopenia: a profile of its use in the USA. Drugs Ther Perspect. 2018;34(10):451–456. doi:10.1007/s40267-018-0551-x
- Bussel JB, Arnold DM, Boxer MA, et al. Long-term fostamatinib treatment of adults with immune thrombocytopenia during the phase 3 clinical trial program. Am J Hematol. 2019;94(5):546–553. doi:10.1002/ajh.25444
- Chandar AK, Alaber OA, Farooq MZ, Dahash BA, Mangla A. Safety profile of fostamatinib, an oral spleen tyrosine kinase inhibitor: a meta-analysis of randomized controlled trials. Blood. 2019;134(Supplement_1):4890. doi:10.1182/blood-2019-127782
- Kang Y, Jiang X, Qin D, et al. Efficacy and safety of multiple dosages of fostamatinib in adult patients with rheumatoid arthritis: a systematic review and meta-analysis. Front Pharmacol. 2019;10:897. doi:10.3389/fphar.2019.00897
- Moore DC, Gebru T, Muslimani A. Fostamatinib for the treatment of immune thrombocytopenia in adults. Am J Health Syst Pharm. 2019;76(11):789–794. doi:10.1093/ajhp/zxz052
- Boccia R, Cooper N, Ghanima W, et al. Fostamatinib is an effective second-line therapy in patients with immune thrombocytopenia. Br J Haematol. 2020;190(6):933–938. doi:10.1111/bjh.16959
- Newland A, McDonald V. Fostamatinib: a review of its clinical efficacy and safety in the management of chronic adult immune thrombocytopenia. Immunotherapy. 2020;12(18):1325–1340. doi:10.2217/imt-2020-0215
- Cooper N, Altomare I, Thomas MR, et al. Assessment of thrombotic risk during long-term treatment of immune thrombocytopenia with fostamatinib. Ther Adv Hematol. 2021;12:20406207211010875. doi:10.1177/20406207211010875
- Paik J. Fostamatinib: a review in chronic immune thrombocytopenia. Drugs. 2021;81(8):935–943. doi:10.1007/s40265-021-01524-y
- Selemetjev S, Bartolome A, Isic Dencic T, et al. Overexpression of epidermal growth factor receptor and its downstream effector, focal adhesion kinase, correlates with papillary thyroid carcinoma progression. Int J Exp Pathol. 2018;99(2):87–94. doi:10.1111/iep.12268
- Xu Q, Song A, Xie Q. The integrated analyses of driver genes identify key biomarkers in thyroid cancer. Technol Cancer Res Treat. 2020;19:1533033820940440. doi:10.1177/1533033820940440
- Linklater ES, Tovar EA, Essenburg CJ, et al. Targeting MET and EGFR crosstalk signaling in triple-negative breast cancers. Oncotarget. 2016;7(43):69903–69915. doi:10.18632/oncotarget.12065
- You KS, Yi YW, Cho J, Park JS, Seong YS. Potentiating therapeutic effects of epidermal growth factor receptor inhibition in triple-negative breast cancer. Pharmaceuticals. 2021;14(6):589. doi:10.3390/ph14060589
- Derringer GA, Thompson LD, Frommelt RA, Bijwaard KE, Heffess CS, Abbondanzo SL. Malignant lymphoma of the thyroid gland: a clinicopathologic study of 108 cases. Am J Surg Pathol. 2000;24(5):623–639. doi:10.1097/00000478-200005000-00001
- Nilsson M, Williams D. On the origin of cells and derivation of thyroid cancer: C cell story revisited. Eur Thyroid J. 2016;5(2):79–93. doi:10.1159/000447333
- Pietrowska M, Diehl HC, Mrukwa G, et al. Molecular profiles of thyroid cancer subtypes: classification based on features of tissue revealed by mass spectrometry imaging. Biochimica et Biophysica Acta. 2017;1865(7):837–845. doi:10.1016/j.bbapap.2016.10.006
- National Cancer Institute. SEER cancer statistics review, 1975–2016; 2019. Available from: https://seer.cancer.gov/csr/1975_2016/. Accessed March 1, 2022.
- Board. PATE. Thyroid cancer treatment (Adult) (PDQ®). Version HP, ed; 2021. Available from: https://www.ncbi.nlm.nih.gov/books/NBK65719/. Accessed March 1, 2022.
- Thyroid cancer treatment (Adult) (PDQ®): health professional version. PDQ cancer information summaries. Bethesda MD. Bookshelf ID: NBK65719, 2002–2022. https://pubmed.ncbi.nlm.nih.gov/26389164
- Stamatakos M, Paraskeva P, Stefanaki C, et al. Medullary thyroid carcinoma: the third most common thyroid cancer reviewed. Oncol Lett. 2011;2(1):49–53. doi:10.3892/ol.2010.223
- Pomorski L, Bartos M. Metastasis as the first sign of thyroid cancer. Neoplasma. 1999;46(5):309–312.
- Vasko V, Espinosa AV, Scouten W, et al. Gene expression and functional evidence of epithelial-to-mesenchymal transition in papillary thyroid carcinoma invasion. Proc Natl Acad Sci USA. 2007;104(8):2803–2808. doi:10.1073/pnas.0610733104
- Tarabichi M, Saiselet M, Tresallet C, et al. Revisiting the transcriptional analysis of primary tumours and associated nodal metastases with enhanced biological and statistical controls: application to thyroid cancer. Br J Cancer. 2015;112(10):1665–1674. doi:10.1038/bjc.2014.665
- Krajewska J, Olczyk T, Jarzab B. Cabozantinib for the treatment of progressive metastatic medullary thyroid cancer. Expert Rev Clin Pharmacol. 2016;9(1):69–79. doi:10.1586/17512433.2016.1102052
- Wells SA, Robinson BG, Gagel RF, et al. Vandetanib in patients with locally advanced or metastatic medullary thyroid cancer: a randomized, double-blind phase III trial. J Clin Oncol. 2012;30(2):134–141. doi:10.1200/JCO.2011.35.5040
- Fallahi P, Ferrari SM, Elia G, et al. Evaluating vandetanib in the treatment of medullary thyroid cancer: patient-reported outcomes. Cancer Manag Res. 2019;11:7893–7907. doi:10.2147/CMAR.S127848
- Kebebew E, Clark OH. Medullary thyroid cancer. Curr Treat Options Oncol. 2000;1(4):359–367. doi:10.1007/s11864-000-0052-7
- Nikiforov YE. Thyroid carcinoma: molecular pathways and therapeutic targets. Mod Pathol. 2008;21(Suppl2):S37–43. doi:10.1038/modpathol.2008.10
- de Groot JW, Links TP, Plukker JT, Lips CJ, Hofstra RM. RET as a diagnostic and therapeutic target in sporadic and hereditary endocrine tumors. Endocr Rev. 2006;27(5):535–560. doi:10.1210/er.2006-0017
- Ho WM, Wang YS, Tsou CT, et al. Thyroid function during isoflurane anesthesia and valvular heart surgery. J Cardiothorac Anesth. 1989;3(5):550–557. doi:10.1016/0888-6296(89)90151-8
- Park DS, Kim SS, Chung JD, Kim SD, Kim DK, Park JH. Effects of enflurane anesthesia and surgery on thyroid function. Korean J Anesthesiol. 1982;15(2):144–149. doi:10.4097/kjae.1982.15.2.144
- Hébrant A, Dom G, Dewaele M, et al. mRNA expression in papillary and anaplastic thyroid carcinoma: molecular anatomy of a killing switch. PLoS One. 2012;7(10):e37807. doi:10.1371/journal.pone.0037807
- Scholl UI, Stölting G, Nelson-Williams C, et al. Recurrent gain of function mutation in calcium channel CACNA1H causes early-onset hypertension with primary aldosteronism. Elife. 2015;4:e06315–e06315. doi:10.7554/eLife.06315
- Baig SM, Koschak A, Lieb A, et al. Loss of Cav1.3 (CACNA1D) function in a human channelopathy with bradycardia and congenital deafness. Nat Neurosci. 2011;14(1):77–84. doi:10.1038/nn.2694
- Jing Q-B, Tong H-X, Tang W-J, Tian S-D. Clinical significance and potential regulatory mechanisms of serum response factor in 1118 cases of thyroid cancer based on gene chip and RNA-sequencing data. Med Sci Monit. 2020;26:e919302–e919302. doi:10.12659/MSM.919302
- Gandhi L, Camidge DR, Ribeiro de Oliveira M, et al. Phase I study of Navitoclax (ABT-263), a novel Bcl-2 family inhibitor, in patients with small-cell lung cancer and other solid tumors. J Clin Oncol. 2011;29(7):909–916. doi:10.1200/JCO.2010.31.6208