
Abstract
Background
Dysregulated immunity is a hallmark of SARS-CoV-2 infection. Immune suppression is indicated by low monocyte expression of human leukocyte antigen D-related (mHLA-DR). T cells are important antiviral cells. We aimed to assess the role of mHLA-DR and T lymphocyte frequency in predicting COVID-19 severity.
Patients and Methods
This cross-sectional study enrolled 97 SARS-CoV-2 positive patients, including mild to moderate (n = 49) and severe cases admitted to intensive care unit (ICU) (n = 48). These ICU cases were further subdivided into survivors (n = 35) and non-survivors (n = 13).
Results
Severe cases had a significant decrease in the mHLA-DR mean fluorescence intensity (MFI) and T lymphocyte percentage compared to mild to moderate cases (P<0.001). Non-survivors had a lower T lymphocyte percentage (P=0.004) than survivors. The mHLA-DR MFI and T lymphocyte percentage correlated with oxygen saturation (r=0.632, P<0.001) and (r=0.669, P<0.001), respectively. According to the ROC curves, mHLA-DR MFI, at a cutoff of 143 and an AUC of 0.9, is a reliable biomarker for distinguishing severe COVID-19 cases, with 89.6% sensitivity and 81.6% specificity, while T lymphocyte frequency had 81.3% sensitivity and 81.6% specificity at a cutoff of 54.4% and an AUC of 0.9. The T lymphocyte percentage as a predictor of ICU survival at a cutoff of 38.995% exhibited 100% sensitivity and 57.1% specificity. According to multivariate regression analysis, reduced mHLA-DR MFI and T lymphocyte percentage are independent predictors of COVID-19 severity (OR = 0.976, 95% CI: 0.955–0.997, P = 0.025) and (OR = 0.849, 95% CI: 0.741–0.972, P = 0.018), respectively.
Conclusion
Reduced mHLA-DR expression and T-lymphocyte percentage are independent predictors of COVID-19 severity. Oxygen saturation percentage is correlated with mHLA-DR MFI and T lymphocyte frequency. The T lymphocyte frequency is a proposed predictor of COVID-19 survival in ICU admitted patients.
Introduction
Coronavirus disease 2019 (COVID-19), which emerged in Wuhan, China, and has been declared an international emergency. This disease is caused by the severe acute respiratory syndrome coronavirus type 2 (SARS-CoV-2).Citation1 COVID-19 has been linked to 226,844,344 cases worldwide, with an estimated 4,666,334 COVID-19-related deaths. While most COVID-19 cases are mild, some patients experience acute respiratory distress syndrome (ARDS). The severe type of COVID often demands the use of non-invasive or invasive mechanical ventilation (MV) to increase oxygenation, necessitating admission to an intensive care unit (ICU).Citation2
COVID-19 related ARDS had a worse prognosis than ARDS related to other conditions, with fatality rates ranging from 65.7% to 94% in patients who require MV.Citation3 The most common acute histological patterns in COVID-19 in the lung include diffuse alveolar damage, alveolar edema, hyaline membrane development, and inflammatory infiltrates.Citation4,Citation5
Patients with a severe form of COVID-19 have a poor clinical outcome, A hallmark of COVID-19 is lymphopenia, which is observed in up to 63% of patients with COVID-19.Citation5 Monocyte human leukocyte antigen D related (mHLA-DR) appears to be an essential factor as well for the poor outcomes. According to previous investigations, COVID-19 non-survivors had a progressive increase in interleukin-6 (IL-6) levels throughout hospitalization. Increased IL-6 levels and lymphopenia have been associated with low HLA-DR expression.Citation6
Dysregulated immune responses generated by the SARS-CoV-2 infection, such as viral escape from innate sensing and lymphopenia, which appear to activate immunological pathways that could contribute to COVID-19-induced systemic damage and mortality.Citation7 The development of a cytokine storm is the etiology of the substantial lung damage in individuals with severe SARS-CoV-2 infection, and monocytes play a key role in this pathological process.Citation8 Dysregulated immunity has been hypothesized as the cause of impaired pulmonary gas exchange in severe cases.Citation9 Previous data highlighted the importance of identifying early non-invasive severity predictors as soon as possible, which allows for quick medical intervention and, as a result effective patient classification.
HLA-DR is a human leukocyte antigen class II that is expressed on the cell surface of antigen-presenting cells such as monocytes.Citation10 Reduced antigen presentation potential and, therefore, immunosuppression results from mHLA-DR decline. So, it is hypothesized that monocytes in severe COVID-19 display a CD14+/HLA-DR-/low phenotype like immunosuppressive monocytic myeloid-derived suppressor cells.Citation11
Given that T lymphocyte responses are necessary for efficient antiviral immunity and that lymphopenia is a prevalent laboratory abnormality in the critically ill patients with COVID-19. Several investigations have documented the relevance of T lymphocyte frequency in COVID-19.Citation12
Monocytes were found to play a key role in both anti-SARS-CoV-2 immunity, as well as the dysregulated pro-inflammatory signature that defines severe COVID-19.Citation13 COVID-19 has also been linked to reduced HLA-DR expression with a parallel decrease in the number of lymphocytes.Citation6,Citation14 As a result, this study aimed to investigate the role of expression of mHLA-DR and the T lymphocyte frequency in predicting COVID-19 severity. We also wanted to determine if there is a link between mHLA-DR and the suppression of T lymphocyte expansion that gives rise of lymphopenia in COVID-19 patients.
Patients and Methods
Study Type and Participants
This cross-sectional comparative study was conducted on 97 adult patients with confirmed COVID-19. All cases were recruited from Al-Zahra Hospital, Faculty of Medicine (for Girls), Al-Azhar University, Cairo, Egypt, which was designated for the diagnosis and the isolation of SARS-CoV-2 positive patients. Patients were recruited from July to November of the year 2021.
According to the Egyptian Ministry of Health and Population’s (MOHP) guidelines, patients were divided into two groups based on the severity of their disease.Citation15 The first group (n = 49) consisted of patients with mild-to-moderate COVID-19, who were diagnosed, treated, and sent back to their homes for home isolation with none of them complaining of further severe complications. The second group (n = 48) consisted of patients with severe SARS-CoV-2 infection admitted to the SARS-CoV-2 ICU isolation unit.
Severe cases were followed to determine survival until ICU discharge. Accordingly, severe cases were further subdivided into survivors (n = 35) or non-survivors (n = 13). Flow chart describing patients’ recruitment into the study is shown in Supplementary File 1.
Patients with any of the following characteristics at the time of admission were considered to have severe COVID 19: (1) oxygen saturation ≤ 92%, (2) respiratory rate ≥ 30 breaths per minute (rest), (3) partial pressure of arterial oxygen (PaO2) to fractional concentration of oxygen inspired air (fiO2) ratio of ≤ 300 mmHg, or (4) specific complications such as septic shock, respiratory failure, and/or multiple-organ dysfunction.
The candidates gave their informed consent before their enrolment in the study. The study was conducted after obtaining the approval of the Research Ethical Committee of the Faculty of Medicine for Girls. The IRB number was 2021101046. The study was conducted in accordance with the tenets of the Helsinki Declaration.
The sample size was calculated using the Epi Info version 7.2; the calculations were based on the assumption of the expected frequency rate of 15% with a 95% confidence level, an acceptable margin of error of 5%, with a design effect of 1.0, the minimum calculated sample size was 96.
We included adult patients aged > 18 years with evident SARS-CoV-2 infection. All patients were receiving the routine COVID-19 treatment in Egypt (a combination of Azithromycin once daily, Paracetamol, vitamin C 1000 mg once daily, and hydroxychloroquine 200 mg twice daily). We excluded patients with active malignancy, autoimmune disease, chemotherapy, pregnancy, and unconscious patients who could not give their consent.
Participants’ Assessment
Personal information such as name, age, sex, occupation, contact with a known positive case of SARS-CoV-2 infection, a history of recent travels, and special habits of medical importance such as smoking. Besides, the history of the present illness includes the following: onset, course, and duration of the disease; fever, cough, dyspnea, and fatigue; and past history, including: the onset, course, and duration of the disease, fever, cough, dyspnea, and fatigue, and each participant’s relevant past history, including: a history of drug intake and respiratory disease such as bronchial asthma, were all recorded.
Sampling and Study Tools
When the patients first arrived at Al-Zahraa University Hospital, a volume of 8 mL of venous blood was collected from each subject. Each blood sample was divided into three tubes; the first of which was an EDTA tube into which 2 mL of blood were transferred for performing a complete blood count (CELL-DYN Ruby, 5-part Hematology analyzer, Abbott, Illinois, USA) and flow cytometry assay. The second tube was a gel serum separator tube in which 4 mL of the blood sample were transferred for serum separation after centrifugation. The serum was divided into two portions. The 1st portion was used for measurement of creatinine and ALT levels using a chemistry auto-analyzer device (Cobas Integra 400 plus, Roche Diagnostics, Germany). The 2nd portion was used to measure C reactive protein (CRP) levels using an analyzer (integra 400 plus, Ro diagnostics, Germany). The third tube was a sodium citrate blood tube in which the last 2 mL of blood were transferred for measuring D-Dimer levels using an analyzer (Cobas h232, Rodiagnostics, Germany).
Blood samples for arterial blood gas (ABG) measurement were taken with a heparinized syringe, the ABG levels were measured using an analyzer (Gempremier 3000, instrumentational laboratory, USA). ABG samples were processed immediately within five minutes after withdrawal in the emergency room of Alzahraa Hospital.
Flow Cytometry Assay
Flow cytometry was conducted at the Flow cytometry Laboratory, Clinical Pathology Department, Al-Zahraa Hospital, AL-Azhar University using the Four-color FACS Calibur (BD, Biosciences, San Jose, USA). The compensation was done before acquiring the samples using colour calibrated beads (BD, Biosciences, San Jose, USA, lot 5093879). Samples were immediately processed within 2 hours of withdrawal.
Each patient consumed two falcon test tubes in addition to an isotype control tube, each containing 50 ul of fresh blood and 5 ul of CD45-PerCP-conjugated anti-human (BD Biosciences, USA, cat. no. 345809, lot no. 6039924). Then, in the first tube, we added 5 µl of each of CD14-PE-conjugated anti-human (cat. no. A07764, lot no. 25, Beckman Coulter, Immunotech, France), and HLA-DR-FITC-conjugated anti-human (cat. no. 555811, lot no. 4342790, BD Biosciences, USA). In the second tube, we added 5 µl of FITC-conjugated anti-human CD3/PE-conjugated anti-human CD16+CD56 cocktail (cat. no. 95131, lot no. 6012680). Mixtures in each tube were incubated for 10 min. RBC destruction reagent (BD Biosciences) was added for RBC lysis before washing. The instrument acquisition was set at 100,000 events at a slow speed to ensure that each cell intersected with the laser beam separately and to avoid laser intersection with doublets. Also, before sample capture, a good vortex was done to ensure the mechanical separation of doublets if found.
The isotype control tube contained a mouse IgG1 FITC/IgG2a PE cocktail (cat. no. 342409) in addition to CD45-PerCP. The control tube was loaded to determine the cutoff.
The first tube was used to detect monocytes; the first gate was based on the CD45/SS dot plot on the monocyte area (the blue population). Then, using a single histogram created from the whole monocyte population, the percentage of monocytes expressing HLA-DR and the mode of HLA-DR expression were investigated using. The MFI of HLA-DR positive cells was assessed in the area under the M1 marker ().
Figure 1 Gating strategies. Gating strategies for detecting the percentage of monocytes expressing HLA-DR and the mode of HLA-DR expression on monocytes and the frequency of T lymphocytes, with illustration of an example of mHLADR in mild to moderate case and severe case.
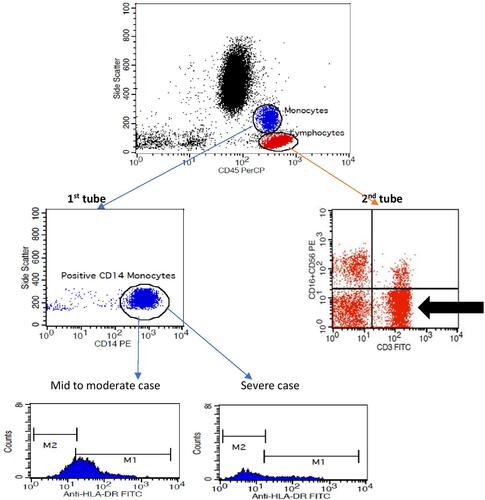
The initial gate was taken on the CD45/SS dot plot on the lymphocyte area in the second tube for T lymphocyte detection (the red population). A quadrant plot was created using the total lymphocyte population, with CD3 on the X-axis and CD56+16 on the Y-axis. Then, in the lower right quadrant denoted by the arrow, T lymphocytes were identified as CD3 positive and CD56+16 negative to rule out CD3 positive T-natural killer cells ().
Statistical Methods
The Statistical Package for the Social Sciences version 26 (IBM Corp., Armonk, NY, USA) was used to code, enter and analyze all study data. Data were summarized using the mean and standard deviation for normally distributed variables or the median and interquartile range for non-normally distributed variables. Frequencies (number of cases) and relative frequencies (percentages) for categorical variables. Comparisons between groups were done using an unpaired t-test for normally distributed quantitative variables, whereas the non-parametric Mann–Whitney U-test was used for skewed quantitative variables. For comparing categorical data, the Chi square (c2) test was performed. The Fisher exact test was used instead when the expected frequency was ≤ 5. Correlations between quantitative variables were done using the Spearman correlation coefficient. Receiver Operating Characteristics (ROC) curves were constructed and the area under the curve analysis was performed to detect the best cutoff value of significant markers for the detection of severe cases and survival. P-values <0.05 were considered statistically significant. Logistic regression was performed to identify independent predictors of severity adjusted for possible confounders.
Results
The study population consisted of 97 patients with COVID-19 (49 mild to moderate cases and 48 severe ICU admitted cases). The age, demographic data and the clinical findings of the studied cases are shown in .
Table 1 Age, Demographic Data and the Clinical Disease Presentation of the Study Participants
No statistically significant difference was determined between the two groups in terms of sex, whereas the ages of the study participants were significantly lower in the mild to moderate group than in the severe group (P < 0.001).
The median (IQR) values of the percentages of monocytes expressing mHLA-DR, mHLA-DR MFI, and the T lymphocyte percentage among the mild to moderate cases were 98 (97–99), 208 (148–259), and 57.8 (55–66), respectively, while the median (IQR) values of the percentages of monocytes expressing mHLA-DR, mHLA-DR MFI, and T lymphocyte percentage in severe cases were 80.5 (53–93), 90 (58–111.5), and 33.75 (19.23–52.26). Accordingly, comparison between both groups revealed that severe COVID-19 patients showed significantly lower values of all three mentioned markers (P < 0.001), as shown in .
Table 2 Comparison Between Mild to Moderate Group and Severe Group Regarding Laboratory Data
Also, the comparisons of laboratory data between the mild to moderate and severe groups revealed that the patients with severe COVID-19 showed a significantly lower median absolute lymphocytic count (ALC). In addition to the higher median values of neutrophil lymphocyte ratio (NLR), D-dimer levels, and CRP levels. The relevant data are presented in .
Severe cases (n = 48) were subdivided according to the survival outcome of the disease into survivors n = 35 (72.9%) and non-survivors n = 13 (27.1%). The median (IQR) T cell percentage in non-survivors was 20.30 (13.49–27.69) whereas in survivors was 42.1 (19.27–54.95). Accordingly, comparisons between both groups revealed a significant decrease in non-survivors (P = 0.004). While no statistically significant difference was found between both groups regarding mHLA-DR MFI, the percentage of monocytes expressing mHLA-DR, D-dimer and CRP levels in .
Table 3 Comparison of Study Variables Between Survivors and Non-Survivors
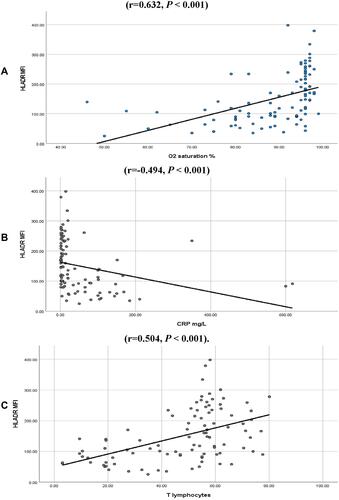
Correlation studies revealed a positive correlation between mHLA-DR MFI with T lymphocyte percentage, and oxygen (O2) saturation percentage, in all study participants (n = 97) (r = 0.504, P < 0.001) and (r = 0.632, P < 0.001).
A negative correlation was seen between mHLA-DR MFI with CRP (r= - 0.494, P < 0.001) and with D-Dimer levels (r= - 0.455, P < 0.001), , .
Table 4 Correlation of mHLA-DR MFI, Percentage of Monocytes Expressing HLA-DR and T Lymphocyte Percentage with the Other Studied Markers in All Study Cases (n=97)
Figure 2 Correlation of mHLA-DR MFI with other study markers in all study cases (n=97). (A) Positive correlation of mHLA-DR MFI with O2 saturation was seen (r=0.632, P < 0.001) (B) Negative correlation of mHLA-DR MFI with CRP was seen (r=−0.494, P < 0.001). (C) Positive correlation of mHLA-DR MFI with T lymphocyte % was seen (r=0.504, P < 0.001).
Also, the correlation studies revealed a positive correlation of the T lymphocyte percentage with O2 saturation percentage in all study cases (n = 97) (r = 0.669, P < 0.001). While a negative correlation was observed with the NLR (r = −0.212, P = 0.037), CRP levels (r = −0.536, P < 0.001) and with D-Dimer levels (r = −0.326, P = 0.001), as shown in .
The output data of the performed ROC curves for the percentage of monocytes expressing HLA-DR, mHLA-DR MFI, the T lymphocyte percentage, D-Dimer levels, and CRP levels revealed that mHLA-DR MFI and T lymphocyte were the best severity discriminators between all the studied markers. At a cutoff of 143 and an AUC of 0.9, the mHLA-DR MFI showed 89.6% sensitivity and 81.6% specificity to discriminate severe cases. T lymphocyte frequency with a cutoff of 54.4% and an AUC of 0.9 had a sensitivity of 81.3% and a specificity of 81.6%, as shown in and .
Table 5 (A) The ROC Curve Output Data for the Percentage of Monocytes Expressing HLA-DR, mHLA-DR MFI, T Lymphocytes Percentage, D-Dimer, and CRP as Discriminators of Severity Between Mild-to-Moderate and Severe Groups. (B) ROC Curve Output Data for T Lymphocyte Percentage Discrimination of Survival in Severe ICU Admitted Patients
Figure 3 Output data of ROC curves regarding monocyte % expressing HLA-DR, mHLA-DR MFI, T lymphocytes %. (A) Output data of ROC curve for monocyte % expressing HLA-DR, mHLA-DR MFI, T lymphocyte %, as discriminators of severity between mild to moderate group and severe group. (B) Output data of ROC curve to assess T lymphocyte frequency as a predictor of survival in ICU admitted patients (P< 0.001).
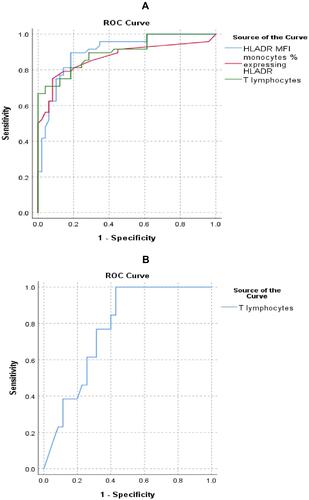
The results of the performed ROC curve of T lymphocyte frequency as a predictor of ICU survival at a cutoff of 38.995% and an AUC of 0.771 revealed (100%) sensitivity and (57.1%) specificity (P < 0.001), as shown in and .
Furthermore, multiple logistic regression analysis of the percentage of monocytes expressing HLA-DR, mHLA-DR MFI, T lymphocyte percentage with age, diabetes mellitus, bronchial asthma, and hypertension for the identification of COVID-19 severity predictors revealed that mHLA-DR MFI and the T lymphocyte percentage were independent predictors of COVID-19 severity (OR = 0.976, 95% CI: 0.955–0.997, P = 0.025) and (OR = 0.849, 95% CI: 0.741–0.972, P = 0.018) respectively, as shown in .
Table 6 Multiple Regression Analysis of Percentage of Monocytes Expressing HLADR, HLADR MFI, and T Lymphocyte Percentage with Co-Founders Affecting COVID-19 Severity and Survival
Multiple logistic regression analysis of T lymphocyte percentage, age, diabetes mellitus, bronchial asthma, and hypertension with COVID-19 survival outcome was not feasible due to the low number of non-survivors with the above-mentioned co-founders.
Discussion
COVID-19 has a devastating effect on the economy, society, and public health. Most of the patients are asymptomatic or minimally symptomatic, with just around a quarter of cases progressing to a severe stage. A serious infection usually starts first in the respiratory system, but it can progress to multiple organ failure.Citation16 Understanding the role of immune cells in the wide spectrum of COVID-19 clinical symptoms is crucial for developing effective treatment strategies.
The HLA-DR is an important regulator of antigen presentation that influences the immunological T cell response and disease prognosis.Citation17 As a result, the goal of this investigation was to assess if there was a link between monocyte HLA-DR expression, the T lymphocyte frequency, and the COVID-19 course diversity.
No significant difference was found in the absolute monocytic count (AMC) between the mild to moderate group and the severe ICU admitted group (P=0.492), whereas the comparison revealed a significant decrease in the median value of mHLA-DR MFI in severe cases (P< 0.001), indicating that the defect is purely functional and not related to the count. This finding was in line with those of another study by Schulte-Schrepping et al study which documented the decreased levels of mHLA-DR in severe COVID-19 patients.Citation18 Also, in patients with COVID-19, Arunachalam et al observed a significant decrease in the expression of genes implicated in monocyte antigen-presentation pathways and the reduced expression of mHLA-DR when compared to controls, with these findings augmented in severe cases.Citation14 Another study by Bonnet et al explained that the high IL-6 level is the cause of the down-regulated mHLA-DR expression via the STAT3 signaling pathway, and higher IL-6/mHLA-DR ratios are associated with severity in COVID-19 cases.Citation19
When severe COVID-19 patients were compared to mild to moderate COVID-19 patients, it was discovered that severe COVID-19 patients had a significantly decreased percentage of T lymphocyte (P< 0.001). These findings were similar to those of de Candia et al who reported that severe infection is characterized by significant T cell depletion.Citation20 Cizmecioglu et al and Taghiloo et al proposed that a decrease in the T cell count is most likely due to the rapidly propagating virus and investigated the T cell apoptosis pattern, discovering that the number of apoptotic T lymphocytes were increased in all COVID-19 patients compared to controls. Furthermore, apoptotic T lymphocytes were found to be significantly higher in severe cases than in mild cases, indicating that apoptosis-induced T-cell lymphopenia is linked to COVID-19 severity.Citation21,Citation22
Regarding the NLR and PLR, only the NLR significantly increased in the severe ICU admitted patients (P< 0.001), which was consistent with Hammad et al, who stated that NLR elevation is an indicator of a poor prognosis.Citation23 In terms of the PLR, Bg et al previously indicated that PLR has a predictive value in COVID-19 investigations, but this finding was not confirmed in our study.Citation24 Kalabin et al cautioned against using both the NLR and the PLR as independent markers of illness severity.Citation25
When comparing the severe group to the mild to moderate group, the CRP values showed a substantial rise in severe cases (P< 0.001). This was in line with the findings of Wang et al and Huang et al who proposed CRP as a prognostic marker for COVID-19.Citation26,Citation27 D-Dimer levels showed significant elevation in the severe ICU admitted group when compared with the mild to moderate group, with a median value (IQR) of 900 ng/mL (445–2278) in the severe cases. This was nearly in line with the findings of Zhou et al, who found that D-Dimer levels of more than 1000 ng/mL could aid clinicians in identifying patients with a poor prognosis at an early stage.Citation28
Severe cases were subdivided based on the disease’s outcome into survivors (n = 35, or 72.9%) and non-survivors (n = 13, or 27.1%). When the percentage of monocytes expressing HLA-DR, mHLA-DR MFI, the T lymphocyte percentages, CRP levels, and D-Dimer levels were compared between survivors (n = 35) and non-survivors (n = 13), only the T lymphocyte percentage was significantly lower in non-survivor cases (P = 0.336), (P = 0.070), (P = 0.004), (P = 0.444), and (P = 0.112), respectively ().
This significantly lower percentage of T lymphocytes in non-survivors agreed with Montiel-Cervantes et al, who stated that lower levels of T cells are useful as biomarkers of mortality in severe COVID-19.Citation29 This was supported by the findings of Zhao et al, whose study confirmed that lymphocytopenia and, in particular, low CD4+ T cells, were immune-related risk factors for COVID-19 patients’ mortality.Citation30 The overwhelming immune response to SARS-CoV-2 infection, which is based on T cells, explains the COVID-19 mortality pattern, which contributes significantly to the substantial collateral damage that leads to death in ICU admitted patients.Citation21
Although the difference between of the median values of mHLADR MFI was non-significant (P = 0.07), a lower level was detected in non survivors (median = 64; IQR = 40–83) than in survivors (median = 93; IQR = 61–113). These findings were in line with the findings of Palojärvi et al, who reported that lower mHLADR MFI is linked to a higher risk of death.Citation31
In the present study, there was a negative correlation of mHLA-DR MFI with CRP (r = −0.494, P < 0.001) and with D-Dimer levels (r = −0.455, P < 0.001). These findings strengthen the prognostic value of mHLA-DR MFI in COVID-19.
In the current study, a positive correlation of mHLA-DR MFI with the T lymphocyte percentage was observed (r=0.504, P < 0.001). This finding agreed with Giamarellos-Bourboulis et al.Citation32 According to Benlyamani et al and Payen et al, both decreased mHLA-DR expression and lymphopenia were parallel markers of immunosuppression in critically ill patients.Citation33,Citation34
Falck-Jones et al proposed that monocytic MDSC-driven mechanisms of T cell suppression in inflammatory conditions include the secretion of arginase 1, which catabolizes l-arginine leading to the generation of reactive oxygen species and nitrogen species to suppress immune responses, the direct engagement of T cell inhibitory and apoptotic receptors, and the production of inhibitory cytokines.Citation35 Grant et al proposed a monocyte-T lymphocyte circuit to explain T cell lymphopenia, suggesting that the SARS-CoV-2 infection of alveolar monocyte-derived macrophages induces the synthesis of T lymphocyte chemokines, which enhance T lymphocyte migration to the lungs.Citation36
A positive association of mHLA-DR MFI with O2 saturation % was seen in all study participants (n = 97) (r = 0.62, P < 0.001). According to a study by Schulte-Schrepping et al, poor expression of mHLA-DR is commonly associated with decreased anti-inflammatory cytokines levels and high levels of proinflammatory cytokines, which leads to respiratory failure.Citation18 Furthermore, Giamarellos-Bourboulis et al found that the majority of patients with severe respiratory failure had immunological paralysis characterized by reduced mHLA-DR expression, which is driven by high IL-6 production.Citation32 Arunachalam et al also demonstrated functional suppression of monocytes in patients with COVID-19, explaining that the elevated levels of inflammatory cytokines observed in the circulation in COVID-19 are due to tissue origin from lung injury and organ dysfunctionCitation14 ().
Furthermore, in all 97 cases studied, the percentage of T lymphocytes was strongly correlated with the percentage of O2 saturation percentage (r = 0.669, P < 0.001). According to a study by Zhao et al, depletion of the CD4+ T cells leads to enhanced immune-mediated interstitial pneumonitis and delayed clearance of SARS-CoV from the lungs, demonstrating the vital role of the CD4+ T lymphocyte in preventing SARS-CoV infection.Citation30
A negative correlation was seen between the T lymphocyte percentage and the NLR (r = −0.212, P = 0.037), CRP (r = −0.536, P < 0.001) and with the D-Dimer levels (r = −0.326, P = 0.001), as shown in . These three above mentioned parameters are well-established severity markers,Citation24 bolstering the T lymphocyte percent’s prognostic usefulness in COVID-19.
To identify the most reliable biomarkers to distinguish severe COVID-19 cases, ROC curves for the percentage of monocytes expressing HLA-DR, mHLA-DR MFI, the T lymphocytes percentage, D-Dimer levels, and CRP levels were performed, and they revealed that mHLA-DR MFI and the T lymphocytes percentage were the best severity discriminators out of all the studied markers. ROC curves revealed that at a cutoff of 143 and an AUC of 0.9, mHLA-DR MFI had 89.6% sensitivity and 81.6% specificity. Similarly, the T lymphocyte percentage with a cutoff of 54.4% and an AUC of 0.9 had a sensitivity of 81.3% and a specificity of 81.6%, as shown in and .
This is reinforced by recent research by Astbury et al who documented that HLADR polymorphisms influence COVID-19 outcome.Citation17 Both helper T (Th) cells and cytotoxic T cells have also been shown to play an important antiviral role by balancing the fight against the virus with the risk of developing autoimmunity or overwhelming inflammation. Locally and systemically, their absence will result in uncontrolled inflammatory innate reactions and detrimental tissue damage.Citation30
The results of the performed ROC curve of the T lymphocyte frequency as a predictor of ICU survival at a cutoff of 38.995% and an AUC of 0.771 demonstrated 100% sensitivity and 57.1% specificity (P< 0.001) (). This matched the findings of the He et al study, according to which T-lymphocyte count was linked to COVID-19 course advancement.Citation37 The T lymphopenia was thought to be caused by an overactive host immune response that could not clear the virus, but it worsens the respiratory distress and the organ damage.Citation5
Furthermore, multiple logistic regression analysis of study markers and co-founders revealed that mHLA-DR MFI and the T lymphocyte percent are independent predictors of COVID-19 severity (OR = 0.976, 95% CI: 0.955–0.997, P = 0.025) and (OR = 0.849, 95% CI: 0.741–0.972, P = 0.018) respectively ().
The CD147 spike protein is hypothesized to be involved in the SARS-CoV-2 infection of human T cell lines. COVID-19 treatment outcomes could also be improved by suppressing the CD147 protein and preventing the SARS-CoV-2 infection.Citation38
Study Limitations
There is no extensive flow cytometry analysis of the T cell subsets and monocyte-excreted cytokines to assess functionality over a wide range. A drawback is the small number of non-survivors in the sample. Despite this, our findings revealed a link between the oxygen saturation % and both the T cell percentage and mHLA-DR expression, highlighting the possibility of using the reduction of these biomarkers as predictors of respiratory failure and the need for mechanical ventilation. Furthermore, the current study reveals a link between T lymphocyte frequency, which is easily assessed, and ICU patient survival. Also, our findings emphasize the importance of continued immunological monitoring in severe SARS-Cov2 infections and refer to possible immunotherapy target. Future research should cover the T lymphocyte subpopulation. In addition, we urge future studies to follow patients over time to see how treatment affects HLADR expression in severe cases. Also, it is recommended to assess if the inhibition of CD147 protein has a therapeutic effect on COVID-19-related T lymphocytopenia.
Conclusion
Reduced mHLA-DR expression and the T lymphocyte percentage are independent predictors of COVID-19 severity. The oxygen saturation is correlated with the T cells percentage and the mHLA-DR MFI. Moreover, T cell frequency is proposed as a predictor of COVID-19 survival in ICU newly admitted patients.
Ethical Declaration
Authors confirm that this study complies with the Declaration of Helsinki. The study was done after approval of research Ethical Committee of Faculty of Medicine for Girls. IRB number is 2021101046.
Acknowledgments
Deepest gratitude to Prof Dr Mahmoud Seddik, Vice President of Al-Azhar University for Post-Graduate Studies and Research for the administrative approvals and the facilities to accomplish this work. Thanks to Prof Dr Amal Abdelaleem, Head of Clinical Pathology Department who enabled us to utilize the labs of the department to perform the practical work.
Disclosure
The authors declared no potential conflicts of interest with respect to the research, authorship and/or publication of this article.
References
- Worobey M. Dissecting the early COVID-19 cases in Wuhan. Science. 2021;374:1202–1204. doi:10.1126/science.abm4454
- Gosangi B, Rubinowitz AN, Irugu D, Gange C, Bader A, Cortopassi I. COVID-19 ARDS: a review of imaging features and overview of mechanical ventilation and its complications. Emerg Radiol. 2022;29(1):23–34. doi:10.1007/s10140-021-01976-5
- Wu C, Chen X, Cai Y, et al. Risk factors associated with acute respiratory distress syndrome and death in patients with coronavirus disease 2019 pneumonia in Wuhan, China. JAMA Intern Med. 2020;180(7):934–943. doi:10.1001/jamainternmed.2020.0994
- Michalski JE, Kurche JS, Schwartz DA. From ARDS to pulmonary fibrosis: the next phase of the COVID-19 pandemic? Transl Res. 2022;241:13–24. doi:10.1016/j.trsl.2021.09.001
- André S, Picard M, Cezar R, et al. T cell apoptosis characterizes severe Covid-19 disease. Cell Death Differ. 2022;22:1–14.
- Napoli C, Benincasa G, Criscuolo C, Faenza M, Liberato C, Rusciano M. Immune reactivity during COVID-19: implications for treatment. Immunol Lett. 2021;231:28–34.
- Vabret N, Britton GJ, Gruber C, Hegde S, Kim J, Kuksin M. Immunology of COVID-19: current state of the science. Immunity. 2020;52:910–941. doi:10.1016/j.immuni.2020.05.002
- Gatti A, Radrizzani D, Viganò P, Mazzone A, Brando B. Decrease of non-classical and intermediate monocyte subsets in severe acute SARS-CoV-2 infection. Cytometry A. 2020;97(9):887–890. doi:10.1002/cyto.a.24188
- Li G, Fan Y, Lai Y, et al. Coronavirus infections and immune responses. J Med Virol. 2020;92(4):424–432. doi:10.1002/jmv.25685
- Zmijewski JW, Pittet JF. Human leukocyte antigen-DR deficiency and immunosuppression-related end-organ failure in SARS-CoV2 infection. Anesth Analg. 2020;131(4):989–992. doi:10.1213/ANE.0000000000005140
- Rubina K, Shmakova A, Shabanov A, et al. Novel prognostic determinants of COVID-19-related mortality: a pilot study on severely ill patients in Russia. PLoS One. 2022;17(2):e0264072. doi:10.1371/journal.pone.0264072
- Moratto D, Chiarini M, Giustini V, et al. Flow cytometry identifies risk factors and dynamic changes in patients with COVID-19. J Clin Immunol. 2020;40(7):970–973. doi:10.1007/s10875-020-00806-6
- Peñaloza HF, Lee JS, Ray P. Neutrophils and lymphopenia, an unknown axis in severe COVID-19 disease. PLoS Pathog. 2021;17(9):e1009850. doi:10.1371/journal.ppat.1009850
- Arunachalam PS, Wimmers F, Mok CKP, et al. Systems biological assessment of immunity to mild versus severe COVID-19 infection in humans. Science. 2020;369(6508):1210–1220. doi:10.1126/science.abc6261
- Masoud H, Elassal G, Zaky S, et al. Management protocol for COVID-19 patients, version 1.4; 2020. Egypt: Ministry of Health and Population (MOHP). Available from: https://www.scribd.com/document/484116012/MoHP-Protocol-for-COVID19. Accessed May 13, 2022.
- Stawski R, Nowak D, Perdas E. Cell-free DNA: potential application in COVID-19 diagnostics and management. Viruses. 2022;14(2):321. doi:10.3390/v14020321
- Astbury S, Reynolds CJ, Butler DK, et al. COVIDsortium Investigators*. HLA-DR polymorphism in SARS-CoV-2 infection and susceptibility to symptomatic COVID-19. Immunology. 2022;166:68–77. doi:10.1111/imm.13450
- Schulte-Schrepping J, Reusch N, Paclik D, et al. Deutsche COVID-19 OMICS initiative (DeCOI). Severe COVID-19 is marked by a dysregulated myeloid cell compartment. Cell. 2020;182(6):1419–1440.e23. doi:10.1016/j.cell.2020.08.001
- Bonnet B, Cosme J, Dupuis C, et al. Severe COVID-19 is characterized by the co-occurrence of moderate cytokine inflammation and severe monocyte dysregulation. EBioMedicine. 2021;73:103622. doi:10.1016/j.ebiom.2021.103622
- de Candia P, Prattichizzo F, Garavelli S, Matarese G. T cells: warriors of SARS-CoV-2 infection. Trends Immunol. 2021;42(1):18–30. doi:10.1016/j.it.2020.11.002
- Cizmecioglu A, Akay Cizmecioglu H, Goktepe MH, et al. Apoptosis-induced T-cell lymphopenia is related to COVID-19 severity. J Med Virol. 2021;93(5):2867–2874. doi:10.1002/jmv.26742
- Taghiloo S, Aliyali M, Abedi S, et al. Apoptosis and immunophenotyping of peripheral blood lymphocytes in Iranian COVID-19 patients: clinical and laboratory characteristics. J Med Virol. 2021;93(3):1589–1598. doi:10.1002/jmv.26505
- Hammad R, Eldosoky MA, Fouad SH, et al. Circulating cell-free DNA, peripheral lymphocyte subsets alterations and neutrophil lymphocyte ratio in assessment of COVID-19 severity. Innate Immun. 2021;27(3):240–250. doi:10.1177/1753425921995577
- Bg S, Gosavi S, Ananda Rao A, et al. Neutrophil-to-lymphocyte lymphocyte-to-monocyte, and platelet-to-lymphocyte ratios: prognostic significance in COVID-19. Cureus. 2021;13(1):e12622. doi:10.7759/cureus.12622
- Kalabin A, Mani VRK, Valdivieso SC, Donaldson B. Role of neutrophil-to-lymphocyte, lymphocyte-to-monocyte and platelet-to-lymphocyte ratios as predictors of disease severity in COVID-19 patients. Infez Med. 2021;29(1):46–53.
- Wang G, Wu C, Zhang Q, et al. C-reactive protein level may predict the risk of COVID-19 aggravation. Open Forum Infect Dis. 2020;7:ofaa153. doi:10.1093/ofid/ofaa153
- Huang I, Pranata R, Lim MA, et al. The C-reactive protein, procalcitonin, D-dimer, and ferritin in severe coronavirus disease-2019: a meta-analysis. Adv Respir Dis. 2020;14:1753466620937175.
- Zhou F, Yu T, Du R, Fan G, Liu Y, Liu Z. Clinical course and risk factors for mortality of adult in patients with COVID-19 in Wuhan, China: a retrospective cohort study. Lancet. 2020;395:1054–1062. doi:10.1016/S0140-6736(20)30566-3
- Montiel-Cervantes LA, Medina G, Pilar Cruz-Domínguez M, et al. Camacho-sandoval R.Isr poor survival in COVID-19 associated with lymphopenia and higher neutrophile-lymphocyte ratio. Med Assoc J. 2021;23(3):153–159.
- Zhao Y, Nie HX, Hu K, et al. Abnormal immunity of non-survivors with COVID-19: predictors for mortality. Infect Dis Poverty. 2020;9(1):108. doi:10.1186/s40249-020-00723-1
- Palojärvi A, Petäjä J, Siitonen S, et al. Low monocyte HLA-DR expression as an indicator of immunodepression in very low birth weight infants. Pediatr Res. 2013;73:469–475. doi:10.1038/pr.2012.199
- Giamarellos-Bourboulis EJ, Netea MG, Rovina N, et al. Complex immune dysregulation in COVID-19 patients with severe respiratory failure. Cell Host Microbe. 2020;27(6):992–1000.e3. doi:10.1016/j.chom.2020.04.009
- Benlyamani I, Venet F, Coudereau R, Gossez M, Monneret G. Monocyte HLA-DR measurement by flow cytometry in COVID-19 patients: an interim review. Cytometry A. 2020;97(12):1217–1221. doi:10.1002/cyto.a.24249
- Payen D, Cravat M, Maadadi H, et al. Study of immune cells in severe COVID-19 patients. Front Immunol. 2020;11:580250. doi:10.3389/fimmu.2020.580250
- Falck-Jones S, Vangeti S, Yu M, et al. Functional monocytic myeloid-derived suppressor cells increase in blood but not airways and predict COVID-19 severity J Clin Invest. 2021;131(6):e144734.
- Grant RA, Morales-Nebreda L, Markov NS, et al.; NU SCRIPT Study Investigators. Circuits between infected macrophages and T cells in SARS-CoV-2 pneumonia. Nature. 2021;590(7847):635–641. doi:10.1038/s41586-020-03148-w
- He R, Lu Z, Zhang L, et al. The clinical course and its correlated immune status in COVID-19 pneumonia. J Clin Virol. 2020;127:104361. doi:10.1016/j.jcv.2020.104361
- Ulrich H, Pillat MM. CD147 as a target for COVID-19 treatment: suggested effects of azithromycin and stem cell engagement. Stem Cell Rev Rep. 2020;16(3):434–440. doi:10.1007/s12015-020-09976-7