Abstract
This paper describes the methodology of the Utrecht Student Survey. This online survey was conducted in June 2011 by 6002 students living in Utrecht, The Netherlands. The aim of the survey was to determine the potential impact of mixing alcoholic beverages with energy drinks on overall alcohol consumption and alcohol-related consequences. In contrast to most previous surveys conducted on this topic, the current survey used a more appropriate within-subject design, comparing the alcohol consumption of individuals who consume alcohol mixed with energy drinks on occasions. Specifically, a comparison was conducted to examine the occasions during which these individuals consume this mixture versus occasions during which they consume alcohol alone. In addition to energy drinks, the consumption of other non-alcoholic mixers was also assessed when combined with alcoholic beverages. Furthermore, the reasons for consuming energy drinks alone or in combination with alcohol were investigated, and were compared to reasons for mixing alcohol with other non-alcoholic beverages. Finally, personality characteristics and the level of risk-taking behavior among the individuals were also assessed to explore their relationship with alcohol consumption. The Utrecht Student Survey will be replicated in the USA, Australia, and the UK. Results will be pooled, but also examined for possible cross-cultural differences.
Introduction
The current debate on young adult alcohol consumption and its related consequences has recently been focusing on energy drink consumption as well. Energy drinks are non-alcoholic beverages which contain ingredients to improve cognitive and physical performance, increase alertness, and reduce sleepiness.Citation1 One of the characteristic ingredients in energy drinks responsible for these effects is caffeine. Among the most popular energy drink brands, the average amount of caffeine equals 80 mg per 250 mL. The stimulating effects of energy drinks may explain the increasing popularity of these beverages, especially among young adults. In fact, both alcohol and caffeinated beverages have long been consumed, either alone or in combination (eg, rum and cola).
Recent concerns have been raised regarding mixing alcohol with energy drinks.Citation2,Citation3 These concerns suggest that the mixing of alcohol with energy drinks (AMED) might lead to a reduced perception of alcohol intoxicationCitation4 and to increased alcohol consumption.Citation5–Citation7 Rationale for these concerns comes from the hypothesis that the stimulant effects of caffeine might counteract the sedative effects of alcohol. This would result in AMED consumers allegedly feeling less impaired and less intoxicated, and therefore being more likely to take risks, such as driving a car while intoxicated. However, experimental data to support this hypothesis is either lacking or of poor quality.Citation1 Several surveys examined the effects of mixing energy drinks with alcohol. These surveys were conducted among students, and reported that between 6% and 40% of students confirmed consuming AMED at least once.Citation7–Citation9 Most studies have presented significant correlations between energy drink and alcohol consumption, and reported that those who consumed AMED generally consumed more alcohol and experienced more alcohol-related consequences (eg, driving while intoxicated) than those who consumed alcohol alone.Citation10,Citation11 Other researchers have questioned the methodology of these surveys and the interpretation of the results.Citation1,Citation12,Citation13
The most important limitation of the current research is that AMED consumers have been compared with those who consume alcohol alone. Although this between-group comparison seems logical at first, it does not reveal any information about the possible role that energy drinks play in affecting overall alcohol consumption or its related consequences. Even when AMED individuals consumed more alcohol, this does not imply that mixing alcohol with energy drinks causes increased alcohol consumption. By only comparing AMED consumers with those who consume alcohol alone, it cannot be established whether mixing alcohol with energy drinks has any effect on total alcohol consumption. In fact, the two groups may differ from each other across a number of variables that are likely to explain the observed differences in the frequency and quantity of alcohol consumption.
Some studies have noted that energy drink consumption has been related to an individual’s identity of being a ‘jock’ (a sport-related identity), dominant masculine norms, and levels of risk-taking behavior.Citation14 Underlying personality characteristics such as an increased level of risk-taking behavior may be reflected in the general behavior of an individual, including alcohol and substance abuse.Citation15 Indeed, scientific literature shows that personality aspects play an important role in determining alcohol consumption patterns.Citation16–Citation18 Therefore, it is important to determine whether energy drink consumption is yet another expression of a high-risk behavior lifestyle. This seems plausible since energy drink marketing strategies are sometimes linked to extreme or risky sports, which appeal to individuals who are more apt to engage in high-risk behaviors. The only way to verify this and to establish whether AMED increases overall alcohol consumption is to conduct studies using a within-subjects design.
In contrast to comparing those who consume AMED to those who consume alcohol alone, within-subjects designs look exclusively at those who occasionally consume AMED. Among these AMED consumers, it is possible to compare the occasions during which they consumed AMED versus the occasions during which they consumed alcohol alone. Another important advantage of a within-subjects design is that if a sufficient sample size is obtained, the actual response rate of the survey is of minor concern. As long as the sample of participants chosen for a given study reflects the basic demographics and characteristics of the overall population, a large enough sample size with adequate power for the statistical analyses is sufficient to yield reliable results.
Previous research has generally not adopted this approach. Until now, only two studies presented the results of within-subjects comparisons.Citation19,Citation20 Price et alCitation19 reported that subjects consumed significantly more alcohol when consuming AMED when compared to occasions during which they consumed alcohol alone; however, this study was conducted with a sample size that was too small (n = 10) to draw reliable conclusions. Moreover, although the discussion and conclusions of the paper by Woolsey et alCitation20 only took into account the between-group comparison (groups of AMED versus alcohol alone), the within-subjects comparison within the AMED group revealed important results that support the idea that: (1) the groups differ from each other across critical characteristics (eg, alcohol consumption when not mixing) that do not allow for a valid comparison; and (2) mixing alcohol with energy drinks does not increase overall alcohol consumption. These results suggest that when mixing energy drinks with alcohol, AMED consumers drink significantly less alcohol compared to occasions when they only consume alcohol. Since the within-subjects comparison by Woolsey et alCitation20 was performed in a relative small sample of AMED consumers (n = 150), future surveys with a larger sample size are needed to confirm these findings. Therefore, the primary aim of the current survey is to conduct a within-subjects comparison within the AMED group to determine if alcohol consumption and its associated consequences differ when these individuals consume AMED or alcohol alone.
Another important aspect that warrants investigation is determining the reasons for mixing non-alcoholic beverages with alcohol. Interestingly, research has focused almost exclusively on the effects of mixing alcohol with energy drinks, whilst other caffeinated beverages, well known to be mixed with alcohol (eg, colas), did not receive this same attention. An on-premise study (ie, conducted in bar settings) showed that many more students mixed alcohol with colas than with energy drinks,Citation11,Citation21 and therefore suggested that the single focus on energy drinks may be limiting; however, this should be verified by research comparing energy drink consumption with other popular mixers. Current information on mixing energy drinks with alcohol is limited and incomplete,Citation4 and comparisons with other popular mixers have not been conducted. It is also of interest to determine if particular reasons for mixing (eg, “to prevent getting drunk”) result in increased alcohol consumption overall when compared to other reasons (eg, “because I like the taste”). There can be many reasons for preferring a specific mixer, for example whether the drink is caffeinated or contains sugar or not. However, it seems unlikely that the type of mixer has an impact on the total amount of alcohol consumed. The current survey aims to verify this hypothesis.
Given the limitations of previous surveys that have assessed mixing energy drinks with alcohol, an extensive online survey was developed and conducted in The Netherlands. The aims of this survey were: (1) to examine alcohol consumption and its consequences when consumed alone or when mixed with energy drinks or other mixers (using a within-subjects design); (2) to determine the reasons behind mixing alcohol with energy drinks and other beverages; and (3) to determine individuals’ personality characteristics and their level of risk-taking behavior in order to predict alcohol consumption and its consequences.
The Utrecht Student Survey will be replicated in the USA, Australia, and the UK. Data will be pooled and analyzed for potential cross-cultural differences. This is important since it has been argued that cultures around the world may differ in terms of their drinking behaviors. For example, findings from Australia may not accurately reflect the situation in the USA, nor can the findings be simply extrapolated to other continents. Cultures are known to have different drinking habits, and the social acceptability of alcohol consumption may differ significantly between them. However, since this survey uses a within-subjects design, it is hypothesized that the results obtained in The Netherlands will be significantly different from those obtained in the USA, Australia, and the UK.
Hypotheses
Given the current scientific evidence available, it is hypothesized that:
There is no difference in the total frequency and quantity of alcohol consumption, and alcohol-related negative consequences when alcohol is consumed alone or when mixed with energy drinks.
Other beverages such as colas are more popular as a mixer for alcohol than energy drinks.
Different reasons for mixing alcohol with energy drinks may result in different overall frequency and quantity of alcohol consumption.
The level of risk-taking behavior is related to the frequency and quantity of alcohol consumption.
In addition to the first part of the survey, a second part of the survey contained three questionnaires: the Depression Anxiety Stress Scale-21 (DASS-21),Citation22,Citation23 the Toronto Alexithymia Scale-20 (TAS-20),Citation24,Citation25 and the Persons Relating to Others Questionnaire 3 (PROQ3).Citation26,Citation27 The second part does not focus on energy drink consumption, but rather aims to explore the general relationship between personal characteristics and alcohol consumption. The DASS-21 assesses negative emotional symptoms, depression, anxiety, and stress. The TAS-20 measures alexithymia, which refers to people who have trouble identifying and describing emotions and who tend to minimize emotional experiences and focus attention externally. The PROQ3 measures how an individual relates both negatively and positively to others.
It was hypothesized that:
Stress, anxiety, and depression, as measured with the DASS-21, are positively related to total alcohol consumption.Citation28
The degree of alexithymia is positively related to the total frequency and quantity of alcohol consumption; this effect should also be observed when controlling for stress, anxiety, and depression.Citation29
Negatively relating to others is predictive of total alcohol consumption; this effect should also be observed when controlling for stress, anxiety, and depression.
Methods
An online survey consisting of two parts was conducted between June 6, 2011 and June 16, 2011. To decrease the likelihood of a non-response bias, participants were offered an incentive to enter a draw for a chance to win monetary prizes upon completion of Part 1 and again after completion of Part 2. In Part 1, monetary prizes included 1 × 500 euros, and 10 × 50 euros, and in Part 2, monetary prizes included 1 × 250 euro and 20 × 25 euros. The survey was set up using SurveyMonkey® (Palo Alto, CA), a company that offers online software to design and collect data from surveys.
Participants
All 70,000 students from the Utrecht University and the College of Utrecht (Hogeschool Utrecht) in Utrecht, The Netherlands, were invited by email to complete the survey. The boards of Utrecht University and the College of Utrecht agreed to distribute the invitation email to all their students, so the researchers did not have access to the email listings. A response-rate of 10% to 15% was anticipated.Citation30 Participants were included if they were 18–30 years old, and provided informed consent. Participation was anonymous and voluntary.
Part 1
To participate in Part 1, students had to provide informed consent on the introductory page of the survey. The first part of the survey assessed demographic data, as well as participants’ use of medication, drugs, and tobacco products. Following the demographic questions, participants were asked to answer a number of questions related to alcohol, energy drink, or mixed drink consumption. Depending on each participant’s drinking behavior, these questions were asked when they (1) consumed alcohol alone; (2) mixed alcohol with energy drinks; and (3) mixed alcohol with other beverages. Negative consequences related to specific drinking preferences were investigated using the Brief Young Adult Alcohol Consequences Scale (BYAACQ). Citation31,Citation32 Finally, levels of general risk-taking were evaluated with the RT-18 risk-taking questionnaire. Citation15 The amount of time needed to complete Part 1 varied (between approximately 5 and 20 minutes) depending on each participant’s drinking behavior.
Demographics
Participants were asked to indicate their sex, age, weight, height, whether they were members of a fraternity or sorority, current study phase (bachelor/master), and the number of study credit points obtained in the prior year. Furthermore, medication use, medical conditions, smoking, and drug use were assessed.
Based on their drinking behavior, participants could be classified as:
No alcohol, no energy drinks (NANED).
No alcohol, energy drinks only (EDO).
Alcohol only, no energy drinks (AO).
Alcohol and energy drinks, but not mixed (AED).
AMED.
Mixing was defined as the consumption of energy drinks or other non-alcoholic beverages either 2 hours before or 2 hours after drinking alcohol, which represents a conservative definition of ‘mixing’.Citation20
Consumption questions
Consumption questions were standard questions that investigated the subject’s consumption habits (frequency and quantity) considering the particular drink in question, with a focus on beverage consumption in the past 30 days. These questions were adapted from the Quick Drinking Screen (QDS). The QDS contains four consumption questions that have been shown to be highly reliable and consistent when compared to the 12-month Timeline Followback method.Citation33,Citation34 The QDS was also employed by Woolsey et al.Citation20 If applicable, the consumption questions were asked for consuming AO, consuming AMED, and for mixing alcohol with other non-alcoholic beverages. The consumption questions are listed in . Regarding the other non-alcoholic mixers, participants had to choose the one mixer they usually preferred. They had the choice between eight mixers that are popular in The Netherlands, including cola, diet cola, orange-flavored carbonated soft drink, blackcurrant-flavored carbonated soft drink, lemon soda, tonic water, orange juice, and apple juice. Participants then completed the consumption questions concerning the preferred mixer they chose. Finally, if applicable, participants were required to report their reasons for: (1) consuming energy drinks alone; (2) mixing alcohol with energy drinks; and (3) mixing alcohol with other non-alcoholic beverages (ie, the non-alcoholic beverage they preferred). summarizes the questions surrounding the reasons and motivations involved with energy drink consumption, as well as the reasons for mixing alcohol with energy drinks or other mixers. Participants could report multiple reasons and add additional motives behind their beverage consumption patterns.
Table 1 Consumption questions
Table 2 Reasons for consumption
Brief Young Adult Alcohol Consequences Scale (BYAACQ)
To study alcohol related negative consequences, the Dutch version of the BYAACQ was included. The BYAACQ consists of 24 possible consequences of alcohol consumption that can be answered with ‘yes’ or ‘no’ answers, depending on whether or not the statement was applicable to the subject within the past year.Citation31 The Dutch BYAACQ has a high reliability and validity;Citation32 Cronbach’s alpha was 0.816, and BYAACQ scores were significantly correlated with Alcohol Use Disorders Identification Test Primary Care scoresCitation45 (r = 0.747). In addition, BYAACQ scores were significantly correlated (P < 0.01) with various drinking variables, including age when the participant first began drinking (r = −0.23), number of days per week during which the participants consume alcohol (r = 0.49), number of alcoholic drinks per week (r = 0.63), and number of drinks consumed on a regular night out (r = 0.63).Citation32 The outcome score ranges from 0 to 24. Depending on each participant’s specific drinking behavior, the BYAACQ was completed for consumption of AO, AMED consumption, and for mixing alcohol with other non-alcoholic beverages.
RT-18
The RT-18 risk-taking questionnaireCitation15 was developed from subscale items on impulsiveness and venturesomeness that were taken from the Impulsiveness-Venturesomeness- Empathy questionnaire;Citation35,Citation36 items on novelty-seeking from the Temperament and Character Inventory,Citation37,Citation38 and items on impulsive sensation seeking from the Zuckerman Kuhlman Personality Questionnaire.Citation39 Questions on the RT-18 can be answered with ‘yes’ or ‘no’ answers. Participants could receive either zero or one point per question, and scores across all items could be added up to a total score ranging from 0 (no risk-taking) to 18 (extreme risk-taking). The RT-18 examines two factors: risk-taking and risk assessment. All participants completed the RT-18.
Part 2
Part 2 of the survey assessed personality aspects using the DASS-21,Citation22 the TAS-20,Citation25,Citation40 and the PROQ-3.Citation27 To participate in Part 2, students had to provide informed consent on the introductory page of the survey. Part 2 took between 10 and 20 minutes to complete. Data from Parts 1 and 2 were matched together.
DASS-21
The DASS-21 was used to assess negative emotional symptoms. The DASS-21 is a short version of the DASS questionnaire, which is a self-report instrument that quantitatively measures distress along the axes of three subscales: depression, anxiety (symptoms of psychological arousal), and stress (the more cognitive, subjective symptoms of anxiety).Citation22,Citation23,Citation41 This is not a categorical measure of clinical diagnosis. Subjects can respond to statements in the form of a zero to three point Likert scale to indicate at what level the stated information applied to them in the past week.
TAS-20
The 20-item TAS is most widely used to measure alexithymia.Citation24,Citation40 The TAS-20 has three subscales: (1) the Difficulty Describing Feelings subscale to measure difficulty describing emotions (5 items); (2) the Difficulty Identifying Feeling subscale to measure difficulty identifying emotions (7 items); and (3) the Externally-Oriented Thinking subscale to measure the tendency of individuals to focus their attention externally (8 items). Items are rated using a five-point Likert scale whereby 1 = strongly disagree and 5 = strongly agree. The total alexithymia score is the sum of responses to all 20 items, while the score for each subscale factor is the sum of the responses in that subscale. A widely used TAS-20 cutoff score is 61, which means that participants scoring 61 or above are described as alexithymic; however, alexithymia is predominantly seen as a dimensional personality trait.
PROQ3
The PROQCitation26 is a 96-item, self-administered questionnaire, with 12 items contributing to each of the eight scales, which corresponds to each octant of the interpersonal octagon. The scales of the PROQ, named after the octants of the interpersonal octagon, are called upper neutral, upper close, neutral close, lower close, lower neutral, lower distant, neutral distant, and upper distant. Of the 12 items, two refer to positive relating, and the other 10 to negative relating. There are four options for each item, providing a score range of zero to three. Thus for each octant scale, the score range is 0 to 30, and the total score (combining the scores for each scale) can reach a maximum of 240. In 1995, a revised version of the PROQ was produced, called the PROQ3.Citation27 The PROQ3 is a shorter version (48 items) of the PROQ and takes half the time to complete. It also includes some new items, especially within the upper close scale.
Validity and representativeness of the sample
The survey had to be completed via the internet. Participants had to complete the survey within a timeframe of 10 days after receiving the invitation email. Although in some countries internet access may still be limited, this is not the case for The Netherlands. In 2008, 99% of the population between the ages of 15 and 35 years old had access to the internet,Citation42 and all of them reported having used the internet during the past three months. Given these percentages, limited internet access is not an issue that may cause any coverage errors. In order to prevent sampling errors, all Utrecht students (approximately 70,000) were invited to complete the survey, rather than drawing a random sample of participants. This increased the chances of having a final data set with a sufficient sample size to conduct analyses within the AMED group. This was also important considering that the survey was accessible by participants for 10 days. In order to increase the response rate (and thus decrease the risk of non-response bias), a prize drawing was held among those participants who completed the survey. It should be noted that in addition to the email invitation, two teams of recruiters approached students at campuses distributing flyers to remind the students to complete the survey. To test whether the respondents were representative of the whole population of Utrecht students, demographic variables (age and gender) of the 70,000 students were compared with the obtained sample (see the Results section).
The following actions were undertaken to clean the data set. Certain criteria had to be met by participants in order to be included in the final dataset. First, the participants had to be between 18 and 30 years of age. In order to be able to classify the subjects as part of a specific group (no alcohol, no energy drinks; energy drinks only; AO; AED; or AMED) the main questions regarding the consumption of alcohol, energy drinks, and other mixers had to be completed. Finally, at the end of each part of the survey, participants were asked if they answered all question truthfully. A negative answer to this question also resulted in exclusion.
Ethical considerations
After clicking the link in the email, the first page comprised a short description of the purpose and content of the survey. It was stated that participation was voluntary, that all information would be treated as confidential and that participants remained anonymous. By using a click-box participants had to give informed consent in order to proceed to the start page of the survey. The Medical Ethical Review Board Twente reviewed and approved the study protocol. The study received financial support from Red Bull GmbH (Fuschl am See, Austria). The company was not involved in the collection and analysis of the data or in the interpretation and publication of the results. On the final page of the survey, participants were referred to the website of the Trimbos Institute if they chose to receive information about alcohol and drug use.
Sample size
The aim of this survey was to recruit at least 1000 students who sometimes combine alcohol with energy drinks. Based on the results from a recent online survey at Utrecht UniversityCitation30 it was expected that the response rate needed to be at least 10% (n = 7000). Based on previous researchCitation7,Citation43 it was estimated that about 15% to 20% of respondents (n = 1250) would have mixed alcohol with energy drinks during the past month. Taking into account incomplete surveys and surveys excluded for other reasons, the anticipated response rate appeared to be sufficient to recruit N = 1000 students who combined alcohol and energy drinks during the past month. This sample size was also sufficient to compare total alcohol consumption on occasions when they do and do not mix alcohol with energy drinks within a 3% margin of error.
Results
Response rate and final data set
Approximately 70,000 students received the email containing the link to the online survey. A total of 7158 students opened the link to the survey provided by email. This yielded a response rate of 10.2%. An overview of participants that were included in the final data set and those that were excluded is given in .
Figure 1 Flowchart of the survey with group sizes and exclusions.
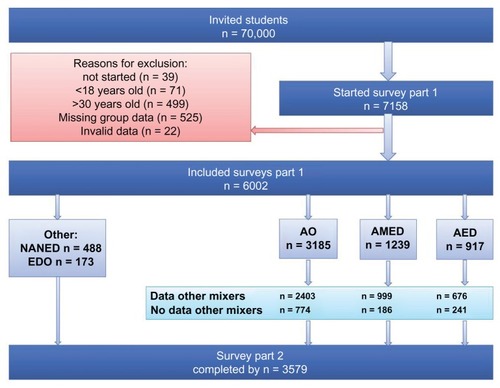
A total of 39 students did not agree to participate in the study after reading the informed consent page and were subsequently excluded from the study. Among the remaining participants, 570 were excluded because of their age (71 were younger than 18 years, 499 were older than 30 years), and 525 subjects did not answer the questions that were necessary to classify them as part of one of the drinking groups. And finally, 22 subjects stated that they did not answer the questions truthfully. Of the 7158 students who started the survey, 6002 completed Part 1 of the survey (83.2%). The valid, complete dataset is thus based on 6002 subjects.
From the 6002 included participants that completed Part 1, 1361 were not willing to participate in Part 2 of the survey. Another 54 participants did not agree with the informed consent presented to them in Part 2. A total of 1008 participants did not answer all questions in Part 2. Thus, 3579 participants successfully completed Part 2.
Obtained group sample sizes
The following groups could be identified:
No alcohol, no energy drinks (NANED), n = 488.
No alcohol, energy drinks only (EDO), n = 173.
AO, n = 3185.
AED, n = 917.
AMED, n = 1239.
The AO group was comprised of 3185 participants, of whom 2403 reported to occasionally mix alcohol with non-alcoholic beverages other than energy drinks. From the subjects who stated that they consumed both alcohol and energy drinks, but never combined these (AED group, n = 917), 676 reported that they occasionally mixed alcohol with other non-alcoholic beverages. A subset (n = 999) of the AMED group (n = 1239), claimed that they also occasionally mixed alcohol with other non-alcoholic beverages (ie, beverages that were not energy drinks). These numbers are visualized in .
Since subjects could refuse to answer a particular question, some discrepancies between the group numbers may have occurred.
Representativeness of the sample
The final dataset was comprised of 6002 students (35.3% male and 64.7% female). Mean age was 21.97 (±2.53) years, mean weight was 69.45 (±12.15) kg, and mean height was 1.75 (±0.09) m. A vast majority (80.3%) of participants reported not being a member of a fraternity or sorority. This data was compared to other available information (age and percentage of participants who are female) about the Utrecht student population.Citation44 Unfortunately the report did not provide sufficient data to statistically compare its data with that of the current survey. However, it becomes evident that the characteristics of the current sample that completed the survey reflect those of the general student population at Utrecht University.
Conclusion
The Utrecht Student Survey provided a valid and reliable dataset with a sufficient sample size to address the hypotheses about alcohol consumption and the impact of mixing alcohol with energy drinks or other non-alcoholic beverages, using a within-subjects design.
Author contributions
All authors contributed to designing the study, writing the protocol, and conducting data analyses. Lydia de Haan and Joris Verster wrote the draft article. All authors read and approved the final manuscript.
Disclosure
This survey was supported by a grant from Red Bull GmbH (Fuschl am See, Austria). Red Bull GmbH was not involved in the design and implementation of the study; with the collection, management, analysis, and interpretation of the data; or with preparation of the manuscript. Joris Verster has received research support from Takeda Pharmaceuticals and Red Bull GmbH, and was scientific advisor for Takeda, Sanofi-Aventis, Transcept, Sepracor, Red Bull GmbH, Deenox, Trimbos Institute, and CBD. Berend Olivier is a scientific advisor for Emotional Brain BV and has received research support from Emotional Brain, PsychoGenics Inc, Sepracor, Servier, Abbott, and the Dutch Brain Research Organization. The other authors have no potential conflicts of interest to disclose.
References
- VersterJCAufrichtCAlfordCEnergy drinks mixed with alcohol: misconceptions, myths, and factsInt J Gen Med2012518719822399863
- ArriaAMO’BrienMCThe “high” risk of energy drinksJAMA2011305660060121266673
- ReissigCJStrainECGriffithsRRCaffeinated energy drinks – a growing problemDrug Alcohol Depend2009991–311018809264
- MarczinskiCAAlcohol mixed with energy drinks: consumption patterns and motivations for use in US college studentsInt J Environ Res Pub Health2011883232324521909303
- ArriaAMCaldeiraKMKasperskiSJIncreased alcohol consumption, nonmedical prescription drug use, and illicit drug use are associated with energy drink consumption among college studentsJ Addict Med201042748020729975
- ArriaAMCaldeiraKMKasperskiSJVincentKBGriffithsRRO’GradyKEEnergy drink consumption and increased risk for alcohol dependenceAlcohol Clin Exp Res201135236537521073486
- O’BrienMCMcCoyTPRhodesSDWagonerAWolfsonMCaffeinated cocktails: energy drink consumption, high-risk drinking, and alcohol-related consequences among college studentsAcad Emerg Med200815545346018439201
- BracheKStockwellTDrinking patterns and risk behaviors associated with combined alcohol and energy drink consumption in college drinkersAddict Behav201136121133114021840130
- MalinauskasBMAebyVGOvertonRFCarpenter-AebyTBarber- HeidalKA survey of energy drink consumption patterns among college studentsNutr J200763517974021
- PenningRde HaanLVersterJCCaffeinated drinks, alcohol consumption, and hangover severityThe Open Neuropsychopharmacology Journal201143639
- RossheimMEThombsDLArtificial sweeteners, caffeine, and alcohol intoxication in bar patronsAlcohol Clin Exp Res201135101891189621554335
- SkeenMPGlennLLImaginary link between alcoholism and energy drinksAlcohol Clin Exp Res20113581375137621651587
- VersterJCAlfordCUnjustified concerns about energy drinksCurr Drug Abuse Rev2011411321466503
- MillerKEWired: energy drinks, jock identity, masculine norms, and risk takingJ Am Coll Health200856548149018400659
- De HaanLKuipersEKuertenYvan LaarMWOlivierBVersterJCThe RT-18: a new screening tool to assess young adult risk-taking behaviorInt J Gen Med2011457558421887111
- GunnRLSmithGTRisk factors for elementary school drinking: pubertal status, personality, and alcohol expectancies concurrently predict fifth grade alcohol consumptionPsychol Addict Behav201024461762720822192
- HosierSGCoxWMPersonality and motivational correlates of alcohol consumption and alcohol-related problems among excessive drinking university studentsAddict Behav2011361–2879420875705
- IbáñezMIMoyaJVillaHMezquitaLRuiperezMOrtetGBasic personality dimensions and alcohol consumption in young adultsPersonality and Individual Differences2010482171176
- PriceSRHilcheyCADarredeauCFultonHGBarrettSPEnergy drink co-administration is associated with increased reported alcohol ingestionDrug Alcohol Rev201029333133320565526
- WoolseyCWaigandtABeckNCAthletes and energy drinks: reported risk-taking and consequences from the combined use of alcohol and energy drinksJ Appl Sport Psychol20102216571
- ThombsDLO’MaraRJTsukamotoMEvent-level analyses of energy drink consumption and alcohol intoxication in bar patronsAddict Behav201035432533019954894
- De BeursEVan DyckRMarquenieLALangeABlonkRWBDe DASS: een vragenlijst voor het meten van depressie, angst en stressGedragstherapie2001343553
- LovibondPFLovibondSHThe structure of negative emotional states: comparison of the Depression Anxiety Stress Scales (DASS) with the Beck Depression and Anxiety InventoriesBehav Res Ther19953333353437726811
- BagbyRMParkerJDTaylorGJThe twenty-item Toronto-Alexithymia- Scale – I. Item selection and cross-validation of the factor structureJ Psychosom Res199438123328126686
- BagbyRMTaylorGJParkerJDADickensSEThe development of the Toronto Structured Interview for Alexithymia: item selection, factor structure, reliability and concurrent validityPsychother Psychosom2006751253916361872
- BirtchnellJFalkowskiJSteffertBThe negative relating of depressed patients: a new approachJ Affect Dis19922431651761573125
- BirtchnellJShineJPersonality disorders and the interpersonal octagonBr J Med Psychol200073Pt 443344811140786
- BucknerJDEckerAHProctorSLSocial anxiety and alcohol problems: the roles of perceived descriptive and injunctive peer normsJ Anxiety Disord201125563163821382688
- ThorbergFAYoungRMSullivanKALyversMAlexithymia and alcohol use disorders: a critical reviewAddict Behav200934323724519010601
- VersterJCKuertenYOlivierBVan LaarMWThe ACID-survey: methodology and design of an online survey to assess alcohol and recreational cocaine use and its consequences for traffic safetyThe Open Addiction Journal201032431
- KahlerCWStrongDRReadJPToward efficient and comprehensive measurement of the alcohol problems continuum in college students: the brief young adult alcohol consequences questionnaireAlcohol Clin Exp Res20052971180118916046873
- VersterJCHerwijnenJOlivierBKahlerCWValidation of the Dutch version of the brief young adult alcohol consequences questionnaire (B-YAACQ)Addict Behav200934541141417942242
- RoyMDumMSobellLCComparison of the quick drinking screen and the alcohol timeline followback with outpatient alcohol abusersSubst Use Misuse200843142116212318825590
- SobellLCAgrawalSSobellMBComparison of a quick drinking screen with the timeline followback for individuals with alcohol problemsJ Stud Alcohol200364685886114743950
- EysenckSBGPearsonPREastingGAllsoppJFAge norms for impulsiveness, venturesomeness and empathy in adultsPers Individ Dif198565613619
- LijffijtMCaciHKenemansJLValidation of the Dutch translation of the I7 questionnairePers Individ Dif200538511231133
- CloningerCRSvrakicDMPrzybeckTRA psychobiological model of temperament and characterArch Gen Psychiatry199350129759908250684
- DuijsensIJSpinhovenPGoekoopJGSpermonTEurelings- BontekoeEHMThe Dutch temperament and character inventory (TCI): dimensional structure, reliability and validity in a normal and psychiatric outpatient samplePers Individ Dif2000283487499
- ZuckermanMKuhlmanDMJoiremanJTetaPKraftMA comparison of three structural models for personality: The Big Three, the Big Five, and the Alternative FiveJ Pers Soc Psychol1993654757768
- BagbyRMTaylorGJParkerJDThe twenty-item Toronto Alexithymia- Scale – II. Convergent, discriminant, and concurrent validityJ Psychosom Res199438133408126688
- HenryJDCrawfordJRThe short-form version of the Depression Anxiety Stress Scales (DASS-21): construct validity and normative data in a large non-clinical sampleBr J Clin Psychol200544Pt 222723916004657
- Statline DatabankStatistics Netherlands Retrieved Jun 2012 from http://statline.cbs.nl/statweb/
- MillerKEEnergy drinks, race, and problem behaviors among college studentsJ Adolesc Health200843549049718848678
- Van den HeuvelABosGDStudenten Woon Monitor UtrechtStudents housing monitor2011 Available at http://sscweb.hku.nl/clk/show/id=345036Accessed 12 June 2012 (Dutch)
- BaborTFHiggins-BiddleJCSaundersJBMonteiroMGAUDIT: The Alcohol Use Disorders Identification Test: Guidelines for Use in Primary Caresecond edition Retrieved October 10, 2012. http://whqlibdoc.who.int/hq/2001/WHO_MSD_MSB_01.6a.pdf