Abstract
Background
Athletes intending to compete in Ironman Hawaii need to qualify in an age-group based qualification system. We compared participation and top ten performances of athletes in various age groups between Ironman Hawaii and its qualifier races.
Methods
Finishes in Ironman Hawaii and in its qualifier races in 2010 were analyzed in terms of performance, age, and sex. Athletes were categorized into age groups from 18–24 to 75–79 years and split and race times were determined for the top ten athletes in each age group.
Results
A higher proportion of athletes aged 25–49 years finished in the qualifier races than in Ironman Hawaii. In athletes aged 18–24 and 50–79 years, the percentage of finishes was higher in Ironman Hawaii than in the qualifier races. For women, the fastest race times were slower in Ironman Hawaii than in the qualifier races for those aged 18–24 (P<0.001), 25–29 (P<0.05), and 60–64 (P<0.05) years. Swim split times were slower in Ironman Hawaii than in the qualifier races for all age groups (P<0.05). Cycling times were slower in Ironman Hawaii for 18–24, 25–29, 40–44, 50–54, and 60–64 years (P<0.05) in age groups. For men, finishers aged 18–24 (P<0.001), 40–44 (P<0.001), 50–54 (P<0.01), 55–59 (P<0.001), 60–64 (P<0.01), and 65–69 (P<0.001) years were slower in Ironman Hawaii than in the qualifier races. Swim split times were slower in Ironman Hawaii than in the qualifier races for all age groups (P<0.05). Cycling times were slower in Ironman Hawaii for those aged 18–24 and those aged 40 years and older (P<0.05).
Conclusion
There are differences in terms of participation and performance for athletes in different age groups between Ironman Hawaii and its qualifier races. Triathletes aged 25–49 years and men generally were underrepresented in Ironman Hawaii compared with in its Ironman qualifier races. These athletes may have had less chance to qualify for Ironman Hawaii than female athletes or younger (<25 years) and older (>50 years) athletes.
Introduction
The Ironman triathlon involves 3.8 km (2.4 miles) of swimming, 180 km of (112 miles) cycling, and 42.2 km (26.2 miles) of running and is considered one of the most challenging ultra-endurance events in the world.Citation1 The Ironman triathlon originated in 1977 in Hawaii, USA, and combined into one event the three toughest endurance races held in Hawaii – the 2.4-mile Waikiki Roughwater Swim, the 112-mile Around-O’ahu Bike Race, and the 26.2-mile Honolulu Marathon.Citation2 The very first Ironman was held in 1978 in Honolulu, Hawaii. Twelve men started and the winner finished the race in 11 hours and 46 minutes. The first women competed in the Ironman Hawaii in 1978 and finished in 12 hours and 55 minutes. In 1981, the course was moved to Kailua-Kona, Hawaii, where it is still held.Citation3
Ironman Hawaii is the official Ironman World Championship.Citation2 Each year, around 50,000 triathletes compete in 24 Ironman and five half-Ironman triathlons throughout the world.Citation4 Most participants in the qualifiers intend to earn one of the 1900 start tickets for the Ironman World Championship, which is held every October. In the qualifier races, participants must obtain a start place in Ironman Hawaii within an age group in an age group-based classification system.Citation4 In each race and each category, the final start place allocation is intended to be representative of the actual number of age group starters. For example, when 8% of the age-group starters in a qualifier are women in the age group 40–44 years, 8% of the start places for Ironman Hawaii are allocated to women in the 40–44 years age group. Aside from this method of gaining entry, some athletes obtain entry for Ironman Hawaii by being selected in the Ironman Lottery Program or by winning a start place through Ironman’s charitable eBay auction.Citation4
However, even if a remarkable number of triathletes compete each year in each age group, it is unknown whether the age group-based qualification system selects the top athletes in each age group fairly. Other important sport events, such as the World Championships or Olympic Games, use a nation-based qualification system that allows the best athletes from each competing nation to qualify to start.
The long duration of Ironman Hawaii and the difficult race conditions due to the environmental conditions in the country make it one of the most challenging endurance events, even one of the most demanding Ironman triathlons, in the world.Citation1 The triathletes have to swim 3.86 km in the Pacific Ocean and wetsuits are prohibited. The swim is followed by a non-drafting cycling time trial over 180 km involving a total climb of ~1400 m. After the bicycle split, athletes have to run a marathon covering 42.2 km. Further, the tropical climate in Hawaii, with temperatures of ~30°C, humidity of ~70%, and crosswinds of up to ~70 km/hour,Citation5 makes the event even more challenging. Generally, high ambient temperatures and wind mainly influence cycling and running performances.Citation1,Citation6–Citation8 Due to these environmental conditions, the course records for both women and men are slower in the Ironman Hawaii than in other Ironman races, even though there is a high number of top athletes in Hawaii. The course record for men in the Ironman Hawaii is 8 hours, 3 minutes, and 56 seconds, which was set by Craig Alexander (Australia) in 2011, while the fastest race time in the Ironman qualifier races is 7 hours, 45 minutes, and 58 seconds, achieved in 2011 by Marino Vanhoenacker (Belgium) in Ironman Austria. The course record in the Ironman Hawaii for women is 8 hours, 54 minutes and, 2 seconds, set by Chrissie Wellington (Great Britain) in 2009, who also achieved the fastest female Ironman race time of 8 hours, 33 minutes, and 56 seconds in Ironman South Africa in 2011.Citation9
The performance development in Ironman triathlons has been analyzed in Ironman Hawaii and in the qualifiers, both in terms of overall performanceCitation1,Citation10,Citation11 and performance of finishers according to age group.Citation12,Citation13 Peak Ironman performance has been attained by male and female participants aged between 25 and 39 years.Citation1,Citation10,Citation11 In terms of age-group finishers, participation increased and performance improved in both a qualifier for Ironman HawaiiCitation13 and in Ironman Hawaii over time.Citation12 However, differences in the participation of master athletes (>35 years) in Ironman qualifiers and Ironman Hawaii exist. Lepers et al investigated the participation of athletes according to age group in Ironman Hawaii between 1986 and 2010. In 1986, master triathletes older than 40 years represented 31% of the overall field for men and 23% of the overall field for women. However, in 2010, master triathletes represented 56% of the overall field for men and 47% of the overall field for women.Citation12 In Ironman Switzerland, a qualifier for Ironman Hawaii, the percentage of master athletes was lower in the period 1995–2010. On average, master triathletes represented 23%, 28%, 37%, and 48% of overall male finishers during the 1995–1998, 1999–2002, 2003–2006, and 2007–2010 periods, respectively.Citation13 Regarding the performance of male triathletes in Ironman Hawaii, no changes occurred across years in the 40–44 years age group, for both split times and overall race times. In contrast, the average performance ratios improved between 1986 and 2010 for participants aged 45–49 and older. Female triathletes older than 40 years improved their swimming, cycling, running, and overall race times.Citation12 In Ironman Switzerland, swim split times for athletes aged 45–49 years decreased. Cycling, running, and overall race times decreased for athletes older than 40–44 years.Citation13
It is not known whether there is a difference in performance in terms of split times and overall race times between Ironman Hawaii and its qualifier races. Differences in performance between the age groups in the Ironman qualifiers and in Ironman Hawaii may influence the selection process to qualify for Ironman Hawaii. Therefore, the two aims of this study were to compare (1) the participation of each sex and age group in the Ironman Hawaii with those in all qualifier races within 1 year and (2) the top ten performances of each age group in the Ironman Hawaii with the top ten performances of each age group in all qualifier races within 1 year. It was expected that the top ten performances of each age group in the Ironman Hawaii would not be different from the performances in the qualifying events, due to the age group-based qualification system for Ironman Hawaii.
Methods
All finishers in 2010 in both the Ironman Hawaii and in all qualifier races were analyzed in terms of age, nationality, and sex. The dataset for this study was obtained from the websites of the races.Citation9 The study was approved by the Institutional Review Board of Ethikkommission, St Gallen, Switzerland; the requirement for participants to give informed consent was waived because the study involved the analyses of publicly available data. Complete data from the qualifier races for Ironman Hawaii were available for 2010 for all Ironman races with exception of the Memorial Hermann Ironman Texas, the Ironman Wales, and the Ford Ironman Cozumel.Citation14 Complete rankings for these three races were not publicly available online and the race directors were not able to provide us with the data needed for analyses. All available data from the other 21 qualifier races were pooled prior to analysis. We focused only on the finishers in the Ironman races, since race times of full and half-Ironman races cannot be compared.
Data analysis
To compare performance in the Ironman World Championship with that in the Ironman qualifier races according to athlete age, all athletes were categorized into one of the following age groups: 18–24, 25–29, 30–34, 35–39, 40–44, 45–49, 50–54, 55–59, 60–64, 65–69, 70–74, and 75–79 years. For each age group, the top ten women and men (ie, those achieving one of the ten fastest overall race times or split discipline times) for both split and overall race times were determined for both Ironman Hawaii and the Ironman qualifier races. An age group was excluded from analysis if it could not provide at least ten men and women in either Ironman Hawaii or the Ironman qualifier races. For women, data were sufficient for all age groups between 18–24 and 60–64 years and, for men, data were sufficient for all age groups between 18–24 and 70–74 years.
Statistical analysis
To increase the reliability of data analyses, each dataset was tested for normal distribution and homogeneity of variances in advance of statistical analyses. Normal distribution was tested using the D’Agostino–Pearson omnibus normality test and homogeneity of variances was tested using Levene’s test in the case of two groups and with Bartlett’s test in the case of more than two groups. To find significant differences between the performance of multiple age groups in Ironman Hawaii and Ironman qualifier races, two-way analysis of variance with subsequent Bonferroni post hoc analysis was performed. To determine the interaction between age and sex in both overall race times and split times, two-way analysis of variance (age group × sex) was used. Statistical analyses were performed using SPSS Statistics (v 19; IBM, Armonk, NY, USA) and GraphPad Prism (v 5; GraphPad Software, La Jolla, CA, USA). Significance was accepted at P<0.05 (two-sided for t-tests). Data in the text are given as mean ± standard deviation.
Results
Data were available for 41,367 athletes in 2010. A total of 1847 athletes – 503 women and 1344 men – finished Ironman Hawaii. In the qualifier races for Ironman Hawaii for that year, 39,518 athletes – 7480 women and 32,038 men – finished.
Participation
The percentage of women overall finishers was higher in Ironman Hawaii (27.2%) than in the Ironman qualifiers (18.9%). The percentage of men overall finishers was higher in the Ironman qualifiers (81.1%) than in the Ironman Hawaii (72.8%) (). Considering the distribution of finishes by nationality, in both Ironman Hawaii and Ironman qualifiers, most finishers originated from the USA, followed by athletes from Germany and Canada (). In Ironman Hawaii, the percentage of female finishes was lower for American and Canadian but higher for German athletes. In contrast, for men, the percentage was higher for American and German but lower for Canadian athletes ().
Figure 1 Percentage distribution of female and male finishers in Ironman Hawaii and in the Ironman qualifier races.
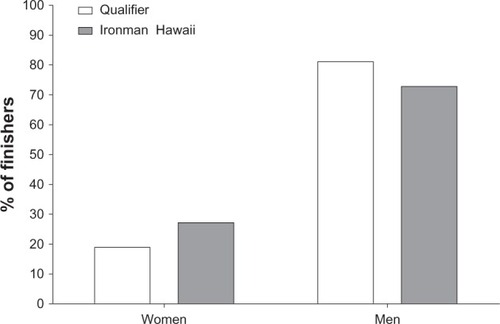
Figure 2 Percentage distributions of female (A) and male (B) finishers per nation in Ironman Hawaii and in the Ironman qualifier races.
Abbreviations: ARG, Argentina; AUS, Australia; AUT, Austria; BEL, Belgium; BRA, Brazil; CAN, Canada; DEN, Denmark; ESP, Spain; FRA, France; GBR, Great Britain; GER, Germany; IRL, Ireland; ITA, Italy; JPN, Japan; MEX, Mexico; NED, The Netherlands; NZL, new Zealand; RSA, Republic of South Africa; SUI, Switzerland.
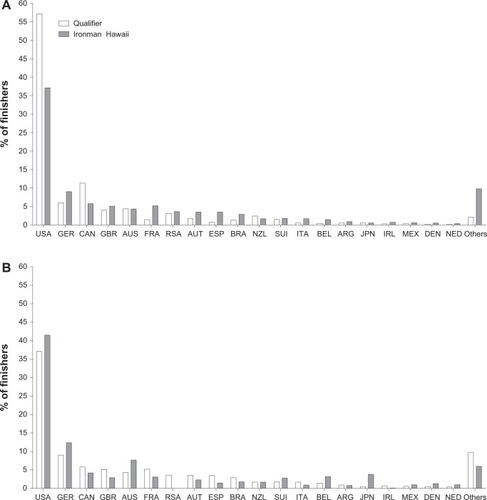
Table 1 Percentage distribution of women and men finishers per nation in the Ironman qualifier races and Ironman Hawaii
The distributions of female and male finishes in age groups in the Ironman qualifier races compared with the Ironman Hawaii are displayed in . For both sexes, age groups between 25 and 49 years showed a higher proportion of finishes in the Ironman qualifier races than in Ironman Hawaii (). In the 18–24 and 50–79 years age groups, the percentage of finishes was higher in Ironman Hawaii than in the Ironman qualifier races for both women and men.
Figure 3 Percentage distribution of female (A) and male (B) finishers per age group in Ironman Hawaii and in the Ironman qualifier races.
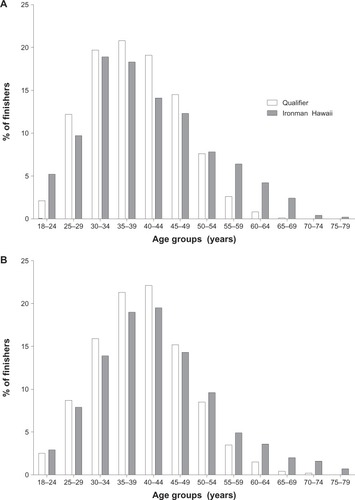
Table 2 Percentage distribution of men and women finishers per age group in the Ironman qualifier races and in Ironman Hawaii
Performance
shows the overall race times for both the Ironman qualifier races and the Ironman Hawaii for the top ten women per age group, while presents the split times for women. The ten fastest overall race times for women were slower in Ironman Hawaii than in the Ironman qualifier races in the 18–24 years (P<0.001), 25–29 years (P<0.05), and 60–64 years (P<0.05) age groups. Swim split times were slower in Ironman Hawaii than in the Ironman qualifier races for all age groups (P<0.05). For women, cycling split times were slower in Ironman Hawaii for athletes finishing in the 18–24, 25–29, 40–44, 50–54, and 60–64 years (P<0.05) age groups than in the other age groups. There was no difference between Ironman Hawaii and its qualifier races in terms of the top ten running performance times, split times in running were slower in Ironman Hawaii for athletes finishing in the age group 18–24 years.
Figure 4 Performance for the top ten women per age group in overall race time in the Ironman qualifier races and in Ironman Hawaii.
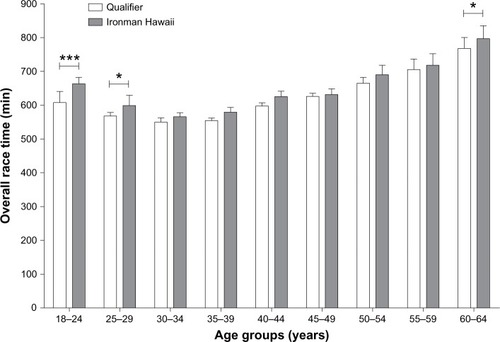
Figure 5 Performance for the top ten women per age group in the swim split (A), the bike split (B), and the run split (C) in the Ironman qualifier races and in Ironman Hawaii.
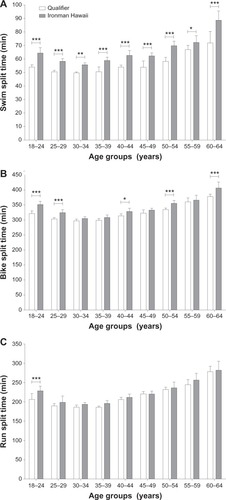
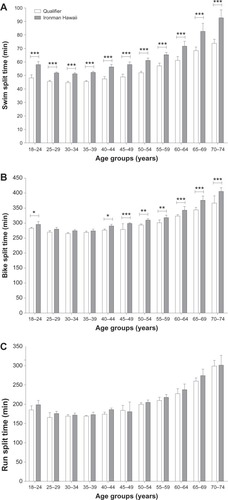
shows the overall race times for the Ironman qualifier races and the Ironman Hawaii for men, while presents the split times for men. Finishers in the 18–24 years (P<0.001), 40–44 years (P<0.001), 50–54 years (P<0.01), 55–59 years (P<0.001), 60–64 years (P<0.01), and 65–69 years (P<0.001) age groups were slower in Ironman Hawaii than in the Ironman qualifier races. Swim split times were slower in Ironman Hawaii than in the Ironman qualifier races for all age groups (P<0.05). Cycling split times were slower in Ironman Hawaii for athletes finishing in the age group 18–24 years and for all athletes aged 40 years and older (P<0.05). There was no difference between Ironman Hawaii and its qualifier races in terms of the top ten running performance times (P>0.05).
Figure 6 Performance for the top ten men per age group in overall race time in the Ironman qualifier races and in Ironman Hawaii.
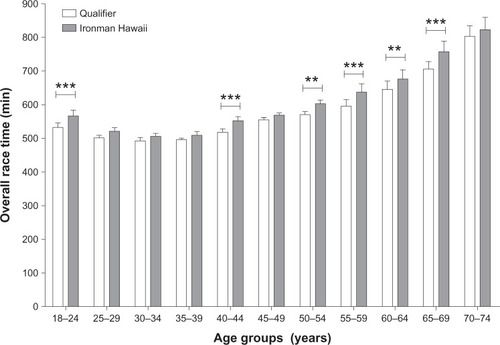
Figure 7 Performance for the top ten men per age group in the swim split (A), the bike split (B), and the run split (C) in the Ironman qualifier races and in Ironman Hawaii.
Interaction analyses showed a significant age effect for both women and men for overall race times and split times (P<0.0001). Additionally, a significant sex effect for both women and men for overall race times and split times was found (P<0.0001).
Discussion
This study intended to compare the participation and performance in age-group finishers between the Ironman Hawaii and its Ironman qualifier races within 1 year, and to compare the top ten performances in Ironman Hawaii with the top ten performances in the Ironman qualifier races for each age group. It was hypothesized that the top ten performances of each age group in Ironman Hawaii would not be different from the performances in the Ironman qualifying events, due to the age group-based qualification system for Ironman Hawaii.
There were six main findings. First, female finishers were overrepresented and male finishers underrepresented in Ironman Hawaii compared with in the Ironman qualifiers. Second, there was a higher proportion of finishes in the 25–49 years age group in the Ironman qualifier races than in Ironman Hawaii. Further, women aged 30–59 years and men aged 25–39, 45–49, and 70–74 years were able to achieve the same race times in both the Ironman qualifiers and Ironman Hawaii. We also found that swim split times were slower in Ironman Hawaii for women and men in all age groups and that bike split times were slower for women and men in younger (18–29 and 18–24 years) and older (40–44, 50–54, 60–64 years) age groups than in the other age groups. Finally, in Ironman Hawaii, run split times were slower for women aged 18–24 years.
Differences in the finishes between Ironman Hawaii and the qualifiers
Women were overrepresented and men underrepresented in Ironman Hawaii compared with in the Ironman qualifiers. Additionally, there was a higher proportion of finishers from the 25–49 years age groups in the Ironman qualifier races than in Ironman Hawaii. There was also a difference in terms of finisher origin between Ironman Hawaii and the Ironman qualifiers.
It seems that the qualification system provided more start places to age groups with fewer participants. This could be because at least one start place is allocated to each age group.Citation4 In addition, the Ironman Lottery Program and eBay auction may have other balancing effects on the distribution.
The differences in the distribution of the nations between the Ironman qualifiers and the Ironman Hawaii might be due to the quality of the athletes – that is, nations with more top athletes earn more start places – and/or because of the locations of the Ironman qualifier races. US triathletes, for example, have more opportunities to qualify for the Ironman Hawaii because, in the USA, Ironman triathletes can start in nine Ironman qualifiers with a total of 505 qualifying slots (). In contrast, European athletes can qualify in nine Ironman races but there are only 430 slots.
Table 3 Ironman qualifiers and qualifying slots for Ironman Hawaii in 2012
Another potential explanation might be athlete motivation. It is probable that athletes try to qualify in their home country and, if they are not able to qualify, they may give up or attend another Ironman.Citation15 Further, there are other reasons why qualified triathletes may not take the opportunity to start in Ironman Hawaii, such as financial concerns, lack of time, injury, illness, or pregnancy. Moreover, as the Ironman triathlon originated in the USA, triathletes from the USA still dominate the Ironman finisher field. US women represented more than the half of female finishers in the Ironman World Championship 2010 as well in the qualifier races, while US men represented ~40% in all Ironman races. This obvious overrepresentation of certain groups of athletes may also influence the differences between Ironman qualifiers and Ironman Hawaii.
Age of the fastest Ironman performer
A further important finding was that finishers aged 25–49 years were represented more often in the Ironman qualifier races than in the Ironman Hawaii. Female finishers aged 30–59 years and male finishers aged 25–39, 45–49, and 70–74 years were able to achieve the same race times in both the Ironman qualifiers and in Ironman Hawaii. Previous studies showed that the fastest Ironman race times were achieved by athletes aged 25–39 years for both sexes.Citation10,Citation11,Citation13 Interestingly, in our study, we found that Ironman finishers of both sexes in the age groups 25–29, 30–34, and 35–39 years athletes performed at the same level in the Ironman World Championship as in the Ironman qualifier races.
Generally, the top ten athletes from both the young (18–24 years) and old (50–54, 50–59, 60–64, and 65–69 years) age groups had slower race times in Ironman Hawaii than in the Ironman qualifier races. The main reason for this might be their lower participation rate; this might lead to a selection bias. A recent study has found that peak Ironman performance is achieved between the ages of 30 and 40 years.Citation11 The study demonstrated that the fastest Ironman race times have been achieved by athletes aged 33 ± 3 years for women and 34 ± 4 years for men in an Ironman qualifier (Ironman Switzerland) for Ironman Hawaii.Citation11 When athletes are in this age range, they seem to be able to achieve approximately the same race times in Ironman Hawaii and its qualifiers.
In Ironman Hawaii, the swim split times were slower for women and men in all age groups; the bike split times were slower for women and men in younger (18–29 and 18–24 years, respectively) and older (40–44, 50–54, and 60–64 years) age groups; and the running split times were slower for women in only the 18–24 years age group. The swimming seemed to be responsible for the slower race times in Ironman Hawaii, since the fastest ten swim split times for both sexes and all age groups were slower in Ironman Hawaii than in the Ironman qualifier races. We assumed that slower overall race times in Ironman Hawaii would be caused by slower cycling and running split times because of the weather conditions of heat, wind, and high humidity. However, the swim split seemed to be responsible for the slower race times in Ironman Hawaii and this is probably due to the prohibition of wetsuits, which is one of two main differences between the swim section of the Ironman Hawaii and that of some qualifiers. Wetsuits improve swimming performance by increasing buoyancy,Citation16 so their prohibition may affect athletes’ performance in the Ironman Hawaii. The other main difference is that the swim in Hawaii takes place in the Pacific Ocean – that is, in salt water – whereas the swims in other qualifiers take place in fresh water. Swimming in salt water may improve buoyancy and this may improve swim performance. Further, the differences in swim performance in the qualifiers compared with in Ironman Hawaii could be explained by differences in anthropometric (eg, body weight, body fat) characteristics between female and male triathletes.Citation1,Citation17,Citation18
In cycling, approximately half of the age groups were able to perform in Ironman Hawaii as fast as in the Ironman qualifier races. In contrast, it seems that the running course in Hawaii is comparable to the fastest running courses from the Ironman qualifier races, since the top ten running performance times were equal for all age groups except the women’s 18–24 years age group in the Ironman World Championship and in its qualifier races. These results are surprising, since it has been documented that higher temperatures have a negative effect on both running and cycling performances in endurance athletes.Citation6,Citation7,Citation19 However, it has also been reported that faster marathoners are less affected by increases in temperature.Citation8,Citation19
There may also be practical, geographical, and/or social reasons why certain age groups were slower in the Ironman Hawaii than in the Ironman qualifier races. First, the same ten athletes may not have been responsible for the top ten performances in both the Ironman Hawaii and the qualifiers. This may be because some top athletes were responsible for more than one top ten result in the Ironman qualifier races or because some of the top qualifying athletes did not start in Ironman Hawaii. Second, some of the top age-group athletes in the Ironman qualifiers may have had more problems with the weather conditions in Ironman Hawaii.Citation6,Citation7,Citation19 Third, Ironman qualifier races in certain countries may be more similar to Ironman Hawaii than others, or the climate in certain countries more similar to that in Hawaii. Fourth, some countries may have provided more professional triathletes than others. Lastly, the athletes may have been tired in Ironman Hawaii because the race is at the end of the season and they may have finished several Ironman races during the year.
Limitations
This cross-sectional study has a number of limitations. First, no information was available on individual factors, such as physiological (eg, aerobic capacity)Citation20 and anthropometric characteristics,Citation21–Citation23 training,Citation22–Citation24 and competition experience.Citation23,Citation25 Further, a single triathlete could have been responsible for more than one analyzed result. Third, the exact courses in the Ironman qualifier races were not known and the cycling and the running courses may have had different profiles. In addition, the influence of weather conditions, such as temperature, wind direction and velocity, rain and water temperature, was unknown.Citation6–Citation8,Citation19 Another limitation was that only Ironman triathlon performances within 1 year were analyzed and the missing data from the three qualifiers may have led to selection bias. Further, athletes can qualify in both Ironman and half-Ironman races, but the half-Ironman races were not included in our study because the race results of half-Ironman events cannot be compared with the race results of a full Ironman. Lastly, the number of Ironman qualifiers changes each yearCitation14 and we restricted our study to 1 calendar year.
Despite these limitations, the large number of triathletes considered in the present study may provide new insight into Ironman triathlon performances.
Conclusion
There are differences in terms of participation and performance for athletes of different age groups between the Ironman Hawaii and its qualifier races. Triathletes aged 25–49 years and men generally were underrepresented in Ironman Hawaii compared with in its qualifier races. These triathletes may have had less chance to qualify for Ironman Hawaii than younger (<25 years) and older (>50 years) triathletes or female triathletes.
Disclosure
The authors declare no conflicts of interest in this work.
References
- LepersRAnalysis of Hawaii ironman performances in elite triathletes from 1981 to 2007Med Sci Sports Exerc200840101828183418799994
- World Triathlon CorporationIronman World Championship [website on the Internet]Tampa, FLWorld Triathlon Corporation nd Available from: http://ironmanworldchampionship.com/Accessed August 22, 2012
- World Triathlon CorporationThe Ironman story [web page on the Internet]Tampa, FLWorld Triathlon Corporation nd Available from: http://www.ironman.com/history.aspx#axzz2BrLoGbOEAccessed September 3, 2012
- World Triathlon CorporationIronman World Championship [web page on the Internet]Tampa, FLWorld Triathlon Corporation nd Available from: http://www.ironman.com/triathlon/events/ironman/world-championship.aspx#axzz2%20BrLoGbOEAccessed September 6, 2012
- To-Hawaii.comHawaii climate [web page on the Internet]Honolulu, HIKaniamea Online Publishing nd Available from: http://www.to-hawaii.com/climate.phpAccessed October 12, 2012
- SparksSACableNTDoranDAMaclarenD PInfluence of environmental temperature on duathlon performanceErgonomics20054811–141558156716338721
- WegelinJAHoffmanMDVariables associated with odds of fInishing and finish time in a 161-km ultramarathonEur J Appl Physiol2011111114515320835714
- VihmaTEffects of weather on the performance of marathon runnersInt J Biometeorol201054329730619937453
- World Triathlon CorporationEvents and results [web page on the Internet]Tampa, FLWorld Triathlon Corporation nd Available from: http://ironman.com/results/Accessed November 10, 2012
- LepersRMaffiulettiNAAge and gender interactions in ultraendurance performance: insight from the triathlonMed Sci Sports Exerc201143113413921169751
- RüstCAKnechtleBKnechtlePRosemannTLepersRAge of peak performance in elite male and female Ironman triathletes competing in Ironman Switzerland, a qualifier for the Ironman world championship, Ironman Hawaii, from 1995 to 2011Open Access J Sports Med20123175182
- LepersRRüstCAStapleyPJKnechtleBRelative improvements in endurance performance with age: evidence from 25 years of Hawaii Ironman racingAge (Dordr) Epub February 26, 2012
- StiefelMKnechtleBLepersRMaster triathletes have not reached limits in their Ironman triathlon performanceScand J Med Sci Sports Epub May 14, 2012
- World Triathlon CorporationEvents [web page on the Internet]Tampa, FLWorld Triathlon Corporation nd Available from: http://www.ironman.com/events/triathlon-races.aspx#axzz2BrLoGbOEAccessed May 17, 2011
- JürgensDKnechtleBRüstCAKnechtlePRosemannTLepersRAn analysis of participation and performance by nationality at ‘Ironman Switzerland’ from 1995 to 2011Journal of Science and Cycling2012121020
- CordainLKoprivaRWetsuits, body density and swimming performanceBr J Sports Med199125131331913028
- KnechtleBWirthABaumannBKnechtlePRosemannTOliverSDifferential correlations between anthropometry, training volume, and performance in male and female Ironman triathletesJ Strength Cond Res201024102785279320571444
- ToussaintHMde GrootGSavelbergHHVervoornKHollanderA Pvan Ingen SchenauGJActive drag related to velocity in male and female swimmersJ Biomech19882154354383417695
- ElyMRCheuvrontSNRobertsWOMontainSJImpact of weather on marathon-running performanceMed Sci Sports Exerc200739348749317473775
- O’TooleMLHillerDBCrosbyLODouglasPSThe ultraendurance triathlete: a physiological profileMed Sci Sports Exerc198719145503821454
- KnechtleBKnechtlePRosemannTUpper body skinfold thickness is related to race performance in male Ironman triathletesInt J Sports Med2011321202721110283
- KnechtleBKnechtlePRüstCARosemannTA comparison of anthropometric and training characteristics of Ironman triathletes and Triple Iron ultra-triathletesJ Sports Sci201129131373138021834654
- KnechtleBWirthABaumannBKnechtlePRosemannTPersonal best time, percent body fat, and training are differently associated with race time for male and female ironman triathletesRes Q Exerc Sport2010811626820387399
- GulbinJ PGaffneyPTUltraendurance triathlon participation: typical race preparation of lower level triathletesJ Sports Med Phys Fitness1999391121510230162
- RüstCAKnechtleBKnechtlePRosemannTLepersRPersonal best times in an Olympic distance triathlon and a marathon predict Ironman race time in recreational male triathletesOpen Access J Sports Med20112121129
- BrittRRunTri [website on the Internet] Available from: http://www.runtri.comAccessed August 27, 2012