
Abstract
Objective
The study aimed to evaluate the role of magnetic resonance imaging (MRI) in differentiating between primary benign and malignant soft tissue tumors (STTs).
Patients and Methods
The study was carried out on 110 patients with histopathological diagnoses of STTs. All patients underwent routine MRI before surgery/biopsy at Viet Duc University Hospital or Vietnam National Cancer Hospital, Hanoi, Vietnam, from January 2020 to October 2022. Data on preoperative MRI as well as the clinical features and pathological results of the patients were collected retrospectively. Univariate and multivariate linear regression were used to analyze the relationship between imaging, clinical parameters, and the ability to differentiate malignant from benign STTs.
Results
Among 110 patients (59 men and 51 women), 66 had benign tumors and 44 had malignant tumors. The qualitative values that were significant in distinguishing between benign and malignant STTs were hypointensity on T1-weighted images (T1W; p<0.001), hypointensity on T2-weighted images (T2W; p=0.003), cysts (p=0.003)), necrosis (p<0.001), fibrosis (p=0.023), hemorrhage (p<0.001), lobulated margin (p<0.001), ill-defined border (p<0.001), peritumoral edema (p<0.001), vascular involvement (p<0.001), and heterogeneous enhancement (p<0.001). Regarding quantitative values, age (p=0.009), size (p<0.001), T1W signal quantification value (p=0.002), and T2W signal quantification value (p=0.007) showed statistically significant differences between benign and malignant tumors. Multivariate linear regression analysis showed that the combination of peritumoral edema and heterogeneous enhancement was the most valuable in the differential diagnosis of malignant tumors from benign tumors.
Conclusion
MRI is valuable in discriminating between malignant and benign STTs. The presence of cysts, necrosis, hemorrhage, lobulated margin, ill-defined border, peritumoral edema, heterogeneous enhancement, vascular involvement, and T2W hypointensity is suggestive of malignant lesions, especially signs of peritumoral edema and heterogeneous enhancement. Advanced age and large tumor size are also suggestive of soft tissue sarcomas.
Introduction
Soft tissue tumors (STTs) are a diverse group of lesions arising from non-epithelial (primarily mesenchymal) extra-skeletal tissues of the body, including fat, muscle, tendons, peripheral nerves, blood vessels, and fibers (ligament, fascia).Citation1 Benign STTs are several times more common than malignancies, with a reported annual clinical incidence of 300 per 100,000.Citation1 Soft tissue sarcoma (STS) is relatively rare and accounts for only about 1% of cancers.Citation2,Citation3 Compared with benign tumors that require only monitoring and sometimes surgery, malignant tumors require surgery and other treatments such as radiotherapy, chemotherapy, and targeted therapy. Delayed detection of STS negatively affects the treatment outcome and survival prognosis of patients,Citation4 so it is extremely important to diagnose the tumor as benign or malignant.
The imaging methods commonly used to evaluate STTs include X-ray, ultrasound, computed tomography, positron emission tomography, and magnetic resonance imaging (MRI). Of these, MRI is considered the gold standard of imaging and is the method of choice to evaluate STTs.Citation5 MRI allows for the determination of the anatomy of the tumor, the characterization of the lesion depending on its signal properties, as well as the evaluation of the exact extent of the tumor and its relationship with the surrounding structures. In addition, MRI helps with surgical planning and follow-up after treatment. However, the accurate histopathological diagnosis of STTs is very difficult. A study by Gielen et alCitation6 reported that the accurate prediction of diagnostic histology by MRI was only possible in about 50% of cases.
A number of studies have been conducted worldwide on the imaging features of STT on magnetic resonance and the relationships of single or combined features of the tumor, such as age, gender, size, depth, border, signal uniformity, and necrosis, with its benign or malignant nature.Citation3,Citation4,Citation7–10 However, the results of these studies are not completely consistent. Therefore, we carried out this study to evaluate the role of magnetic resonance in the differential diagnosis of benign and malignant STTs.
Patients and Methods
Data Collection
This retrospective study included 110 patients with histopathological results regarding primary STTs obtained through biopsy or surgery at Viet Duc University Hospital or Vietnam National Cancer Hospital, Hanoi, Vietnam, from January 2020 to October 2022. All patients underwent routine MRI on 1.5 Tesla or 3.0 Tesla machines before biopsy/surgery to detect STTs. Clinical data were collected from patient records, including sex, age, location, and the histopathological results of the tumors.
MRI Techniques
MRI was performed on a 1.5 Tesla or 3.0 Tesla magnetic resonance machine (Hitachi ECHELON Smart [Hitachi, Japan] 1.5 Tesla and GE SIGNA Pioneer [GE Healthcare, Chicago, IL, USA] 3.0 Tesla). The patients underwent routine MRI with at least one T1-weighted (T1W) sequence, one T2-weighted (T2W) sequence, and one fat-saturated sequence or short tau inversion recovery (STIR) sequence, imaged in at least two planes (axial/coronal/sagittal). Slice thickness ranged from 3mm to 5mm. The field of view (FOV) and surface coils (body or surface coils) varied according to the size and location of the lesion. Contrast injection with gadolinium was then performed intravenously, with a post-injection T1W sequence in at least one plane.
To assess the STTs based on imaging and histologic data, we evaluated the entire series of MRI scans on a picture archiving and communication system workstation 4.7. The images from MRI were retrospectively reviewed by two musculoskeletal radiologists with 10 and 15 years of experience in musculoskeletal radiology who had no previous knowledge of the pathologic diagnosis. Discrepancies in interpretation were addressed by consensus. The parameters were classified into two groups: quantitative and qualitative parameters.
The qualitative imaging features of STTs included hyperintensity on T1W, hypointensity on T2W, cysts, necrosis, calcifications, fibrosis, hemorrhage, septations, margins, borders and peritumoral edema, bone involvement, vascular involvement, and post-contrast enhancement.
The characteristics of hyperintensity on T1W and hypointensity on T2W were defined as increased and decreased signals relative to muscle on the corresponding sequence. The cysts appeared as areas with an irregular margin and usually round or oval morphology and were hypointense on T1W and hyperintense on T2WCitation8 ( and ). Necrosis was characterized by an area often with ill-defined borders that was hypointense on T1W images and might be hypointense to hyperintense on T2W images, which did not enhance post-injection ( and ). Calcification was reflected by a very hypointense signal nodule on both T1W and T2W images.Citation11 Fibrosis was considered present if areas with hypointensity on T1W and T2W and delayed contrast enhancement after contrast injection were present.Citation12 Hemorrhage showed hyperintensity on T1-weighted images, hypo/hyperintensity on T2W images, which did not drop on fat-saturated sequenceCitation8 ( and ). Septations were lines that crossed the lesion and divided it into smaller lobesCitation13 (). The margin of the tumors may be lobulated or non-lobulated (). The border of the tumors could be well-defined or ill-defined (). Peritumoral edema was described as an infiltrated, hyperintense T2W and a fat-saturated area around the tumorsCitation14 (). Bone involvement was determined if cortical erosion or bone marrow edema was present adjacent to the tumor (). Vascular involvement was considered present if the tumor was in contact with the blood vessel at an angle >180 degrees or eroding into the blood vessel. Post-contrast enhancement was divided into non-enhancement, homogeneous enhancement (no hyperintensity or uniform hyperintensity compared to pre-contrast images, respectively), and heterogeneous enhancement (uniform hyperintensity compared to pre-contrast images; ).
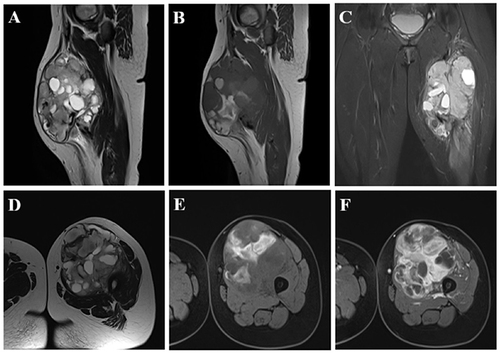
Figure 1 A 28-year-old female patient with synovial sarcoma in the left thigh. The tumor had a heterogeneous signal on sagittal T2W (A) and sagittal T1W (B) and included a cystic component that appeared hyperintense on T2W (A) and hypointense on T1W (B) and a hemorrhagic component that showed a hyperintense signal on T1W (B). Peritumoral edema manifested as hyperintensity on STIR (C). The tumor had a multilobulated margin, a relatively well-defined border with surrounding structures, and many septa inside (D). The necrotic part of the tumor comprised the hypointense portion on T1W images (E), without enhancement after injection (F). The tumor was in contact with the femoral bone but without cortical erosion, bone marrow edema, and involvement of the femoral great vessel on T1 C+ (F).
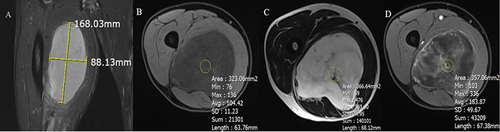
The quantitative imaging features of STTs included diameter, depth, roundness, and signal intensity values on T1W, T2W, and T1 C+. The size of the tumor was calculated as the maximum length of the tumor measured in planesCitation9 (). Roundness was the ratio of the maximum width to the length of the tumor (measured on the respective axis;Citation9 ). Depth was calculated as the smallest distance from the tumor to the skin surface. The quantitative values of the tumor signal on T1W, T2W, and T1W post contrast comprised the average signal of three measurements by regions of interest (ROIs) hand-drawn with an area of 10–20cm2 in the solid components of the tumors on the T1W, T2W, and T1W post-contrast sequences respectively, avoiding drawing on adjacent structures and interference components (eg, calcifications, hemorrhages, and cysts; ).
Figure 2 Illustration of how to measure quantitative indicators. (A) Tumor size was calculated based on the maximum length of the tumor. Roundness was the ratio of the maximum width to the length of the tumor (measured on the respective axis). (B–D) Illustration showing how to place the ROI of the tumor signal on axial T1W (B), T2W (C), and contrast-enhanced T1W (D).
Statistical Analysis
Statistical data were analyzed using SPSS 20.0 software (IBM Corp., Armonk, New York, USA). Qualitative data were presented as numbers (n) and percentages (%), while quantitative data were presented as mean ± standard deviation. The differences in the imaging features of benign and malignant STTs were evaluated using the Chi-squared test or Fisher’s exact test (if more than 20% of cells had an expected frequency of less than 5). Indexes with p-values <0.05 were included in the multivariate linear regression analysis. A p-value <0.05 was considered statistically significant.
Results
Diagnosis
The final histopathologic diagnoses of 110 STTs are listed in and included 66 benign tumors and 44 malignant tumors. Lipoma, hemangioma, and schwannoma were the most common benign tumors. Synovial sarcoma, undifferentiated pleomorphic sarcoma, liposarcoma, and dermatofibrosarcoma protuberans were the most common malignancies. Regarding the location of the tumor, the benign tumors were most common in the lower extremities (n=28, 42.4%), followed by the head and neck (n=16, 24.2%), the upper extremities (n=15, 23.6%), and trunk (n=7, 10.6%). Malignant tumors were most common in the lower extremities (n=27, 61.4%), followed by the upper extremities (n=11, 2%), trunk (n=5, 11.4%), and head and neck (n=1, 2.3%).
Table 1 Histological Types of Included Soft Tissue Tumors
lists the results of qualitative values of benign and malignant soft tissue tumors. The qualitative values that were significant in the differential diagnosis of benign and malignant STTs included hypointensity on T1W (p<0.001), hypointensity on T2W (p=0.003), cyst (p=0.003), necrosis (p<0.001), fibrosis (p=0.023), hemorrhage (p<0.001), lobulation margin (p<0.001), ill-defined border (p<0.001), peritumoral edema (p<0.001), vascular involvement (p<0.001), and post-injection heterogeneous enhancement (p<0.001).
Table 2 Qualitative Values of Benign and Malignant Soft Tissue Tumors
Meanwhile, the characteristics of sex (p=0.585), calcification (p=119), septation (p=578), and bone involvement (p=0.112) were not significant in the differential diagnosis of these two groups of lesions.
The results of quantitative values of benign and malignant soft tissue tumors are listed in . The mean age of patients with benign and malignant STTs was 36.32±18.13 and 45.82±18.81 years, respectively; this difference was statistically significant, with p=0.009. The mean size of benign tumors was 36.32±18.13, while that of malignant tumors was 45.82±18.81; this difference was statistically significant, with p=0.00. Meanwhile, depth and roundness did not differ significantly between benign and malignant STTs.
Table 3 Quantitative Values of Benign and Malignant Soft Tissue Tumors
The quantitative value of the tumor signal on T1W and T2W statistically significantly differed between the two groups of lesions, with p=0.002 and 0.007, respectively. Meanwhile, the value of tumor signal quantification on T1W post contrast was not statistically significantly different.
shows the comparison of univariate and multivariate models for the differentiation variable. Univariate linear regression analysis showed that all variables were valuable in differentiating between benign and malignant STTs. Multivariate linear regression analysis showed that the combination of peritumoral edema and heterogeneous enhancement was the most valuable in the differential diagnosis of malignant tumors from benign tumors.
Table 4 Comparison of Univariate and Multivariate Models for the Differentiation Variable
Discussion
STTs are relatively common in clinical practice, but they still pose a significant challenge in clinical and imaging diagnosis. Thanks to advances in multimodal imaging, radiologists have discovered more and more diversity in the morphology, signal, and composition of STTs.
In this study, we found that gender was not related to the incidence of STS. The studies of Kransdorf et alCitation3,Citation7 also gave similar results. Significant tissue characteristics suggestive of the malignancy of STTs included cyst, fibrosis, necrosis, hemorrhage, lobulated margin, ill-defined border, peritumoral edema, vessel involvement, and heterogeneous enhancement. This result is consistent with the studies of Chen et alCitation8 and Gruber et al.Citation15 Because malignant cells grow rapidly and require a large supply, malignancies often have vascular proliferation, which results in strong enhancement.Citation16 A lack of adequate blood supply to tumor areas will lead to necrosis and cystic degeneration. The tumor grows rapidly and invades the small blood vessels; at the same time, the proliferative blood vessels in the tumor often have thin, easily damaged vessel walls that lead to bleeding in the tumor. Malignant tumors often have lobulated margins and ill-defined borders with adjacent structures due to their invasive nature. Peritumoral edema is suggestive of malignancy as it may reflect infiltrative tumor growth and reactive inflammatory mechanisms. Malignant tumors with a heterogeneous tumor structure and necrotic, cystic, and bleeding components often have heterogeneous enhancement after injection.Citation16
In this study, calcification, septation, and bone involvement were signs that had no statistical significance in the differential diagnosis of benign and malignant lesions. A possible reason for lack of statistically significant differences in calcification between benign and malignant tumors may be the low accuracy of MRI in detection of calcificationsCitation17 and we were not able to obtain computed tomography or X-ray images of patients. Septation could be seen in both the benign and malignant groups, which is consistent with the study of Chen et al.Citation8 Bone involvement was also not a significant parameter in distinguishing between the benign and malignant groups.
We found that the incidence of STS increased with age: the mean age of patients with benign tumors was 36.32±18.13 years, while the mean age of those with malignant tumors was 45.82±18.81 years, consistent with the studies of Kransdorf et alCitation3,Citation7 As with many other cancers, advanced age is a risk factor for cancer,Citation18 reflecting the duration of exposure to carcinogens and the accumulation of increased cancer risk, as well as genomic instability and the accumulation of DNA damage and mutations over time coupled with disruptions of the DNA repair and cell growth regulation systems.
The size of the STS at the time of detection was also significantly higher than that of the benign lesions. This is consistent with the work of Gruber et al.Citation9 This is because malignant tumors grow faster than benign tumors.Citation19 However, with a size cut-off of 70mm,Citation9 21 patients had benign tumors larger than this threshold and 14 patients had malignant tumors smaller than this threshold. The reason is that the time from the time when tumor began to appear to the time of examination of the patients is different; thus, just the size of the tumor is not enough to accurately determine the benign or malignant nature of the lesion.
The roundness of malignant tumors is greater than that of benign tumors, but the difference in our study was not statistically significant. Meanwhile, Gruber et al studyCitation9 showed that malignant tumors were significantly more rounded than benign ones, possibly because malignancies often have indistinct borders with neighboring structures, the precise determination of tumor diameters can be misleading, and the heterogeneity of high-resolution imaging measurements affects the results. In this study, depth was also not a meaningful parameter in distinguishing the two groups of lesions, because although malignant tumors tend to develop deeper, benign tumors also have deep-seated types, such as lipomas or deep fibromatoses.
The qualitative and quantitative signal values on T1W of benign tumors were higher than those of malignant tumors, and this difference was statistically significant. This result is contrary to the study of Chen et alCitation8 The reason is probably that in our study, the lipoma/benign tumor ratio was relatively high, and lipoma is hyperintense on T1W. The study of Gruber et alCitation15 gave similar results regarding the hyperintensity on T1W of the benign group, which proves that this is not a significant sign in the differential diagnosis of these two groups of lesions. The qualitative and quantitative values of the signal on T2W of malignant tumors were significantly higher than those of the benign group, which is consistent with the studies of Chen et alCitation8 and Gruber et al.Citation15
Due to the retrospective nature of this study, we were only able to use existing sequences. Besides, it was not possible to collect clinical parameters and the results of other imaging methods. Collecting MRI images from two different centers with different MRI machines resulted in disproportionate image quality, which also affected the outcomes of the study. In addition, compared with other studies, the number of patients in our study was not high, leading to some differences in study results.
Conclusions
MRI is valuable in differentiating malignant from benign STTs. The presence of cysts, necrosis, hemorrhage, lobulated margin, ill-defined border, peritumoral edema, heterogeneous enhancement, vascular involvement, and T2W hypointensity is suggestive of malignant lesions, especially signs of peritumoral edema and heterogeneous enhancement. Advanced age and large tumor size are also suggestive of STS.
Data Sharing Statement
The datasets generated and/or analysed during the current study are not publicly available due to privacy concerns but are available from the corresponding author on reasonable request.
Ethical Approval
This study was approved by Hanoi Medical University Institutional Ethical Review Board and conducted according to the ethical standards of the 1964 Declaration of Helsinki and its later amendments.
Informed Consent
Informed consent was waived for the study’s retrospective nature, and the analysis used anonymous clinical data.
Disclosure
The authors declare no conflicts of interest.
References
- Goldblum JR, Weiss SW, Folpe AL. Enzinger and Weiss’s Soft Tissue Tumors E-Book. Elsevier Health Sciences; 2013.
- Toro JR, Travis LB, Wu HJ, Zhu K, Fletcher CDM, Devesa SS. Incidence patterns of soft tissue sarcomas, regardless of primary site, in the surveillance, epidemiology and end results program, 1978–2001: an analysis of 26,758 cases. Int J Cancer. 2006;119(12):2922–2930. doi:10.1002/ijc.22239
- Kransdorf MJ. Benign soft-tissue tumors in a large referral population: distribution of specific diagnoses by age, sex, and location. AJR Am J Roentgenol. 1995;164(2):395–402. doi:10.2214/ajr.164.2.7839977
- Grimer RJ. Size matters for sarcomas! Ann R Coll Surg Engl. 2006;88(6):519–524. doi:10.1308/003588406X130651
- Kransdorf MJ, Murphey MD. Radiologic evaluation of soft-tissue masses: a current perspective. AJR Am J Roentgenol. 2000;175(3):575–587. doi:10.2214/ajr.175.3.1750575
- Gielen JLMA, De Schepper AM, Vanhoenacker F, et al. Accuracy of MRI in characterization of soft tissue tumors and tumor-like lesions. A prospective study in 548 patients. Eur Radiol. 2004;14(12):2320–2330. doi:10.1007/s00330-004-2431-0
- Kransdorf MJ. Malignant soft-tissue tumors in a large referral population: distribution of diagnoses by age, sex, and location. AJR Am J Roentgenol. 1995;164(1):129–134. doi:10.2214/ajr.164.1.7998525
- Chen CK, Wu HT, Chiou HJ, et al. Differentiating benign and malignant soft tissue masses by magnetic resonance imaging: role of tissue component analysis. J Chin Med Assoc. 2009;72(4):194–201. doi:10.1016/S1726-4901(09)70053-X
- Gruber L, Loizides A, Ostermann L, Glodny B, Plaikner M, Gruber H. Does size reliably predict malignancy in soft tissue tumours? Eur Radiol. 2016;26(12):4640–4648. doi:10.1007/s00330-016-4300-z
- Datir A, James SLJ, Ali K, Lee J, Ahmad M, Saifuddin A. MRI of soft-tissue masses: the relationship between lesion size, depth, and diagnosis. Clin Radiol. 2008;63(4):373–378; discussion 379–380. doi:10.1016/j.crad.2007.08.016
- Hashimoto N, Ueda T, Joyama S, et al. Extraskeletal mesenchymal chondrosarcoma: an imaging review of ten new patients. Skeletal Radiol. 2005;34(12):785–792. doi:10.1007/s00256-005-0025-9
- Munk PL, Sallomi DF, Janzen DL, et al. Malignant fibrous histiocytoma of soft tissue imaging with emphasis on MRI. J Comput Assist Tomogr. 1998;22(5):819–826. doi:10.1097/00004728-199809000-00029
- Hermann G, Abdelwahab IF, Miller TT, Klein MJ, Lewis MM. Tumour and tumour-like conditions of the soft tissue: magnetic resonance imaging features differentiating benign from malignant masses. Br J Radiol. 1992;65(769):14–20. doi:10.1259/0007-1285-65-769-14
- Beltran J, Simon DC, Katz W, Weis LD. Increased MR signal intensity in skeletal muscle adjacent to malignant tumors: pathologic correlation and clinical relevance. Radiology. 1987;162(1 Pt 1):251–255. doi:10.1148/radiology.162.1.3786772
- Gruber L, Gruber H, Luger AK, Glodny B, Henninger B, Loizides A. Diagnostic hierarchy of radiological features in soft tissue tumours and proposition of a simple diagnostic algorithm to estimate malignant potential of an unknown mass. Eur J Radiol. 2017;95:102–110. doi:10.1016/j.ejrad.2017.07.020
- Loizides A, Peer S, Plaikner M, Djurdjevic T, Gruber H. Perfusion pattern of musculoskeletal masses using contrast-enhanced ultrasound: a helpful tool for characterisation? Eur Radiol. 2012;22(8):1803–1811. doi:10.1007/s00330-012-2407-4
- Kransdorf MJ, Murphey MD. Imaging of soft-tissue musculoskeletal masses: fundamental concepts. Radiographics. 2016;36(6):1931–1948. doi:10.1148/rg.2016160084
- White MC, Holman DM, Boehm JE, Peipins LA, Grossman M, Henley SJ. Age and cancer risk. Am J Prev Med. 2014;46(3 0 1):S7–15. doi:10.1016/j.amepre.2013.10.029
- Clark MA, Fisher C, Judson I, Thomas JM. Soft-tissue sarcomas in adults. N Engl J Med. 2005;353(7):701–711. doi:10.1056/NEJMra041866