
Abstract
Objective
The Global Leadership Initiative on Malnutrition (GLIM) has proposed criteria for the diagnosis of malnutrition, one of which is reduced muscle mass. Computed tomography (CT) assessment of psoas muscle area (PMA) has been used to estimate muscle mass in patients, including those with acute pancreatitis (AP). The present study aimed to define the cutoff value of PMA indicative of reduced muscle mass in patients with AP and to assess the impact of reduced muscle mass on the severity and early complications of AP.
Methods
Clinical data of 269 patients with AP were analyzed retrospectively. The severity of AP was determined according to the revised Atlanta classification. PMA was evaluated by CT and used to calculate the psoas muscle index (PMI). Cutoff values for reduced muscle mass were calculated and validated. Logistic regression analysis was performed to assess the relationship between PMA and the severity of AP.
Results
PMA was a better indicator of reduced muscle mass than PMI, with cutoff values of 11.50 cm2 for men and 8.22 cm2 for women. Rates of local complications, splenic vein thrombosis, and organ failure were significantly higher in AP patients with low than high PMA (all p < 0.05). PMA showed good ability to predict splenic vein thrombosis in women, with an area under the receiver operating characteristic curve of 0.848 (95% confidence interval 0.768–0.909, sensitivity 100%, specificity 83.64%). Multivariate logistic regression revealed that PMA was an independent risk factor for moderately severe plus severe AP (odds ratio 5.639, p = 0.001) and severe AP (odds ratio 3.995, p = 0.038).
Conclusion
PMA is a good predictor of the severity and complications of AP. The PMA cutoff value is a good indicator of reduced muscle mass.
Introduction
Acute pancreatitis (AP) is one of the most common acute disorders of the gastrointestinal tract. The incidence of AP is rising globally, with estimated 34 cases per 100,000 general population per year.Citation1 The 2012 revision of the Atlanta Classification has categorized AP as being mild, moderately severe or severe.Citation2 Mild acute pancreatitis (MAP) is the most common, with most patients recovering within 1–2 weeks, whereas moderately severe acute pancreatitis (MSAP) and severe acute pancreatitis (SAP) have mortality rates of approximately 2% and 36%–50%, respectively.Citation3 In AP, especially in MSAP and SAP, inflammation and septic complications increase metabolism, increasing energy requirements and protein catabolism. Thus, all patients with AP are at risk of malnutrition and may require nutritional support.Citation4 Early detection of MSAP and SAP is therefore important, because these patients may require more aggressive intensive care treatment and early nutritional support.
Malnutrition is a critical problem associated with poor clinical outcomes. The 2019 Global Leadership Initiative on Malnutrition (GLIM) Assessment (Diagnostic) Criteria are a global consensus for diagnosing malnutrition in adults.Citation5 GLIM criteria consist of two steps, the first being risk screening by any validated screening tool, and the second being the assessment of malnutrition. One of the GLIM criteria for diagnosing malnutrition is reduced muscle mass, but methods for determining reduced muscle mass and appropriate cutoff values are inconsistent. Abdominal computed tomography (CT) is a fundamental tool for identifying the cause, severity and complications of AP patients. CT scans are also widely used to assess body composition, such as psoas muscle mass at the third or fourth lumbar vertebra level, a criterion cited by the GLIM for estimating muscle mass. To date, however, few studies using GLIM criteria for the diagnosis of malnutrition have utilized CT to evaluate reduced muscle mass, especially in Asian subjects. Moreover, these studies mainly focused on cirrhosis patients. In addition, the parameters measured varied, including total psoas muscle area, total psoas index (TPI), skeletal muscle area, skeletal muscle index, psoas muscle area (PMA), and psoas muscle index (PMI). Moreover, no studies to date have evaluated CT-determined PMA in patients with AP.
The main objective of this study was to determine the CT-assessed cutoff value of reduced muscle mass in patients with AP and to use this value in subsequent research on malnutrition, as well as to assess the effect of reduced muscle mass on the severity and early complications of AP.
Methods
Study Population
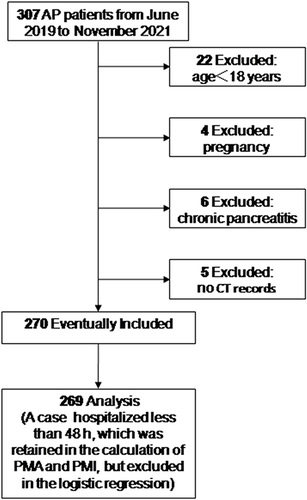
This retrospective study included 269 consecutive patients with AP evaluated at the Affiliated Hospital of Chengde Medical University, China, from June 2019 to November 2021. The study protocol was approved by the hospital’s Ethics Committee (approval number: CYFYLL2022256), which waived the requirement for patient informed consent due to the retrospective nature of this study. The study conformed to the principles of the Declaration of Helsinki. The inclusion and exclusion criteria for this study are shown in . Subjects were excluded if they were age <18 years, pregnant, or had chronic pancreatitis, or if no CT records were available. Patient records were reviewed and characteristics recorded, including age, sex, height, weight, AP history, previous medical history, etiology and severity of AP, length of hospital stay (LOS), hospital costs, infectious complications, local complications, organ failure and laboratory test data. CT images were obtained from the picture archiving and communication system of the hospital.
Figure 1 Flow chart of the study.
Definitions
The diagnosis and classification of AP were based on the 2012 revision of the Atlanta Classification Criteria. The diagnosis of AP required two of the following three criteria: (1) typical abdominal pain consistent with AP; (2) serum lipase (or amylase) activity at least three times the upper limit of normal; and (3) characteristic findings of AP on CT, magnetic resonance imaging (MRI) or transabdominal ultrasonography. Patients were classified as having mild AP (no complications or organ failure), moderately severe AP (organ failure for ≤48 hours, local complications without persistent organ failure, or worsening of previous comorbidities without persistent organ failure), or severe AP (organ failure for >48 hours).
Local complications included acute peripancreatic fluid collection, pancreatic pseudocyst, acute necrotic collection and walled-off necrosis. Other local complications included peritonitis, splenic and portal vein thrombosis, and colonic necrosis.
Organ failure included failure of the respiratory, cardiovascular, and renal systems, with the failure of each system assigned a score of two or higher based on the modified Marshall scoring system ().Citation6
Table 1 Modified Marshall Scoring System for Organ Dysfunction
Infectious complications included infectious shock, sepsis, septicemia, abdominal infection, severe pneumonia, infective endocarditis, and a procalcitonin ≥25 ng/mL (excluding renal failure) in the absence of the above diagnoses.
Acute biliary pancreatitis was defined as AP caused by bile duct stones or biliary obstruction. Hypertriglyceridemic pancreatitis was described as AP with a serum triglyceride level greater than 11.3 mmol/L on admission or greater than 5.65 mmol/L without other causes, such as bile duct stones or obstruction, and excluding alcohol-induced AP. Alcoholic AP was defined as a history of alcohol abuse or alcoholic binge prior to the episode of AP and without evidence of other causes of AP on a patient’s medical history. Other causes of AP were defined as those that did not meet the above criteria.Citation7 Comorbidities were scored using the updated Charlson comorbidity index ().Citation8
Table 2 Updating Charlson Comorbidity Index and Score
Laboratory Test Data
Lymphocyte count, neutrophil count, C-reactive protein (CRP), albumin (Alb), hemoglobin, triglyceride, amylase, lipase and serum calcium were recorded from 24 h before hospital admission (ie in the emergency department) to 48 h after admission. Neutrophil-to-lymphocyte ratio (NLR) and CRP/Alb ratio and corrected serum calcium (CsCa) were calculated, with the latter determined using the equation: CsCa (mmol/L) = serum calcium (mmol/L) − 0.02 × [serum Alb (g/L) − 40]. All laboratory data were classified according to our hospital’s normal reference range, with patients classified according to normal reference values (CsCa) and median values (NLR, CRP/Alb).
PMA and PMI Calculation methods
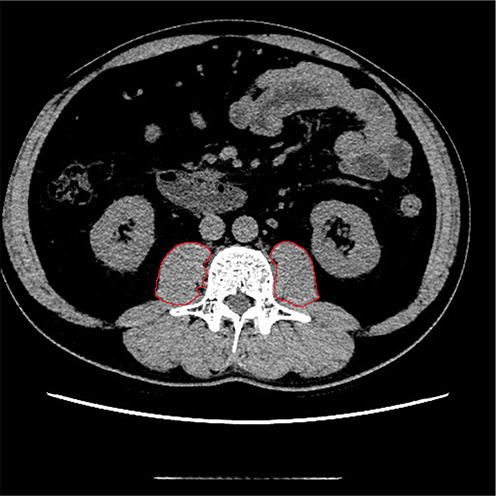
All patients underwent abdominal CT scanning following the onset of AP. Five patients who had undergone CT in other hospitals, with no CT records in our hospital, were excluded. All CT images were obtained from the picture archiving and communication system and measured in DICOM format. CT images of the middle level of the third lumbar vertebrae were measured using analytical software for post-processing workstations GE ADW4.5 to quantify psoas muscle. Each patient’s bilateral PMA (cm2) was measured manually by the same trained radiologist (), who was blinded to the patient’s diagnosis and complications. PMI (cm2/m2) was calculated by dividing PMA by the square of height. Normal PMA and PMI were defined in the younger patients with a comorbidity score of 0 and a body mass index (BMI) of 18.5 to 28.0 kg/m2.
Figure 2 Cross-sectional CT images at the L3 vertebra level. The psoas muscle borders were manually outlined.
Statistical Analysis
Categorical variables were expressed as numbers (percentages) and compared by chi-square tests or Fisher’s exact test, as appropriate. The normality of data distribution was tested using the Kolmogorov–Smirnov test or the Shapiro–Wilk test, as appropriate. Normally distributed continuous variables were expressed as mean ±standard deviation (SD) and compared by t-tests, whereas non-normally distributed continuous variables were expressed as median (interquartile range [IQR]) and compared by Mann–Whitney U-tests. Statistically significant differences among three or more groups were subjected to post hoc analysis using LSD adjustment if the data were normally distributed with equal variances and Kruskal–Wallis H adjustment if the data were non-normally distributed or had unequal variances. Correlations between psoas muscle parameters and age were tested using the Pearson correlation coefficient. Receiver operating characteristics (ROC) curves and areas under the curve (AUCs) were calculated to evaluate the ability of PMA/PMI to predict complications and the severity of AP. Risk factors for MSAP and SAP were evaluated by univariate and multivariate logistic regression analyses. Before data analysis, the occurrence of collinearity between independent factors (ie a variance inflation factor <1.4 or all variables having tolerances >0.75) and model fitness (with p-values on Hosmer–Lemeshow tests >0.2 for binary logistic models) was evaluated. All statistical analyses were performed and graphs drawn using SPSS 24 (IBM, USA), GraphPad Prism 9 (GraphPad Software, Inc., USA), and MedCalc 20 (MedCalc Software, Ltd., Belgium) software, with two-tailed p-values <0.05 defined as statistically significant.
Results
The 269 patients included 158 (58.7%) men and 111 (41.3%) women, of median age 49 years (37–64 years). AP in 70.6% of patients was classified as mild. The median comorbidity scores in groups of patients with MP, MSAP, and SP were 0 (0–0). Transient or persistent organ failure occurred in 46 (17.1%) patients and local complications in 45 (16.7%). The baseline characteristics and outcomes in this patient population are shown in .
Table 3 Characteristics of 269 Patients with AP
presents the median values and IQRs of the measured variables. BMI was higher in the SAP group than in the MAP and MSAP groups, but the difference was not statistically significant (p = 0.123). PMA, PMI, NLR, CRP/Alb, CsCa and triglycerides differed significantly among these three groups (all p < 0.05), whereas the other variables did not.
Table 4 Association Between Measured Variables and Severity of AP
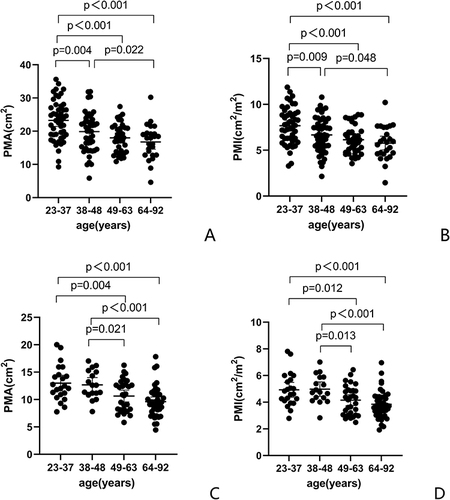
Both PMA (19.95 ± 5.98 cm2 vs 11.02 ± 3.15 cm2; p < 0.001; ) and PMI (PMI 6.70 ± 1.96 cm2/m2 vs 4.31 ± 1.18 cm2/m2; p < 0.001; ) were significantly higher in men than in women. The error bars of PMA and PMI classified according to gender and age-quartile (23–37, 38–48, 49–63, and 64–92 years) revealed that PMA and PMI gradually decreased with age in both men ( and ) and women ( and ). PMA and PMI differed significantly between the first and third quartiles, the first and fourth quartiles, and the second and fourth quartiles in men and women (p < 0.05 each) but did not differ significantly between the third and fourth quartiles in both sexes (p > 0.135 each). PMA (p = 0.021) and PMI (p = 0.013) differed significantly between the second and third quartiles in women. In men, however, PMA (p = 0.114) and PMI (p = 0.191) tended to decrease between the second and third quartiles, but the differences were not significant.
Figure 3 Values of PMA (A) and PMI (B) by sex.
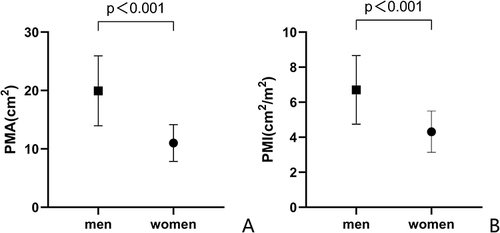
Figure 4 Distribution and post hoc LSD of PMA and PMI according to age in men (A and B) and women (C and D).
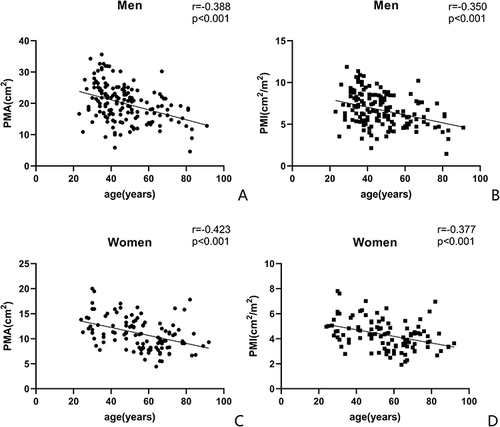
Both PMA (r = −0.388, 95% CI −0.513 to −0.247, p < 0.001; ) and PMI (r = −0.350, 95% CI −0.481 to −0.206, p < 0.001; ) showed significant negative correlations with age in men. Similarly, in women, PMA (r = −0.423, 95% CI −0.564 to −0.257, p < 0.001; ) and PMI (r = −0.377, 95% CI −0.526 to −0.206, p < 0.001; ) showed significant negative correlations with age.
Figure 5 A negative correlation between PMA/PMI and age was observed in men (A and B) and women (C, D).
Based on the above results, 83 patients, 53 men and 30 women aged <49 years with comorbidity scores of 0 and BMI 18.5 to 28.0 kg/m2 were selected as a normal group for comparison. PMA and PMI were measured on CT images at the L3 vertebra level, with these parameters regarded as normal expected values of muscle mass. The cutoff values of PMA and PMI were calculated as those 1.64 SDs (equivalent to the fifth percentile) below the mean. The cutoffs for PMA and PMI were 11.50 cm2 and 3.85 cm2/m2, respectively, in men and 8.22 cm2 and 3.20 cm2/m2, respectively, in women.
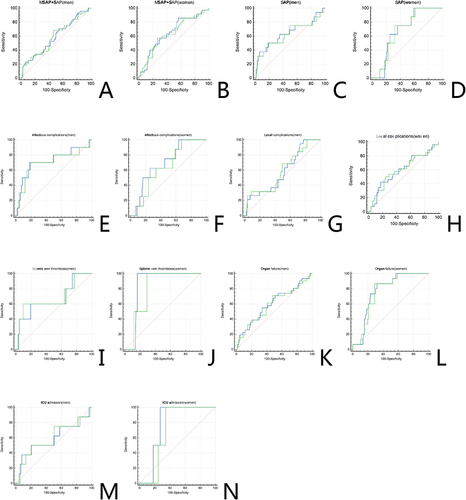
Patients were assigned to groups above and below the cutoff values for PMA () and PMI (). Complications, LOS, and total hospital costs were compared in the two cohorts; because only one death was reported, mortality was not compared. Rates of complications and organ failure were higher, LOS was longer, and hospital costs were higher in AP patients with low than high PMA/PMI, except for LOS in men. Differences in PMI were statistically significant only for local complications and splenic vein thrombosis in men and LOS in women. ROC and AUC were calculated to evaluate the abilities of PMA and PMI to predict the severity and complications of AP ( and , ). PMA had a greater AUC than PMI in predicting infectious complications (0.691 vs 0.641, p = 0.0435) and ICU admissions (0.773 vs 0.705, p = 0.0008) in women with AP (, and ). The AUCs of both PMA and PMI were ≥0.70 in predicting infectious complications in men (, ) and in predicting splenic vein thrombosis (), organ failure (), and ICU admission () in women (). Among these parameters, PMA had the largest AUC (0.848, 95% CI 0.768–0.909) in predicting splenic vein thrombosis in women, with a sensitivity of 100% and a specificity of 83.64% (, ). In addition, the cutoff values obtained by the Youden index were greater than those calculated by mean − 1.64 SDs, except for PMA in predicting splenic vein thrombosis in women (8.11 cm2). Overall, the cutoff value of PMA was more effective than that of PMI in distinguishing patients with adverse outcomes.
Table 5 Validation of the Estimated Cutoff of PMA
Table 6 Validation of the Estimated Cutoff of PMI
Table 7 Efficacy of PMA/PMI in Predicting the Severity and Complications of Men with AP
Table 8 Efficacy of PMA/PMI in Predicting the Severity and Complications of Women with AP
Figure 6 Receiver operating characteristic (ROC) analysis of the predictive efficiency of PMA and PMI by sex. Solid blue lines represent PMA, dashed green lines represent PMI.(A) Moderately severe acute pancreatitis + severe acute pancreatitis in men, (B) Moderately severe acute pancreatitis + severe acute pancreatitis in women, (C) Severe acute pancreatitis in men, (D) Severe acute pancreatitis in women, (E) Infectious complications in men, (F) Infectious complications in women, (G) Local complications in men, (H) Local complications in women, (I) Splenic vein thrombosis in men, (J) Splenic vein thrombosis in women, (K) Organ failure in men, (L) Organ failure in women, (M) ICU admission in men, (N) ICU admission in women.
The ability of the PMA cutoff value to act as an indicator of reduced muscle mass was therefore analyzed in patients with AP.
Because the rates of complications, ICU admission and deaths were low, we focused on the analysis of MSAP and SAP. To further evaluate the ability of the PMA cutoff value to predict MSAP and SAP, we performed univariate and multivariate logistic regression analyses.
Univariate analysis showed that low PMA was significantly associated with MSAP + SAP (OR 4.018, p < 0.001). Variables with p <0.05 in univariate analysis and those considered to be related to AP prognosis were selected for multivariate logistic regression analysis to correct for confounding factors (missing values accounted for a total of 5.9% and were removed directly). The association between low PMA and MSAP+SAP was stronger in multivariate analysis (OR 5.639, p = 0.001) ().
Table 9 Univariate and Multivariate Regression Analysis of MSAP and SAP
Univariate analysis also found that low PMA was significantly associated with SAP (OR 2.933, p = 0.037). Because only 23 patients in the present study had been diagnosed with SAP, only variables with p < 0.05 in the univariate analysis were included in the multivariate analysis. Low PMA continued to be significantly associated with SAP on multivariate analysis (OR 3.205, p = 0.044) (), with further adjustments for gender, age, BMI, and comorbidity score resulting in a stronger association between low PMA and SAP (OR 3.995, p = 0.038) ().
Table 10 Univariate and Multivariate Regression Analysis of SAP (Adjust for NLR, CRP/Alb, and Corrected Serum Calcium)
Table 11 Univariate and Multivariate Regression Analysis of SAP (Adjust for Gender, Age, BMI, NLR, CRP/Alb, Corrected Serum Calcium, and Comorbidity Score)
Discussion
The GLIM criteria have recommended using methods such as dual-energy X-ray absorptiometry, bioelectrical impedance analysis, CT, and MRI to measure muscle mass.Citation9 Many patients with gastrointestinal diseases, such as inflammatory bowel disease, severe liver disease, and various forms of pancreatitis, frequently undergo abdominal CT or MRI scans that enable psoas muscle mass at the L3 or L4 vertebra level to be calculated.Citation10–13 Moreover, it is easier to measure PMA than to measure the area of skeletal muscles. Because MRI requires much more time and is costlier than CT, all patients with AP in the present study underwent CT scanning, with only a few undergoing MRI after CT. Despite the results of MRI not being included in the present analysis, this non-inclusion did not result in selection bias.
The present study showed that PMA cutoff values were predictive of SAP and of MSAP + SAP in Asian populations. PMAs of 11.50 cm2 for men and 8.22 cm2 for women can be considered cutoff values for reduced muscle mass. AP patients with PMAs below the cutoff values had higher rates of complications and organ failure than those with PMAs above the cutoff. Furthermore, PMA was independently associated with the severity of AP. The risk of MSAP + SAP was 5.639 times higher in patients with low than high PMA, and the risk of SAP was nearly four times higher in patients with low than high PMA. In addition, PMA had a good ability (AUC = 0.848, sensitivity 100%, specificity 83.64%) to predict splenic vein thrombosis in women.
The PMAs observed in the present study were similar to those observed in a large sample of healthy patients from India with no other comorbidities who presented with acute abdomen. The mean ± SD PMAs were 18.55 ± 3.45 cm2 in men and 13.52 ± 2.80 in women (p = 0.0001), and the cutoff values for sarcopenia, calculated as mean − 2 SDs were 11.64 for men and 7.92 for women.Citation14 The PMAs observed in the present study were slightly higher than those observed in patients from Turkey,Citation15 but significantly lower than those observed in patients from FranceCitation16 and CanadaCitation17 (), differences that may be associated with race, age, comorbidities, BMI, or method of determining cutoff value. Muscle mass generally increases with BMI,Citation18 but BMI was not evaluated in the Canadian study. The cutoff value of PMA in the French study was determined by the Youden index. The present study showed that the cutoff value determined by the Youden index was higher than that calculated from the mean and SD. Because the present study was designed to assess the cutoff value for muscle loss, it was more appropriate to calculate the cutoff value from the mean and SD than from the Youden index.
Table 12 Cutoff Values Determined by CT in Different Studies
Reduced muscle mass assessed by PMA predicts prognosis in patients with many conditions, including those undergoing surgery for digestiveCitation12,Citation25–27 and cardiovascularCitation28–30 diseases, patients with cirrhosis undergoing liver transplantation,Citation16 and patients with lymphoma.Citation31 PMA can predict postoperative complications,Citation12,Citation25,Citation27 postoperative mortality,Citation29,Citation30,Citation32 LOS,Citation25,Citation28 disease-free survival,Citation26 and overall survival (OS).Citation26,Citation31 However, PMA has been reported to be an indicator of sarcopenia in younger, but not in elderly, patients.Citation33 In that study, 46 patients were classified into groups aged ≤74 (n = 22) and ≥75 (n = 24) years, with mean ages of 64.5 years (36–74 years) and 81.5 years (75–95 years), respectively. PMA in the younger group correlated significantly with age (r = 0.40 p = 0.0015) and LOS (r = 0.23 p = 0.023). In the older group, however, age (r = 0.12 p = 0.08) and LOS (r = 0.026 p = 0.45) were not correlated with PMA. This discrepancy between age groups may be due to a lack of linearity between age and PMA above a certain age; the advanced age of patients in the elderly group, the small sample size, and/or not accounting for gender. Other studies have evaluated the relationship between the psoas muscle and AP. For example, an increased number of AP episodes was associated with a significant reduction in psoas muscle volume, as measured by MRI, with leptin appearing to be a factor associated with this relationship.Citation34 Evaluation of the relationship between AP and CT-determined muscle parameters showed that the TPI was significantly higher in patients with MAP than with MSAP and SAP, as well as being substantially lower in patients with severe pancreatic necrosis than in those without necrosis.Citation35 To date, however, no studies have evaluated the relationship between PMA and AP. To our knowledge, the current study is the first to investigate the predictive value of PMA in patients with AP. This study found that PMA was independently associated with the severity of AP and was predictive of complications, especially splenic vein thrombosis in women. Because the incidence of splenic vein thrombosis in this study was low, however, larger studies are needed to confirm the role of PMA in predicting splenic vein thrombosis.
The PMI cutoff values in our study were calculated as the mean −1.64 SDs, with the cutoff values close to those in studies from other Asian countries such as Japan,Citation19,Citation20 Korea,Citation21 India,Citation14 and Turkey.Citation15 The cutoff values in women, however, were slightly higher than in two Japanese studies,Citation20,Citation22 which may be related to the low BMI/muscle mass in Japanese women. The PMI cutoff values in Turkish women were 3.56 cm2/m2 using the fifth percentile and 2.66 cm2/m2 using mean − 2 SDs, with the study ultimately adopting the latter.Citation23 The PMI cutoff values in Japanese men were 2.29 cm2/m2 using the fifth percentile and 1.69 cm2/m2 using mean − 2 SDs, with the study ultimately adopting the former.Citation20 Cutoff values should be based on data distribution, with the mean − 2 SDs for normally distributed data and the fifth percentile for non-normally distributed data. The cutoff values in adult Japanese liver donors were 6.36 cm2/m2 in men and 3.92 cm2/m2 in women,Citation24 significantly higher than those of the present study and studies in other Asian countries. Information on the height and BMI of Japanese liver donors was unavailable, suggesting that higher cutoffs may have been associated with lower height or higher BMI. shows cutoff values obtained from CT studies of muscle mass.
PMI has been reported to predict OS in patients with ovarian cancer,Citation36 after living donor liver transplantation,Citation37 hepatocellular carcinoma,Citation38 and patients who are hemodialysis-dependent after cardiac surgery.Citation39 The first three studies used the Youden index to determine PMI cutoff values. In contrast, PMI could not predict prognosis in patients undergoing chemotherapy for non-small cell lung cancer (NSCLC)Citation40,Citation41 or in elderly patients undergoing emergency laparotomy.Citation42 Interestingly, the two studies in patients with NSCLCCitation40,Citation41 used previously published cutoff values.Citation24 These discrepancies among studies may be related to age or the method for determining PMI cutoff values. In addition, the PMI cutoff value determined in the Japanese studyCitation24 may be too high, resulting in its low specificity for use as a prognostic indicator.
To date, no study has compared the predictive abilities of PMI and PMA. The present study found that PMA was a better predictor of complications than PMI. The lower predictive power of PMI may be due to its low sensitivity accompanied by high specificity or its lack of reflection of patient condition in “real-time”, making it inappropriate for assessing short-term prognoses despite its ability to predict long-term survival. For this reason, and because PMA did not require determination of height, only PMA was subjected to regression analyses. The present study determined the cutoff values for reduced muscle mass in young patients with AP, not in a young, healthy population. Although their comorbidity scores were 0, a few individuals had cerebrovascular disease, peptic ulcer, or diabetes but without chronic complications. AP may also affect muscle mass, so the cutoff value we obtained may be lower than in a healthy population. Obese individuals were excluded from determining cutoff values because obesity tends to be associated with underlying chronic diseases. However, this may have resulted in lower cutoff values because obese patients tend to have more muscle mass. Therefore, the cutoff values determined in this study may be unsuitable for healthy populations but may be replicable in other inpatients.
This study had several limitations. First, patient data were retrospectively collected. However, only five patients without CT records were excluded, and few confounding factors were missing from the logistic regression analysis, thus minimizing selection bias. Of the inpatients with AP who underwent CT scans in the present study, 70% had mild AP, equal to the percentages in other populations.Citation43 Second, the sample sizes used to determine the PMA cutoff values and to predict splenic vein thrombosis in women were small. Third, this study included patients from a single center in China. Large, prospective, multicenter studies are therefore needed to confirm the findings of the present study.
Conclusion
The PMA and PMI cutoff values derived from this study are comparable to those in most other Asian populations but lower than those in European and American patients. PMA is a good predictor of the severity and complications of AP. The cutoff value of PMA appears to serve as an indicator of the GLIM phenotypic criteria for the diagnosis in patients with AP.
Data Sharing Statement
The data that support the findings of this study are available from the corresponding author upon reasonable request.
Ethics Approval
This study was performed in line with the principles of the Declaration of Helsinki. Approval was granted by the Ethics Committee of Affiliated Hospital of Chengde Medical University (No. CYFYLL2022256). The ethics committee waived the requirement for written informed consent because of the retrospective nature of the study. Prior to analysis, identifying information was removed to protect patient confidentiality.
Author Contributions
All authors made a significant contribution to the work reported, whether that is in the conception, study design, execution, acquisition of data, analysis and interpretation, or in all these areas; took part in drafting, revising or critically reviewing the article; gave final approval of the version to be published; have agreed on the journal to which the article has been submitted; and agree to be accountable for all aspects of the work.
Disclosure
The authors report no conflicts of interest in this work.
Acknowledgment
The authors wish to appreciate all the study participants and research staff who participated in this work.
Additional information
Funding
References
- Heckler M, Hackert T, Hu K, Halloran CM, Buchler MW, Neoptolemos JP. Severe acute pancreatitis: surgical indications and treatment. Langenbeck’s Arch Surgery. 2021;406(3):521–535. doi:10.1007/s00423-020-01944-6
- Banks PA, Bollen TL, Dervenis C, et al. Classification of acute pancreatitis--2012: revision of the Atlanta classification and definitions by international consensus. Gut. 2013;62(1):102–111. doi:10.1136/gutjnl-2012-302779
- Zhou Y, Hao N, Duan Z, et al. Assessment of Acute Pancreatitis Severity and Prognosis with CT-Measured Body Composition. Int J Gen Med. 2021;14:3971–3980. doi:10.2147/IJGM.S322589
- Canamares-Orbis P, Garcia-Rayado G, Alfaro-Almajano E. Nutritional Support in Pancreatic Diseases. Nutrients. 2022;14(21):4570. doi:10.3390/nu14214570
- Cederholm T, Jensen GL, Correia M, et al. GLIM criteria for the diagnosis of malnutrition - A consensus report from the global clinical nutrition community. J Cachexia Sarcopenia Muscle. 2019;10(1):207–217. doi:10.1002/jcsm.12383
- Christou NV, Bernard GR, Sprung CL, Sibbald WJ. Multiple organ dysfunction score: a reliable descriptor of a complex clinical outcome. Crit Care Med. 1995;23(10):1638–1652.
- Fan J, Ding L, Lu Y, Zheng J, Zeng Y, Huang C. Epidemiology and Etiology of Acute Pancreatitis in Urban and Suburban Areas in Shanghai: a Retrospective Study. Gastroenterol Res Pract. 2018;2018:1420590. doi:10.1155/2018/1420590
- Quan H, Li B, Couris CM, et al. Updating and validating the Charlson comorbidity index and score for risk adjustment in hospital discharge abstracts using data from 6 countries. Am J Epidemiol. 2011;173(6):676–682. doi:10.1093/aje/kwq433
- Compher C, Cederholm T, Correia M, et al. Guidance for assessment of the muscle mass phenotypic criterion for the Global Leadership Initiative on Malnutrition diagnosis of malnutrition. JPEN J Parenter Enteral Nutr. 2022;46(6):1232–1242. doi:10.1002/jpen.2366
- Cederholm T, Krznaric Z, Pirlich M. Diagnosis of malnutrition in patients with gastrointestinal diseases: recent observations from a Global Leadership Initiative on Malnutrition perspective. Curr Opin Clin Nutr Metab Care. 2020;23(5):361–366. doi:10.1097/mco.0000000000000678
- Dedhia PH, White Y, Dillman JR, et al. Reduced paraspinous muscle area is associated with post-colectomy complications in children with ulcerative colitis. J Pediatr Surg. 2018;53(3):477–482. doi:10.1016/j.jpedsurg.2017.09.006
- Zager Y, Khalilieh S, Ganaiem O, et al. Low psoas muscle area is associated with postoperative complications in Crohn’s disease. Int J Colorectal Dis. 2021;36(3):543–550. doi:10.1007/s00384-020-03799-1
- Parhiala M, Ukkonen M, Sand J, Laukkarinen J. Osteoporosis and sarcopenia are common and insufficiently diagnosed among chronic pancreatitis patients. BMC Gastroenterol. 2023;23(1):124. doi:10.1186/s12876-023-02756-w
- Choudhary S, Wadhawan M, Dhawan S, et al. Normative values of skeletal muscle indices for nutritional assessment and implications on definition of sarcopenia in Indian adult population. Indian J Gastroenterol. 2022;41(1):69–76. doi:10.1007/s12664-021-01207-2
- Furkan Ufuk DH. Reference Skeletal Muscle Mass Values at L3 Vertebrae Level Based on Computed Tomography in Healthy Turkish Adults. Int J Gerontol. 2019;13:221–225. doi:10.6890/IJGE.201909_13(3).0008
- Golse N, Bucur PO, Ciacio O, et al. A new definition of sarcopenia in patients with cirrhosis undergoing liver transplantation. Liver Transpl. 2017;23(2):143–154. doi:10.1002/lt.24671
- De Marco D, Mamane S, Choo W, et al. Muscle Area and Density Assessed by Abdominal Computed Tomography in Healthy Adults: effect of Normal Aging and Derivation of Reference Values. J Nutr Health Aging. 2022;26(2):243–246. doi:10.1007/s12603-022-1746-3
- Lee DH, Keum N, Hu FB, et al. Predicted lean body mass, fat mass, and all cause and cause specific mortality in men: prospective US cohort study. BMJ. 2018;362:k2575. doi:10.1136/bmj.k2575
- Kano M, Hihara J, Tokumoto N, et al. Association between skeletal muscle loss and the response to nivolumab immunotherapy in advanced gastric cancer patients. Int J Clin Oncol. 2021;26(3):523–531. doi:10.1007/s10147-020-01833-4
- Ohara M, Suda G, Kimura M, et al. Analysis of the optimal psoas muscle mass index cut-off values, as measured by computed tomography, for the diagnosis of loss of skeletal muscle mass in Japanese people. Hepatol Res. 2020;50(6):715–725. doi:10.1111/hepr.13499
- Kim JS, Kim WY, Park HK, Kim MC, Jung W, Ko BS. Simple Age Specific Cutoff Value for Sarcopenia Evaluated by Computed Tomography. Ann Nutr Metab. 2017;71(3–4):157–163. doi:10.1159/000480407
- Hiraoka A, Aibiki T, Okudaira T, et al. Muscle atrophy as pre-sarcopenia in Japanese patients with chronic liver disease: computed tomography is useful for evaluation. J Gastroenterol. 2015;50(12):1206–1213. doi:10.1007/s00535-015-1068-x
- Bahat G, Turkmen BO, Aliyev S, Catikkas NM, Bakir B, Karan MA. Cut-off values of skeletal muscle index and psoas muscle index at L3 vertebra level by computerized tomography to assess low muscle mass. Clinical Nutrition. 2021;40(6):4360–4365. doi:10.1016/j.clnu.2021.01.010
- Hamaguchi Y, Kaido T, Okumura S, et al. Proposal for new diagnostic criteria for low skeletal muscle mass based on computed tomography imaging in Asian adults. Nutrition. 2016;32(11–12):1200–1205. doi:10.1016/j.nut.2016.04.003
- Nauheim DO, Hackbart H, Papai E, et al. Preoperative sarcopenia is a negative predictor for enhanced postoperative recovery after pancreaticoduodenectomy. Langenbeck’s Arch Surgery. 2022;407:2355–2362. doi:10.1007/s00423-022-02558-w
- Fehrenbach U, Wuensch T, Gabriel P, et al. CT Body Composition of Sarcopenia and Sarcopenic Obesity: predictors of Postoperative Complications and Survival in Patients with Locally Advanced Esophageal Adenocarcinoma. Cancers. 2021;13(12):2921. doi:10.3390/cancers13122921
- Chen FF, Ye XN, Jiang HT, et al. Role of Frailty and Comorbidity Status in Predicting Morbidity and Mortality in Patients with Acute Mesenteric Ischemia. Ann Vasc Surg. 2020;67:105–114. doi:10.1016/j.avsg.2020.03.037
- Zuckerman J, Ades M, Mullie L, et al. Psoas Muscle Area and Length of Stay in Older Adults Undergoing Cardiac Operations. Ann Thorac Surg. 2017;103(5):1498–1504. doi:10.1016/j.athoracsur.2016.09.005
- Paajanen P, Lindström I, Oksala N, et al. Radiographically quantified sarcopenia and traditional cardiovascular risk assessment in predicting long-term mortality after endovascular aortic repair. J Vasc Surg. 2022;76:908–915. doi:10.1016/j.jvs.2022.03.859
- Gallone G, Depaoli A, D’Ascenzo F, et al. Impact of computed-tomography defined sarcopenia on outcomes of older adults undergoing transcatheter aortic valve implantation. J Cardiovasc Comput Tomogr. 2022;16(3):207–214. doi:10.1016/j.jcct.2021.12.001
- Lucijanic M, Huzjan Korunic R, Sedinic M, Kusec R, Pejsa V. More Pronounced Muscle Loss During Immunochemotherapy is Associated with Worse Clinical Outcomes in Newly Diagnosed Patients with Diffuse Large B-Cell Lymphoma with Unfavorable Features. Ther Clin Risk Manag. 2021;17:1037–1044. doi:10.2147/tcrm.S323749
- Doonan RJ, Bin-Ayeed S, Charbonneau P, et al. Low Psoas Muscle Area is Associated with Increased Mortality and Spinal Cord Injury after Complex Endovascular Aortic Aneurysm Repair. Ann Vasc Surg. 2022. doi:10.1016/j.avsg.2022.05.037
- Imamura H, Haraguchi M, Minami S, et al. The Impact of Low Muscle Mass in Patients Undergoing Emergency Surgery for Colonic Perforation - A Single-center Experience. vivo. 2019;33(2):523–528. doi:10.21873/invivo.11505
- Modesto AE, Stuart CE, Cho J, Ko J, Singh RG, Petrov MS. Psoas muscle size as a magnetic resonance imaging biomarker of progression of pancreatitis. Eur Radiol. 2020;30(5):2902–2911. doi:10.1007/s00330-019-06633-7
- Akturk Y, Ozbal Gunes S, Hekimoglu B. The Effects of the Fat Distribution of Body, Skeletal Muscle Mass and Muscle Quality on Acute Pancreatitis Severity: a Retrospective Cross-Sectional Study. J Comput Assist Tomogr. 2021;45(4):500–506. doi:10.1097/rct.0000000000001175
- Yoshikawa T, Miyamoto M, Aoyama T, et al. Psoas muscle index at the fifth lumbar vertebra as a predictor of survival in epithelial ovarian cancers. Mol Clin Oncol. 2021;15(3):177. doi:10.3892/mco.2021.2339
- Hamaguchi Y, Kaido T, Okumura S, et al. Impact of quality as well as quantity of skeletal muscle on outcomes after liver transplantation. Liver Transpl. 2014;20(11):1413–1419. doi:10.1002/lt.23970
- Jang HY, Choi GH, Hwang SH, et al. Sarcopenia and visceral adiposity predict poor overall survival in hepatocellular carcinoma patients after curative hepatic resection. Transl Cancer Res. 2021;10(2):854–866. doi:10.21037/tcr-20-2974
- Kurumisawa S, Kawahito K. The psoas muscle index as a predictor of long-term survival after cardiac surgery for hemodialysis-dependent patients. J Artif Organs. 2019;22(3):214–221. doi:10.1007/s10047-019-01108-4
- Minami S, Ihara S, Tanaka T, Komuta K. Sarcopenia and Visceral Adiposity Did Not Affect Efficacy of Immune-Checkpoint Inhibitor Monotherapy for Pretreated Patients With Advanced Non-Small Cell Lung Cancer. World J Oncol. 2020;11(1):9–22. doi:10.14740/wjon1225
- Minami S, Ihara S, Komuta K. Sarcopenia and Visceral Adiposity Are Not Independent Prognostic Markers for Extensive Disease of Small-Cell Lung Cancer: a Single-Centered Retrospective Cohort Study. World J Oncol. 2020;11(4):139–149. doi:10.14740/wjon1289
- Barazanchi A, Bhat S, Wells CI, Taneja A, MacCormick AD, Hill AG. Short and long-term impact of sarcopenia on outcomes from emergency laparotomy. Eur J Trauma Emerg Surg. 2022;48:3869–3878. doi:10.1007/s00068-021-01833-7
- Szatmary P, Grammatikopoulos T, Cai W, et al. Acute pancreatitis: diagnosis and treatment. Drugs. 2022;82(12):1251–1276. doi:10.1007/s40265-022-01766-4