
Abstract
Background
The specific molecular mechanistic link between atherosclerotic plaques and ischemic stroke (IS) is not clear. The aim of this study is to explore the potential molecular relationship between atherosclerotic plaques and IS.
Methods
All data were downloaded from the Gene Expression Omnibus (GEO) database. Key hub differentially expressed mRNAs (DEmRNAs) related to atherosclerotic plaques and IS were identified by differential expression analysis and least absolute shrinkage and selection operator (LASSO) analysis. Subsequently, a diagnostic model was established based on the expression of key hub DEmRNAs and logistic regression. In order to understand the molecular mechanism of key hub DEmRNAs, the transcription factor (TF) regulatory network and mRNA-miRNA-lncRNA regulatory network were also constructed. In addition, functional enrichment analysis and single-sample Gene Set Enrichment Analysis (ssGSEA) analysis were also performed.
Results
Four key hub DEmRNAs (ADCY3, CLDN7, PPM1B and RRAS2) were identified by differential expression analysis and LASSO analysis. Moreover, the diagnostic model based on four key hub DEmRNAs has excellent diagnostic accuracy. We also found that Type 1 T helper cell may be associated with IS caused by atherosclerosis based on ssGSEA analysis. In the mRNA-miRNA-lncRNA regulatory network, we found that multiple signaling axes such as RRAS2-hsa-miR-3150b-3p-ILF3-AS1, PPM1B-hsa-miR-541-5p-LINC00294, CLDN7-hsa-miR-184-LINC00467 and ADCY3-hsa-miR-488-3p-URB1-AS1 may play an important role in the progression of IS. In addition, some signaling pathways, including chemokine signaling pathway, MAPK signaling pathway and cAMP signaling pathway, may be involved in regulating IS.
Conclusion
The identified key molecules, signaling pathways and immune cells may help to provide a theoretical basis for exploring the relationship between atherosclerotic plaque and the progression of IS.
Introduction
Ischemic stroke (IS) is a general term for brain tissue necrosis caused by stenosis or occlusion of the blood supply arteries (carotid and vertebral arteries) of the brain and insufficient blood supply to the brain.Citation1 IS has high morbidity, high disability rate and high mortality, which seriously endanger human physical and mental health.Citation2 Moreover, with the aging of the population, the lifetime risk of stroke has increased.Citation3 Early diagnosis and prevention of IS plays an important role in patient treatment. Atherosclerosis is a multifocal slowly progressive process. This chronic metabolic and inflammatory process is characterized by the formation of plaques.Citation4 Atherosclerotic plaque is one of the important risk factors for IS.Citation5 Atherosclerotic plaque instability and plaque surface irregularity are closely associated with a high risk of IS.Citation6 Intracranial plaque enhancement is closely related to ipsilateral acute IS, and it is also helpful to diagnose the cause of stroke.Citation7 At present, the relationship between atherosclerosis plaque and IS is deeply concerned. Exploring the potential molecular association between atherosclerotic plaques and IS is helpful for the diagnosis and management of patients with IS.
In this study, atherosclerotic plaque and IS data were downloaded from the Gene Expression Omnibus (GEO) database.Citation8 Then, hub differentially expressed mRNAs (DEmRNAs) associated with plaque and IS were identified by differential expression analysis. In order to understand the biological processes that the hub DEmRNAs may be involved in, gene ontology (GO) and Kyoto Encyclopedia of Genes and Genomes (KEGG) functional enrichment analysis of the hub DEmRNAs were performed based on the GeneCodis4.0 database. Subsequently, the diagnostic model was established through logistic regression. In addition, the mRNA-miRNA-lncRNA regulatory network was constructed to further understand the molecular mechanisms of key hub DEmRNAs. This study may lay the foundation for understanding the molecular link between atherosclerotic plaques and IS, and lay the molecular foundation for precision medicine in patients with IS.
Materials and Methods
Data Acquisition
Only GSE146882 dataset was found by retrieving mRNA data of atherosclerosis induced IS in GEO database. IS mRNA data were retrieved from the GEO database, and it was found that GSE16561 was the dataset with the largest sample size. Only GSE28829 dataset was found by retrieving mRNA data of early and advanced atherosclerotic plaque in GEO database. Carotid plaque data was retrieved from the GEO database, and it was found that the GSE207252 dataset contained mRNA and lncRNA, which involved a more comprehensive set of genes. Four microarray datasets (GSE207252, GSE146882, GSE28829 and GSE16561) were downloaded from the GEO database (https://www.ncbi.nlm.nih.gov/geo/). GSE207252 dataset (platform: GPL23178) includes four carotid atherosclerotic plaque tissue samples and four surrounding control tissue samples. GSE146882 dataset (platform: GPL23178) includes 10 blood samples of IS induced by atherosclerosis and 10 blood samples of matched control groups. The GSE28829 dataset (platform: GPL570) includes 13 early atherosclerotic plaque tissue samples and 16 advanced atherosclerotic plaque tissue samples. GSE16561 dataset (platform: GPL570) includes 39 blood samples from IS and 24 blood samples from matched control groups. The GSE207252, GSE146882 and GSE28829 datasets were used to search for differentially expressed genes in the same direction. The diagnosis model is constructed in the GSE146882 dataset and verified in the GSE16561 dataset. In addition, GSE95204 dataset (platform: GPL18058) was also downloaded from the GEO database to identify differentially expressed miRNAs. GSE95204 dataset includes three blood samples from IS and three blood samples from matched control groups.
Identification of Hub DEmRNAs
The “limma” package was used to identify DEmRNAs in the GSE207252, GSE146882 and GSE28829 datasets. The screening criterion for DEmRNAs was set to P < 0.05. Subsequently, the intersection of DEmRNAs with the same differential expression direction in GSE207252, GSE146882 and GSE28829 datasets was defined as the hub DEmRNAs. Then, in order to understand the biological processes that the hub DEmRNAs may be involved in, GO and KEGG functional enrichment analysis of the hub DEmRNAs was performed based on the GeneCodis4.0 database (https://genecodis.genyo.es/). P < 0.05 was considered statistically significant.
Construction of Diagnostic Model
The glmnet package (version 3.0) was used for LASSO analysis of hub DEmRNAs to reduce overfitting. Subsequently, a diagnostic model was established based on the expression of key hub DEmRNAs and logistic regression in the GSE146882 dataset. The area under the receiver operating characteristic (ROC) curve (AUC) is an evaluation index for the performance of the model. ROC analysis was performed using the pROC package (http://web.expasy.org/pROC/). AUC >0.7 indicates good diagnostic accuracy.Citation9 In addition, ROC was also used to analyze the potential diagnostic value of key hub DEmRNAs in IS.
Construction of Transcription Factor (TF) Regulatory Network and mRNA-miRNA-lncRNA Regulatory Network
The TF regulatory network of key hub DEmRNAs was constructed based on the TRRUST database (https://www.grnpedia.org/trrust/). In addition, the mRNA-miRNA-lncRNA regulatory network was also constructed. The miRNAs targeting key hub DEmRNAs are predicted based on the ENCORI database (http://starbase.sysu.edu.cn/index.php). Meanwhile, differential expression analysis of miRNA data in the GSE95204 dataset was performed (P < 0.05). Subsequently, the predicted miRNAs were intersected with differentially expressed miRNAs (DEmiRNAs), and miRNA negatively targeted to key hub DEmRNAs were selected. Similarly, lncRNAs associated with miRNAs negatively targeting key hub DEmRNAs were predicted based on ENCORI database. Then, the lncRNAs related to the key hub DEmRNAs were further screened through correlation analysis (P < 0.05). Finally, a mRNA-miRNA-lncRNA regulatory network was constructed.
Analysis of Immune Cell Infiltration
Gene sets for labeling activated CD8 T cells, activated dendritic cells, macrophages, natural killer T cells and other immune cell types were obtained from Charoentong’s study.Citation10 The ssGSEA algorithm is used to quantify the relative abundance of each immune cell infiltration in the immune microenvironment of IS. The Wilcoxon test was used to compare the difference of immune cell infiltration between the control group and the IS group in the GSE146882 dataset. In addition, Spearman correlation analysis was used to evaluate the correlation between ADCY3, CLDN7, PPM1B and RRAS2 and differential immune cells.
Real-Time Polymerase Chain Reaction (PCR) Verification
All included individuals received color ultrasound, MRI, and other examinations. Patients diagnosed with IS comply with the Chinese guidelines for the diagnosis and treatment of acute IS. In addition, patients with a history of cardiovascular and cerebrovascular diseases, combined with serious liver and kidney diseases, malignant blood diseases or tumors were excluded. A total of 32 blood samples (including 7 IS patients without plaque, 3 healthy control individuals, 7 individuals with plaque without IS, and 15 IS patients with plaque) were obtained with written consent, which was approval by the ethics institute of our hospital. The clinical information of the samples included in this study is shown in Table S1. RNAliquid ultrafast whole blood (liquid sample) total RNA extraction kit (Beijing Huitian Oriental Technology Co., LTD, RN2602) was used to extract total RNA in blood samples. The FastKing cDNA first-strand synthesis kit (TIANGEN, KR116) and SuperReal PreMix Plus (SYBR Green) (TIANGEN, FP205) were used for reverse transcription and real-time PCR validation, respectively. GAPDH and ACTB were internal reference genes. The 2−ΔΔCT method was used for relatively quantitative analysis of gene expression data. Subsequently, the value of the diagnostic model was further evaluated based on data from 15 IS patients with plaque and 3 healthy control individuals.
Statistical Analysis
R software was used for statistical analysis of all data. The “limma” package was used to identify DEmRNAs in the GSE207252, GSE146882 and GSE28829 datasets. The glmnet package (version 3.0) was used for LASSO analysis of hub DEmRNAs to reduce overfitting. The Wilcoxon test was used to compare the difference of immune cell infiltration between the control group and the IS group in the GSE146882 dataset.
Results
Identification of Hub DEmRNAs
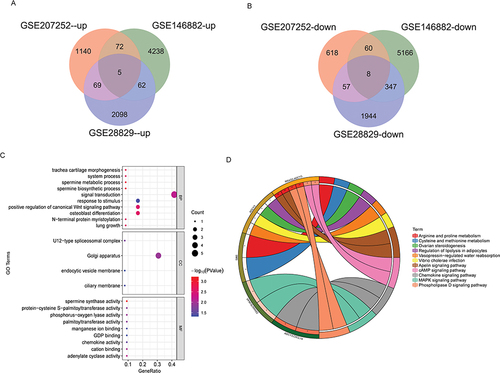
In GSE207252 dataset, 2029 DEmRNAs were identified in carotid atherosclerotic plaque tissues compared with the control group, of which 1286 were up-regulated and 743 were down regulated. Volcano plot and heatmap of the top 25 up- or down-regulated DEmRNAs are shown in and . In GSE146882 dataset, 9985 DEmRNAs were identified in IS compared with the control group, of which 4377 were up-regulated and 5581 were down-regulated. Volcano plot and heatmap of the top 25 up- or down-regulated DEmRNAs are shown in and . In GSE28829 dataset, 4590 DEmRNAs were identified in advanced atherosclerotic plaque tissue compared with the early atherosclerotic plaque tissue, of which 2234 were up-regulated and 2356 were down-regulated. Volcano plot and heatmap of the top 25 up- or down-regulated DEmRNAs are shown in and . Subsequently, the intersection of DEmRNAs with the same differential expression direction in GSE207252, GSE146882 and GSE28829 datasets was defined as the hub DEmRNAs. Finally, 13 hub DEmRNAs were obtained, of which 5 were up-regulated and 8 were down-regulated ( and ). To understand the potential biological functions of hub DEmRNAs, we performed GO and KEGG functional enrichment analysis. GO functional enrichment analysis found that hub DEmRNAs were mainly enriched in signal transduction, response to stimulus, positive regulation of canonical Wnt signaling pathway and Golgi apparatus (). KEGG function analysis showed that hub DEmRNAs were significantly enriched in chemokine signaling pathway, MAPK signaling pathway, cAMP signaling pathway and other signaling pathways ( and Table S2).
Figure 1 Identification of DEmRNAs in GSE207252, GSE146882 and GSE28829 datasets. (A) Volcano plot of DEmRNAs in GSE207252 dataset; (B) Heatmap of the top 25 up- or down-regulated DEmRNAs in GSE207252 dataset; (C) Volcano plot of DEmRNAs in GSE146882 dataset; (D) Heatmap of the top 25 up- or down-regulated DEmRNAs in GSE146882 dataset; (E) Volcano plot of DEmRNAs in GSE28829 dataset; (F) Heatmap of the top 25 up- or down-regulated DEmRNAs in GSE28829 dataset.
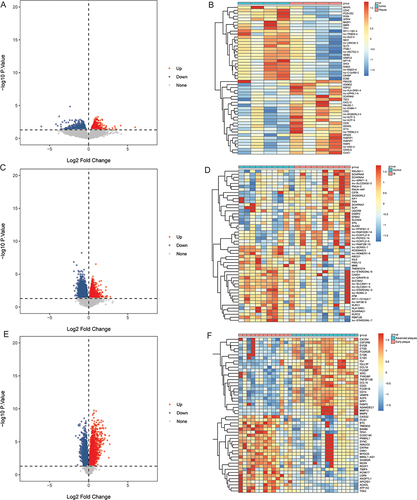
Figure 2 Identification of hub DEmRNAs. (A) Venn diagram of up-regulated DEmRNAs in GSE207252, GSE146882 and GSE28829 datasets; (B) Venn diagram of down-regulated DEmRNAs in GSE207252, GSE146882 and GSE28829 datasets; (C) Bubble plot of GO functional enrichment analysis of hub DEmRNAs; (D) KEGG functional enrichment analysis of hub DEmRNAs. *P <0.05; **P <0.01.
Construction of Diagnostic Model in GSE146882 Dataset
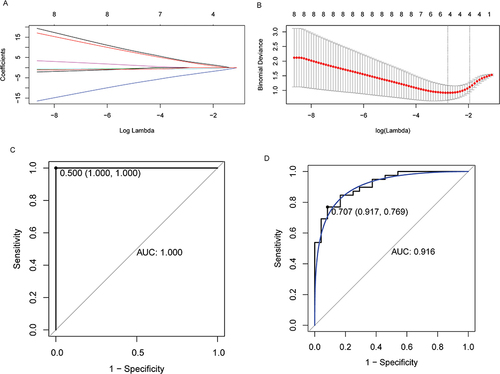
Four key hub DEmRNAs (ADCY3, CLDN7, PPM1B and RRAS2) were selected by LASSO analysis ( and ). Then, a diagnostic model was established based on the expression of ADCY3, CLDN7, PPM1B and RRAS2 and logistic regression in the GSE146882 dataset. ROC analysis results showed that the AUC value of the diagnostic model was 1, which implied that the diagnostic model composed of ADCY3, CLDN7, PPM1B and RRAS2 had excellent diagnostic accuracy (). We also validate the diagnostic accuracy of the diagnostic model in the GSE16561 dataset. The results showed AUC values, sensitivity and 1-specificity of 0.916, 0.769 and 0.917, respectively. In addition, compared with AUC=0.5, the P of this model was 2.96e-35. This result once again implied that the diagnostic model has high diagnostic accuracy (). In addition, ROC was also used to analyze the potential diagnostic value of ADCY3, CLDN7, PPM1B and RRAS2 in IS. The results show that ADCY3, CLDN7, PPM1B and RRAS2 also have very good diagnostic accuracy in IS (Figure S1). Notably, the diagnostic accuracy of the diagnostic model is better than that of the single key hub DEmRNA. Therefore, the diagnostic model composed of ADCY3, CLDN7, PPM1B and RRAS2 may be a novel signature for the diagnosis of IS.
Figure 3 Construction of a diagnostic model. (A) LASSO analysis coefficient distribution diagram; (B) LASSO analysis parameter diagram; (C) ROC analysis of diagnostic model in GSE146882 dataset; (D) ROC analysis of diagnostic model in GSE16561 dataset.
Construction of TF Regulatory Network and mRNA-miRNA-lncRNA Regulatory Network
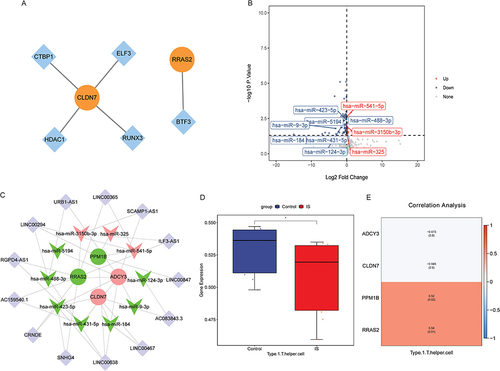
TF associated with RRAS2 and CLDN7 was identified based on the TRRUST database. The TF regulatory network was visualized using Cytoscape (). The results showed that CLDN7 was correlated with CTBP1, ELF3, HDAC1 and RUNX3, and RRAS2 was correlated with BTF3. Subsequently, 127 DEmiRNAs were identified based on the GSE95204 dataset, of which 33 were up-regulated and 94 were down-regulated (). Then, 127 DEmiRNAs were intersected with the miRNAs predicted in ENCORI database, and the miRNAs that were negatively targeted to ADCY3, CLDN7, PPM1B and RRAS2 were selected. A total of 10 miRNAs (hsa-miR-124-3p, hsa-miR-9-3p, hsa-miR-184, hsa-miR-431-5p, hsa-miR-423-5p, hsa-miR-488-3p, hsa-miR-5194, hsa-miR-3150b-3p, hsa-miR-325 and hsa-miR-541-5p) were obtained, involving 12 miRNA-mRNA pairs (Table S3). Similarly, lncRNAs associated with these 10 miRNAs were predicted based on ENCORI database. Then, the correlation between these lncRNAs and ADCY3, CLDN7, PPM1B and RRAS2 was analyzed based on the GSE146882 dataset. The lncRNAs associated with ADCY3, CLDN7, PPM1B and RRAS2 were screened (P < 0.05), and finally 13 lncRNAs were obtained (Table S4). PPM1B and LINC00847 have the highest correlation (0.85). Subsequently, the mRNA-miRNA-lncRNA regulatory network was constructed based on 13 lncRNAs, 10 miRNAs, ADCY3, CLDN7, PPM1B and RRAS2 (). In the mRNA-miRNA-lncRNA regulatory network, we found that multiple signaling axes such as RRAS2-hsa-miR-3150b-3p-ILF3-AS1, PPM1B-hsa-miR-541-5p-LINC00294, CLDN7-hsa-miR-184-LINC00467 and ADCY3-hsa-miR-488-3p-URB1-AS1 may play an important role in the progression of IS.
Figure 4 Construction of regulatory networks and analysis of immune cell infiltration. (A) TF regulatory network. Orange and blue represent mRNAs and TF, respectively. (B) Volcano plot of DEmiRNAs in GSE95204 dataset. Ten DEmiRNAs negatively targeted with ADCY3, CLDN7, PPM1B and RRAS2 were marked. (C) mRNA-miRNA-lncRNA regulatory network. Circles, V-shapes represent mRNAs and miRNAs, respectively. Red and green represent up- and down-regulated, respectively. Purple diamonds represent lncRNAs. (D) SSGSEA analysis showed that Type 1 T helper cell had infiltration differences between the control group and the IS group. (E) Spearman correlation analysis was used to evaluate the correlation between ADCY3, CLDN7, PPM1B and RRAS2 and Type 1 T helper cell. *P <0.05.
Analysis of Immune Cell Infiltration in IS
Through ssGSEA analysis, it was found that only Type 1 T helper cell had differences between the control group and the IS group (). Subsequently, the correlations of ADCY3, CLDN7, PPM1B, RRAS2, and Type 1 T helper cell were analyzed. The results showed that Type 1 T helper cell was significantly positively correlated with PPM1B and RRAS2 (). This implies that PPM1B and RRAS2 may play a role in the immune regulatory mechanism of IS by regulating Type 1 T helper cell.
Expression Validation of ADCY3, CLDN7, PPM1B and RRAS2 by Real-Time PCR
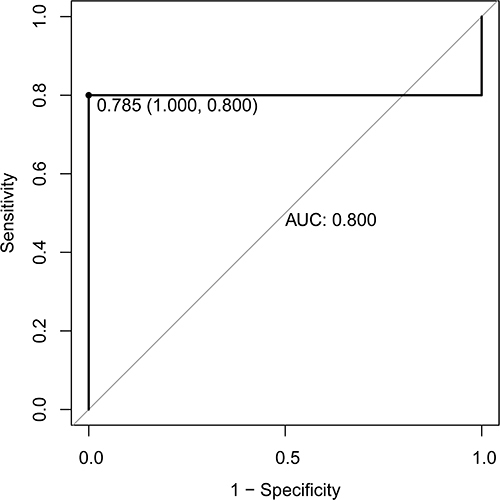
In order to verify the results of bioinformatics analysis, the expression of ADCY3, CLDN7, PPM1B and RRAS2 in blood samples of each group was detected by real-time PCR. The primers used for real-time PCR verification are shown in . Compared with no plaque stroke group, ADCY3 and CLDN7 tended to be up-regulated in plaque and stroke group, while PPM1B and RRAS2 tended to be down-regulated (). Similarly, compared with the healthy control group, ADCY3 and CLDN7 tended to be up-regulated in no stroke plaque group, while PPM1B and RRAS2 tended to be down-regulated (). The expression trends of ADCY3, CLDN7, PPM1B and RRAS2 in real-time PCR validation were consistent with the results of public database analysis, but lacked significance. Subsequently, the diagnostic value of the models constructed by ADCY3, CLDN7, PPM1B and RRAS2 was evaluated again based on data from 15 IS patients with plaque and 3 healthy control individuals. The ROC result found that the AUC value was 0.8, which further indicates that the model has high diagnostic accuracy (). The lack of significance of real-time PCR results may be caused by the small sample size. Therefore, it is necessary to collect a large number of samples for further research.
Table 1 Primers Used for Real-Time PCR
Figure 5 Expression validation of ADCY3, CLDN7, PPM1B and RRAS2 by real-time PCR. (A) Relative expression level of ADCY3; (B) Relative expression level of CLDN7; (C) Relative expression level of PPM1B; (D) Relative expression level of RRAS2.
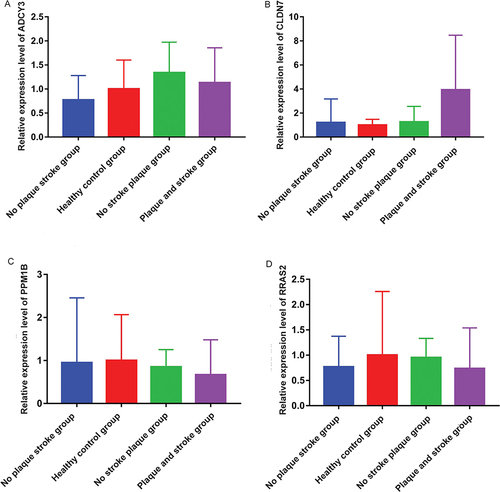
Figure 6 ROC analysis of diagnostic model based on data from 15 IS patients with plaque and 3 healthy control individuals.
Discussion
IS is closely related to the occurrence of atherosclerotic plaque. In this study, four key hub DEmRNAs (ADCY3, CLDN7, PPM1B, RRAS2) related to atherosclerotic plaque and IS were identified by differential expression analysis and LASSO analysis. Adenylate cyclase 3 (ADCY3) encodes adenylyl cyclase, which catalyzes cAMP synthesis, and its expression in hypothalamic primary cilia can regulate body weight.Citation11 An oncology study showed that LINC00319, as a microRNA-335-5p sponge, accelerates tumor growth and metastasis of gastric cancer by up regulating ADCY3.Citation12 Moreover, ADCY3 is also an effective target for the prevention of unstable carotid plaque formation.Citation13 Claudin 7 (CLDN7) is an important member of the claudin family, which is involved in tight junctions and maintenance of intercellular adhesion.Citation14,Citation15 Zika virus (ZIKV) infection is associated with a series of neuropathologies. Down-regulation of CLDN7 reduced the susceptibility of the human cerebral microvascular endothelial cell line hCMEC/D3 to ZIKV infection.Citation16 Protein phosphatase, Mg2+/Mn2+ dependent 1B (PPM1B), a member of the protein phosphatase 2C family, is a key regulator of cellular and tissue aging.Citation17 PPM1B expression levels were also negatively correlated with gastrocnemius muscle atrophy after denervation.Citation18 RAS related 2 (RRAS2) mutations may play an important role in Noonan syndrome with hydrocephalus and neuropathy.Citation19 RRAS2 also plays an important regulatory role in platelet activation and thrombus stability in vivo.Citation20 RRAS2 is aberrantly expressed in central nervous system tumors and correlated with the degree of malignancy, which suggests that the abnormal expression of RRAS2 may be an early event of neural cell transformation.Citation21 Through ROC analysis, we also found that ADCY3, CLDN7, PPM1B and RRAS2 have very good diagnostic accuracy in IS. In addition, a diagnostic model was established based on ADCY3, CLDN7, PPM1B and RRAS2. ROC analysis results showed that the diagnostic model had excellent diagnostic accuracy. Notably, the diagnostic accuracy of the diagnostic model is better than that of the single key hub DEmRNA. Therefore, the diagnostic model composed of ADCY3, CLDN7, PPM1B and RRAS2 may be a novel signature for the diagnosis of IS. Therefore, we speculated that ADCY3, CLDN7, PPM1B and RRAS2 play important regulatory roles in IS caused by atherosclerotic plaques, and exploring their molecular mechanisms is beneficial to the diagnosis and management of IS.
Type 1 T helper cell produce interferon gamma, IL-2, and TNF-β, which activate macrophages and are responsible for cell-mediated immunity and phagocytic dependent protective.Citation22 Serum Type 1 T helper cell cytokines were significantly reduced in patients with acute stroke.Citation23 Reduced interferon gamma production seriously affects the antimicrobial defense ability after stroke.Citation24 Liu et al found that Type 1 T helper cell significantly decreased in peripheral blood after IS through xCell algorithm analysis.Citation25 In addition, single-cell sequencing found that T cells are abnormal in atherosclerotic plaques and are associated with the most pronounced dysfunction in plaques.Citation26,Citation27 In this study, through ssGSEA analysis, it was found that only Type 1 T helper cell had differences between the control group and the IS group. Moreover, Type 1 T helper cell was significantly positively correlated with PPM1B and RRAS2. This implies that PPM1B and RRAS2 may play a role in the immune regulatory mechanism of IS by regulating Type 1 T helper cell.
In this study, KEGG analysis found multiple significantly enriched signaling pathways, such as chemokine signaling pathway, MAPK signaling pathway and cAMP signaling pathway. Chemokine signaling pathway is associated with IS progression.Citation28 Chemokines play a key role in the initiation and progression of atherosclerosis. Chemokines mediate immune cell recruitment and control cell homeostasis and activation of different immune cell types and subpopulations. Its production and activation of its receptors form a positive feedback mechanism that recruits monocytes, neutrophils, and lymphocytes into atherosclerotic plaques.Citation29 Chemokines can also promote the recruitment of T cells.Citation30 Chemokine CCL2 is involved in the destruction of blood–brain barrier after acute cerebral hemorrhage.Citation31 MAPK signaling pathway may be involved in mediating neuronal apoptosis in IS.Citation32 MAPK signaling pathway is also involved in regulating inflammation, oxidative stress, cognitive impairment and neuronal damage in IS.Citation33 Moreover, MAPK signaling pathway may also be involved in the regulation of atherosclerotic plaque stability.Citation34 A previous study showed that Ginsenoside Rb1 may improve the functional recovery after stroke by regulating cAMP/PKA/CREB signaling pathway to stimulate axon regeneration and brain repair.Citation35 CAMP also plays a role in immune regulation of acute IS.Citation36 In addition, cAMP also plays a role in the formation and progression of atherosclerosis.Citation37,Citation38 In KEGG functional enrichment analysis, we found that ADCY3 may be involved in regulating chemokine signaling pathway, PPM1B and RRAS2 may be involved in regulating MAPK signaling pathway, and RRAS2 and ADCY3 may also be involved in regulating cAMP signaling pathway. Therefore, we speculated that ADCY3, PPM1B and RRAS2 may play important regulatory roles in IS through multiple signaling pathways, such as chemokine signaling pathway, MAPK signaling pathway and cAMP signaling pathway. At the same time, it also implies that atherosclerotic plaque and IS have an important link in the molecular regulatory mechanism.
In the TF regulatory network, it was found that CLDN7 was correlated with C-terminal binding protein 1 (CTBP1), E74-like ETS transcription factor 3 (ELF3), histone deacetylase 1 (HDAC1) and RUNX family transcription factor 3 (RUNX3), and RRAS2 was correlated with basic transcription factor 3 (BTF3). Previous studies have shown that the expression level and enzyme activity of HDAC1 decreased after stroke, and inhibition of HDAC1 promoted the infarct volume, neuronal loss, DNA damage, neuronal apoptosis, and levels of reactive oxygen species and inflammatory cytokines after stroke.Citation39,Citation40 Moreover, HDAC1 is involved in regulating plaque formation in atherosclerotic mice.Citation41 Studies have shown that RUNX3 is also involved in regulating coronary atherosclerosis progression and stroke.Citation42,Citation43 Up to now, there is no relevant study on CTBP1, ELF3 and BTF3 in the progression of atherosclerotic plaque and stroke. Therefore, we speculated that the role of CLDN7 in ischemic stroke may be regulated by HDAC1 and RUNX3, and the specific mechanism needs further study.
Studies have shown that miRNAs and lncRNAs play a key role in IS.Citation44,Citation45 Moreover, dysregulation of miRNAs and lncRNAs are also associated with the growth, instability and rupture of atherosclerotic plaques.Citation46–49 Overexpression of hsa-miR-126-3p and -5p can reduce the expression of pro-inflammatory cytokines and adhesion molecules, and alleviate the destruction of the blood–brain barrier after IS.Citation50 Hsa-miR-126-5p is also involved in the regulation of endothelial cell apoptosis and atherosclerosis, and its expression is decreased in areas of plaque blood flow disorder.Citation51,Citation52 In order to explore miRNAs and lncRNAs that may affect RRAS2, PPM1B, CLDN7 and ADCY3, we constructed a mRNA-miRNA-lncRNA regulatory network. In the mRNA-miRNA-lncRNA regulatory network, we found that multiple signaling axes such as RRAS2-hsa-miR-3150b-3p-ILF3-AS1, PPM1B-hsa-miR-541-5p-LINC00294, CLDN7-hsa-miR-184-LINC00467 and ADCY3-hsa-miR-488-3p-URB1-AS1. Oncology studies have shown that hsa-miR-3150b-3p and hsa-miR-541-5p can regulate the proliferation, invasion and migration of cancer cells by targeting related genes.Citation53–56 A study showed that hsa-miR-184 expression was down-regulated after IS, and increased levels of hsa-miR-184 reduced brain injury.Citation57 The up-regulated expression of hsa-miR-488-3p inhibited the death of neuron cells and the ischemic cerebral infarction in IS mice.Citation58 Hsa-miR-488-3p is also involved in regulating the activation of astrocytes in IS.Citation59 In this study, we also found that hsa-miR-3150b-3p, hsa-miR-541-5p, hsa-miR-184 and hsa-miR-488-3p were abnormally expressed in IS. Therefore, we speculate that hsa-miR-3150b-3p, hsa-miR-541-5p, hsa-miR-184 and hsa-miR-488-3p may target the regulation of RRAS2, PPM1B, CLDN7 and ADCY3 in the progression of IS. In addition, most studies on ILF3-AS1, LINC00294, LINC00467, and URB1-AS1 focus on oncology, so further studies are needed to understand their potential role in IS.
However, there is still a certain degree of limitations in this study. First of all, the lack of significance of real-time PCR results may be caused by the small sample size. Therefore, a large number of samples need to be collected for further study. Secondly, although the established diagnostic model has a high AUC value, it lacks clinical validation. Therefore, clinical samples need to be collected for later validation. Thirdly, the specific molecular mechanism of the identified key molecules, signaling pathways and immune cells is still unclear, and a large number of experiments in vivo and in vitro are needed to study.
Conclusion
In this study, four key hub DEmRNAs related to atherosclerotic plaque and IS were identified by differential expression analysis and LASSO analysis. Then, a diagnostic model with high diagnostic value was established based on ADCY3, CLDN7, PPM1B and RRAS2. We also found that Type 1 T helper cell may be associated with IS caused by atherosclerosis based on ssGSEA analysis. In addition, some signaling pathways, including chemokine signaling pathway, MAPK signaling pathway and cAMP signaling pathway, may be involved in regulating IS. In order to further understand the molecular mechanism of ADCY3, CLDN7, PPM1B and RRAS2, the TF regulatory network and mRNA-miRNA-lncRNA regulatory network were constructed. In conclusion, this study may help to provide a theoretical basis for exploring the relationship between atherosclerotic plaque and the progression of IS.
Data Sharing Statement
All data in this study were downloaded from GEO database. The persistent accessible web links for GEO is https://www.ncbi.nlm.nih.gov/geo/. Accession numbers of datasets used in the study are GSE207252, GSE146882, GSE28829 and GSE16561 in GEO. All data generated or analyzed during this study are included in this published article.
Ethics Approval and Consent to Participate
The present study was approved by the Ethics Committee of The Second Affiliated Hospital of Shandong First Medical University. This study complied with the Declaration of Helsinki. Written informed consent was obtained from all participants.
Disclosure
Xianjing Zhang and Tingting Han can be considered as co-first authors. The authors declare that they have no conflicts of interest.
Additional information
Funding
References
- Ding Y, Lang Y, Zhang H. Candesartan reduces neuronal apoptosis caused by ischemic stroke via regulating the FFAR1/ITGA4 pathway. Mediators Inflamm. 2022;2022:2356507. doi:10.1155/2022/2356507
- Li DH, Su YF, Sun CX, Fan HF, Gao WJ. A network pharmacology-based identification study on the mechanism of Xiao-Xu-Ming decoction for cerebral ischemic stroke. Evid Based Complement Altern Med. 2020;2020:2507074. doi:10.1155/2020/2507074
- Feske SK. Ischemic Stroke. Am J Med. 2021;134(12):1457–1464. doi:10.1016/j.amjmed.2021.07.027
- Camaré C, Pucelle M, Nègre-Salvayre A, Salvayre R. Angiogenesis in the atherosclerotic plaque. Redox Biol. 2017;12:18–34. doi:10.1016/j.redox.2017.01.007
- Picano E, Paterni M. Ultrasound tissue characterization of vulnerable atherosclerotic plaque. Int J Mol Sci. 2015;16(5):10121–10133. doi:10.3390/ijms160510121
- Zhou S, Liu S, Liu X, Zhuang W. Bioinformatics gene analysis of potential biomarkers and therapeutic targets for unstable atherosclerotic plaque-related stroke. J Mol Neurosci. 2021;71(5):1031–1045. doi:10.1007/s12031-020-01725-2
- Gupta A, Baradaran H, Al-Dasuqi K, et al. Gadolinium enhancement in intracranial atherosclerotic plaque and ischemic stroke: a systematic review and meta-analysis. J Am Heart Assoc. 2016;5(8). doi:10.1161/JAHA.116.003816
- Clough E, Barrett T. The gene expression omnibus database. Methods Mol Biol. 2016;1418:93–110.
- Šimundić AM. Measures of diagnostic accuracy: basic definitions. Ejifcc. 2009;19(4):203–211.
- Charoentong P, Finotello F, Angelova M, et al. Pan-cancer immunogenomic analyses reveal genotype-immunophenotype relationships and predictors of response to checkpoint blockade. Cell Rep. 2017;18(1):248–262. doi:10.1016/j.celrep.2016.12.019
- Barroso I. ADCY3, neuronal primary cilia and obesity. Nat Genet. 2018;50(2):166–167. doi:10.1038/s41588-018-0043-x
- Zou J, Wu K, Lin C, Jie ZG. LINC00319 acts as a microRNA-335-5p sponge to accelerate tumor growth and metastasis in gastric cancer by upregulating ADCY3. Am J Physiol Gastrointest Liver Physiol. 2020;318(1):G10–g22. doi:10.1152/ajpgi.00405.2018
- Liu Y, Huan W, Wu J, Zou S, Qu L. IGFBP6 is downregulated in unstable carotid atherosclerotic plaques according to an integrated bioinformatics analysis and experimental verification. J Atheroscler Thromb. 2020;27(10):1068–1085. doi:10.5551/jat.52993
- Hou Y, Hou L, Liang Y, et al. The p53-inducible CLDN7 regulates colorectal tumorigenesis and has prognostic significance. Neoplasia. 2020;22(11):590–603. doi:10.1016/j.neo.2020.09.001
- Wu Z, Shi J, Song Y, et al. Claudin-7 (CLDN7) is overexpressed in gastric cancer and promotes gastric cancer cell proliferation, invasion and maintains mesenchymal state. Neoplasma. 2018;65(3):349–359. doi:10.4149/neo_2018_170320N200
- Zoladek J, Legros V, Jeannin P, et al. Zika virus requires the expression of claudin-7 for optimal replication in human endothelial cells. Front Microbiol. 2021;12:746589. doi:10.3389/fmicb.2021.746589
- Park JH, Hale TK, Smith RJ, Yang T. PPM1B depletion induces premature senescence in human IMR-90 fibroblasts. Mech Ageing Dev. 2014;138:45–52. doi:10.1016/j.mad.2014.03.003
- Wei J, Liang BS. PPM1B and P-IKKβ expression levels correlated inversely with rat gastrocnemius atrophy after denervation. Braz J Med Biol Res. 2012;45(8):711–715. doi:10.1590/S0100-879X2012007500080
- Weinstock NI, Sadler L. The RRAS2 pathogenic variant p.Q72L produces severe Noonan syndrome with hydrocephalus: a case report. Am J Med Genet A. 2022;188(1):364–368. doi:10.1002/ajmg.a.62523
- Janapati S, Wurtzel J, Dangelmaier C, et al. TC21/RRas2 regulates glycoprotein VI-FcRγ-mediated platelet activation and thrombus stability. J Thromb Haemost. 2018;16:1632–1645. doi:10.1111/jth.14197
- Gutierrez-Erlandsson S, Herrero-Vidal P, Fernandez-Alfara M, et al. R-RAS2 overexpression in tumors of the human central nervous system. Mol Cancer. 2013;12(1):127. doi:10.1186/1476-4598-12-127
- Romagnani S. Th1/Th2 cells. Inflamm Bowel Dis. 1999;5(4):285–294. doi:10.1097/00054725-199911000-00009
- Vogelgesang A, May VE, Grunwald U, et al. Functional status of peripheral blood T-cells in ischemic stroke patients. PLoS One. 2010;5(1):e8718. doi:10.1371/journal.pone.0008718
- Prass K, Meisel C, Höflich C, et al. Stroke-induced immunodeficiency promotes spontaneous bacterial infections and is mediated by sympathetic activation reversal by poststroke T helper cell type 1-like immunostimulation. J Exp Med. 2003;198(5):725–736. doi:10.1084/jem.20021098
- Liu R, Song P, Gu X, et al. Comprehensive landscape of immune infiltration and aberrant pathway activation in ischemic stroke. Front Immunol. 2021;12:766724. doi:10.3389/fimmu.2021.766724
- Depuydt MAC, Schaftenaar FH, Prange KHM, et al. Single-cell T cell receptor sequencing of paired human atherosclerotic plaques and blood reveals autoimmune-like features of expanded effector T cells. Nat Cardiovasc Res. 2023;2(2):112–125. doi:10.1038/s44161-022-00208-4
- Wang Z, Zhang X, Lu S, et al. Pairing of single-cell RNA analysis and T cell antigen receptor profiling indicates breakdown of T cell tolerance checkpoints in atherosclerosis. Nat Cardiovasc Res. 2023;2(3):290–306. doi:10.1038/s44161-023-00218-w
- Li L, Lou W, Li H, Zhu Y, Huang X. Upregulated C-C Motif chemokine ligand 2 promotes ischemic stroke via chemokine signaling pathway. Ann Vasc Surg. 2020;68:476–486. doi:10.1016/j.avsg.2020.04.047
- Bäck M, Weber C, Lutgens E. Regulation of atherosclerotic plaque inflammation. J Intern Med. 2015;278(5):462–482. doi:10.1111/joim.12367
- Hansson GK, Robertson AK, Söderberg-Nauclér C. Inflammation and atherosclerosis. Annu Rev Pathol. 2006;1:297–329. doi:10.1146/annurev.pathol.1.110304.100100
- Guo F, Xu D, Lin Y, et al. Chemokine CCL2 contributes to BBB disruption via the p38 MAPK signaling pathway following acute intracerebral hemorrhage. FASEB J. 2020;34(1):1872–1884. doi:10.1096/fj.201902203RR
- Xiang Y, Zhang Y, Xia Y, Zhao H, Liu A, Chen Y. LncRNA MEG3 targeting miR-424-5p via MAPK signaling pathway mediates neuronal apoptosis in ischemic stroke. Aging. 2020;12(4):3156–3174. doi:10.18632/aging.102790
- Tian R, Wu B, Fu C, Guo K. miR-137 prevents inflammatory response, oxidative stress, neuronal injury and cognitive impairment via blockade of Src-mediated MAPK signaling pathway in ischemic stroke. Aging. 2020;12(11):10873–10895. doi:10.18632/aging.103301
- Fang S, Sun S, Cai H, et al. IRGM/Irgm1 facilitates macrophage apoptosis through ROS generation and MAPK signal transduction: irgm1(±) mice display increases atherosclerotic plaque stability. Theranostics. 2021;11(19):9358–9375. doi:10.7150/thno.62797
- Gao X, Zhang X, Cui L, et al. Ginsenoside Rb1 promotes motor functional recovery and axonal regeneration in post-stroke mice through cAMP/PKA/CREB signaling pathway. Brain Res Bull. 2020;154:51–60. doi:10.1016/j.brainresbull.2019.10.006
- Xin M, Feng J, Hao Y, et al. Cyclic adenosine monophosphate in acute ischemic stroke: some to update, more to explore. J Neurol Sci. 2020;413:116775. doi:10.1016/j.jns.2020.116775
- Fantidis P. The role of intracellular 3’5’-cyclic adenosine monophosphate (cAMP) in atherosclerosis. Curr Vasc Pharmacol. 2010;8(4):464–472. doi:10.2174/157016110791330843
- Zhou Y, Cao ZQ, Wang HY, et al. The anti-inflammatory effects of Morin hydrate in atherosclerosis is associated with autophagy induction through cAMP signaling. Mol Nutr Food Res. 2017;61(9):1600966. doi:10.1002/mnfr.201600966
- Chen JS, Wang HK, Hsu CY, et al. HDAC1 deregulation promotes neuronal loss and deficit of motor function in stroke pathogenesis. Sci Rep. 2021;11(1):16354. doi:10.1038/s41598-021-95837-3
- Chen JS, Wang HK. Restoration of HDAC1 enzymatic activity after stroke protects neurons from ischemia/reperfusion damage and attenuates behavioral deficits in rats. Int J Mol Sci. 2021;22(19):1.
- Liu H, Wang H, Ma J, Qiao Z, Zhang L, Ge G. MicroRNA-146a-3p/HDAC1/KLF5/IKBα signal axis modulates plaque formation of atherosclerosis mice. Life Sci. 2021;284:119615. doi:10.1016/j.lfs.2021.119615
- Su Z, Lu H, Jiang H, et al. IFN-γ-producing Th17 cells bias by HMGB1-T-bet/RUNX3 axis might contribute to progression of coronary artery atherosclerosis. Atherosclerosis. 2015;243(2):421–428. doi:10.1016/j.atherosclerosis.2015.09.037
- Liu Q, Jin WN, Liu Y, et al. Brain ischemia suppresses immunity in the periphery and brain via different neurogenic innervations. Immunity. 2017;46(3):474–487. doi:10.1016/j.immuni.2017.02.015
- Mens MMJ, Heshmatollah A, Fani L, Ikram MA, Ikram MK, Ghanbari M. Circulatory MicroRNAs as potential biomarkers for stroke risk: the Rotterdam study. Stroke. 2021;52(3):945–953. doi:10.1161/STROKEAHA.120.031543
- Pan Y, Jiao Q, Wei W, Zheng T, Yang X, Xin W. Emerging role of LncRNAs in ischemic stroke-novel insights into the regulation of inflammation. J Inflamm Res. 2021;14:4467–4483. doi:10.2147/JIR.S327291
- Cipollone F, Felicioni L, Sarzani R, et al. A unique microRNA signature associated with plaque instability in humans. Stroke. 2011;42(9):2556–2563. doi:10.1161/STROKEAHA.110.597575
- Maitrias P, Metzinger-Le Meuth V, Massy ZA, et al. MicroRNA deregulation in symptomatic carotid plaque. J Vasc Surg. 2015;62(5):1245–50.e1. doi:10.1016/j.jvs.2015.06.136
- Eken SM, Jin H, Chernogubova E, et al. MicroRNA-210 enhances fibrous cap stability in advanced atherosclerotic lesions. Circ Res. 2017;120(4):633–644. doi:10.1161/CIRCRESAHA.116.309318
- Fasolo F, Jin H, Winski G. Long noncoding RNA MIAT controls advanced atherosclerotic lesion formation and plaque destabilization. Circulation. 2021;144(19):1567–1583. doi:10.1161/CIRCULATIONAHA.120.052023
- Pan J, Qu M, Li Y, et al. MicroRNA-126-3p/-5p overexpression attenuates blood-brain barrier disruption in a mouse model of middle cerebral artery occlusion. Stroke. 2020;51(2):619–627. doi:10.1161/STROKEAHA.119.027531
- Santovito D, Egea V, Bidzhekov K. Noncanonical inhibition of caspase-3 by a nuclear microRNA confers endothelial protection by autophagy in atherosclerosis. Sci Transl Med. 2020;12(546). doi:10.1126/scitranslmed.aaz2294
- Santovito D, Weber C. Non-canonical features of microRNAs: paradigms emerging from cardiovascular disease. Nat Rev Cardiol. 2022;19(9):620–638. doi:10.1038/s41569-022-00680-2
- Zhang W, Chen X, Jia J. MiR-3150b-3p inhibits the progression of colorectal cancer cells via targeting GOLPH3. J Investig Med. 2020;68(2):425–429. doi:10.1136/jim-2019-001124
- Yu Z, Wang L, Li X. MiR-3150b-3p inhibits the proliferation and invasion of cervical cancer cells by targeting TNFRSF11a. J Investig Med. 2020;68(6):1166–1170. doi:10.1136/jim-2020-001284
- Tang J, Wang R, Tang R, Gu P, Han J, Huang W. CircRTN4IP1 regulates the malignant progression of intrahepatic cholangiocarcinoma by sponging miR-541-5p to induce HIF1A production. Pathol Res Pract. 2022;230:153732. doi:10.1016/j.prp.2021.153732
- Li D, Zhang J, Yang J, Wang J, Zhang R, Li J. CircMTO1 suppresses hepatocellular carcinoma progression via the miR-541-5p/ZIC1 axis by regulating Wnt/β-catenin signaling pathway and epithelial-to-mesenchymal transition. Cell Death Dis. 2021;13(1):12. doi:10.1038/s41419-021-04464-3
- Yang H, Zhang Y, Chen H, et al. Mir-184 contributes to brain injury through targeting PPAP2B following ischemic stroke in male rats. Front Mol Neurosci. 2021;14:613887. doi:10.3389/fnmol.2021.613887
- Zhou L, Yang W, Yao E, et al. MicroRNA-488-3p regulates neuronal cell death in cerebral ischemic stroke through Vacuolar Protein Sorting 4B (VPS4B). Neuropsychiatr Dis Treat. 2021;17:41–55. doi:10.2147/NDT.S255666
- Zheng H, Zhang G, Liu G, Wang L. Up-regulation of lncRNA NEAT1 in cerebral ischemic stroke promotes activation of astrocytes by modulation of miR-488-3p/RAC1. Exp Brain Res. 2023;241(2):395–406. doi:10.1007/s00221-022-06519-z