
Abstract
Objective
This study aims to compare the superficial vascular density from the macular region and the retinal nerve fiber layer (RNFL) thickness from the optic disc region between Parkinson’s disease (PD) patients and controls.
Methods
We enrolled 56 idiopathic PD patients, totaling 86 eyes (PD group), and 45 sex- and age-matched healthy individuals, amounting to 90 eyes (control group). All subjects underwent examination using Zeiss wide-field vascular optical coherence tomography (OCT) (Cirrus HD-OCT 5000 Carl Zeiss, Germany), with a scanning range of 3 mm × 3 mm. We divided the images into two concentric circles with diameters of 1 mm and 3 mm at the macular fovea’s center. Patients with PD were evaluated during their “off” phase using the Unified Parkinson’s Disease Rating Scale III (UPDRS-III) and the Hoehn-Yahr scale (H-Y scale) to assess disease severity.
Results
The PD group exhibited significantly lower RNFL thickness (106.13±12.36 μm) compared to the control group (115.95±11.37 μm, P < 0.05). Similarly, the superficial retinal vessel length density was significantly lower in the PD group (20.7 [19.62, 22.17] mm−1) than in the control group (21.79±1.16 mm−1, P < 0.05). Correlation analysis revealed a negative correlation between RNFL thickness and UPDRS III score (rs=−0.036, P=0.037), and RNFL thickness tended to decrease with increasing severity of movement disorders. However, during the 6 and 12-month follow-up of some PD patients, we observed no progressive thinning of the RNFL or decreased superficial vascular density.
Conclusion
PD patients show retinal structural damage characterized by RNFL thinning and reduced retinal vessel length density. However, RNFL thickness did not correlate with vascular density nor did it decrease with the disease’s progression.
Introduction
Parkinson’s Disease (PD), the second-most common neurodegenerative disorder, is characterized primarily by the deposition of α-synuclein (alpha-synuclein, α-syn) and subsequent loss of dopaminergic cells in the substantia nigra.Citation1 Recently, the role of vascular factors in the pathogenesis and progression of PD has come under increasing scrutiny. Studies suggest that individuals with high-risk factors for vascular disease may face elevated risks for PD.Citation2 In a cohort study of early-stage PD patients, the incidence of cardio-cerebrovascular disease was found to be significantly higher than in healthy groups.Citation3 Additionally, substantial evidence from large-scale longitudinal follow-up studies points to a correlation between cerebrovascular risk factors and PD. These studies suggest a reciprocal influence between cerebrovascular diseases and PD, often manifesting as comorbid conditions. Vascular lesions intensify both motor and non-motor symptoms of PD, increase the requirement for dopamine drugs, and exacerbate PD’s pathological progression.Citation4 Hence, the early detection of cerebrovascular injuries is paramount for the timely diagnosis, intervention, and treatment of PD. However, directly detecting and quantitatively analyzing damage to the blood vessels in the central nervous system (CNS) often presents challenges due to the restrictive bony structures encasing the spinal cord, necessitating a shift of focus to the more accessible visual system.
Originating from the diencephalon of the CNS, the retina and optic nerve exhibit a remarkable degree of functional connectivity.Citation5 External light captured by retinal photoreceptors is received by retinal ganglion cells (RGC), the axons of which form optic nerve fibers projecting to the thalamus and midbrain, thereby enabling image perception.Citation6 Structurally, optic nerve fiber bundles are similar to those of the CNS, both being sheathed in myelin produced by oligodendrocytes.Citation7 Additionally, the retina and the CNS show comparable inflammatory responses post-injury, with damaged nerve fibers initiating a cytotoxic environment, leading to further damage and degeneration of surviving nerve cells.Citation8 The retina’s blood-ocular barrier also communicates with the CNS blood-brain barrier,Citation9 underscoring the high degree of structural, functional, and developmental similarity between the retina and the CNS, which renders the retina a convenient window for studying the CNS. Specifically, the inner plexiform layer (IPL), ganglion cell layer (GCL), and retinal nerve fiber layer (RNFL) are the main areas of interest in retina studies of PD. This is because dopaminergic cells—RGC and amacrine cells (ACs)—reside in these layers and are principal cells involved in PD.Citation10
Despite their utility, traditional vascular imaging examinations like CT and MRI can be time-consuming, expensive, and are not without disadvantages, such as the risk of contrast agent allergies and radiation damage. Thus, optical coherence tomography angiography (OCTA) emerges as a swift, convenient, and intuitive alternative for studying the retina and understanding CNS vascular injuries.
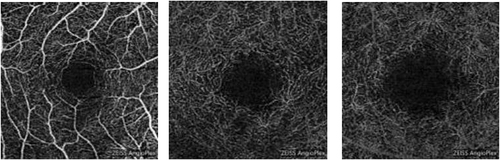
OCTA, a non-invasive retinal imaging technique, is developed from optical coherence tomography (OCT). By exploiting the differences in interference signals between a reference mirror and biological samples, OCTA generates depth-resolved tissue reflectivity. The horizontal and axial scan is termed as the b-scan, while the vertical scan is known as the a-scan. The initial time-domain OCT (TD-OCT) requires movement of the reference mirror to obtain multiple a-scans. It has an imaging speed of 400 scans per second and a histological resolution of 10–15 µm. Spectral-domain OCT (SD-OCT) uses a wavelength between 800 µm and 900 µm, thereby increasing the scan frequency and improving tissue resolution to 3–5 µm, making it the most widely utilized OCT device presently.Citation11 Swept-source OCT (SS-OCT) incorporates a long wavelength and narrow-bandwidth source that is swept across a broad range of optical frequencies, thus facilitating high spatial resolution and enhanced tissue penetration.Citation12 OCTA employs the comparison of moving red blood cells and static tissue signals in the tissue, resulting in non-invasive tissue vascular images (). This allows for the visualization of the retina, choroid, and fundus vessels and quantitative analysis of macular thickness and blood vessel density.
Figure 1 Schematic diagram of vascular stratification of OCTA.
Materials and Methods
Study Participants
We selected a cohort of 56 patients primarily diagnosed with PD from the Department of Neurology at the affiliated Hospital of North Sichuan Medical College between June 2021 and June 2022. Of the initial pool, we collected data from 86 eyes. Exclusions included one eye due to orbital space occupation, twelve eyes due to severe lens opacity, three eyes due to small pupil size, and ten eyes resulting from poor fixation. The patient sample consisted of 29 male and 27 female patients, averaging 56.73 ±1.65 years in age. Disease duration spanned between 1 and 14 years, averaging at 3.0 (1.35) years. UPDRSIII scores reached up to 44.43, with an average score of 18.0 (4.0, 19). Patients received a levodopa daily equivalent dosageCitation13 ranging from 150–1850 mg, with an average dose of 478 ± 26.23 mg. The daily equivalent dosage for dopamine receptor agonists spanned 0–300 mg, averaging at 101.14 ± 7.49 mg. Simultaneously, we included 45 healthy subjects (90 eyes) as controls, who were without ocular diseases, eye surgery history, hypertension, diabetes, and other structural diseases of the retina.
The study incorporated patients meeting the following criteria: (1) primary PD diagnosis aligning with the 2016 Chinese diagnostic criteria for Parkinson’s disease;Citation14 (2) age over 40 years; (3) receiving solely pharmacological treatment, devoid of surgical intervention; (4) capability to cooperate to complete OCTA inspection. We excluded patients exhibiting the following: (1) eye diseases, significant ametropia (±6.00 D or astigmatism), severe lens opacity, glaucoma, and other retinal conditions; (2) diseases potentially impacting the visual system, such as diabetes and unmanageable high/low blood pressure; and (3) neurologic disorders besides PD, including optic neuromyelitis and cerebral infarction.
Research Methods
Experimental Design
Diagnosis of PD patients was validated by two neurologists with intermediate or higher qualifications. We collected demographic information, medical history, and details of drug treatment for all participants. Utilizing the H-Y stages and UPDRS III,Citation15 we graded all PD patients during the “off” period. Subsequently, an OCTA examination was carried out within three hours post PD drug intake (to ascertain patients were in the “on” phase of the disease, thereby preventing tremor interference). During the follow-up period, which ranged between 6 to 12 months, patients were exclusively on medication specifically prescribed for Parkinson’s disease, without any additional medication interventions. Simultaneously, we recruited 45 healthy volunteers devoid of hypertension, diabetes, and eye disease history, constituting the control group. We gathered demographic information and performed a one-time OCTA data collection for these participants.
OCTA Examination Methods
We utilized the Zeiss Wide-angle vascular OCT (CirrusHD-OCT5000; Carl Zeiss, Germany) for examining both eyes of all subjects in the eye-movement tracking mode, a feature that can automatically recognize subjects’ eye movements to enhance tracking, reduce artifacts, and elevate image quality. The device exhibits an axial resolution of 5μm, A-scan depth of 1024 points and scanning speed of 68,000 A-scans/second. It operates at a wavelength of 840 nm, with a scanning range of 3 mm × 3 mm. The optic disc cube was scanned at 200×200 dimensions to assess RNFL thickness. We ensured that each scan centered the optic disc, chose the “Auto repeat” option for subsequent follow-ups, and the instrument would auto-adjust the eyepiece and jaw rest to align with the same patient, eye, and previous settings for acquiring the scan type. Repeated parameters included jaw rest alignment, scan mode, fixation target orientation, image enhanced polarization, centering alignment, focus, brightness, contrast, and lighting settings. This procedure facilitated the synchronous display of the same retinal position at each follow-up. For a 200*200 optic disc, even if the disc was not well-centered, the analysis algorithm could correctly position the “calculation circle” around the optic disc. CIRRUS automatically calibrated the fundus image for two dates to display the same retinal position synchronously in each image. Two professional ophthalmologists further manually calibrated this. We averaged data from each eye collected three times to minimize error.Citation16 The resulting image was segmented into concentric circles with diameters of 1 mm and 3 mm, using the center of the macular concave as the circle’s center. (The 0–1 mm range defined the center, while the 1–3 mm range represented the inner ring). Images with signal intensity < 8 or containing artifacts, which could hamper subsequent analysis, were discarded. We employed the software CirrusHD-OCT5000 AngioPlexV.11.5.X for identifying superficial retinal blood vessels. The software helped in obtaining the superficial vascular density from the macular region and RNFL thickness from the optic disc region, size of the fovea vascularization zone (FAZ), and of the subjects via quantitative analysis.
Statistical Analysis
We used SPSS24.0 statistical software for data processing and analysis. Statistical data were articulated as a constituent ratio (%) or rate (%). We employed Pearson’s Chi-square (χ2) test to evaluate differences in sex, age, and the length of schooling between the two groups. Shapiro–Wilk was utilized for testing the normality of RNFL thickness, vessel density, FAZ area and perimeter, H-Y stage, and UPDRS score. For data conforming to a normal distribution, we executed Pearson correlation analysis using the correlation coefficient r. Non-normally distributed data were expressed as median and quartile distance (M [P25, P75]), and Spearman rank correlation analysis was used. Pearson correlation analysis was used to explore the correlation of vessel density, RNFL thickness, FAZ size, and area with H-Y stage and UPDRS score. We applied partial correlation analysis to eliminate the influence of confounding factors. Statistical significance was set at P ≤ 0.05.
Ethical Approval
The Ethics Committee of the Affiliated Hospital of North Sichuan Medical College (May 2022 2022ER203-1) approved this study. The research was conducted in compliance with the Declaration of Helsinki. All subjects provided written informed consent after receiving a detailed explanation about the nature of the study.
Results
Demographic and Clinical Data of the PD and Control Groups
Our statistical analysis revealed no significant differences in sex, age, or years of education between the PD and control groups (P > 0.05) ().
Table 1 Demographic and Clinical Data of PD Group and Control Group
Comparison of Mean Baseline RNFL Thickness and Vessel Density Between the PD Group and the Control Group
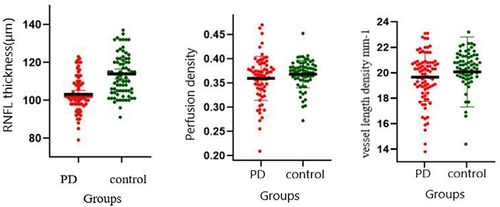
The PD group exhibited a significantly reduced RNFL thickness (106.13 ± 12.36 μm) compared to the control group (115.95 ± 11.37 μm) (P < 0.05). () Furthermore, the outer annulus vessel length density in the PD group (20.7 [19.62, 22.17] mm−1) was notably lower than that in the control group (21.79 ± 1.16 mm−1) (P < 0.05). () However, no significant differences were found in the length density and perfusion density of the inner and outer annulus between the two groups (P > 0.05) ( and ).
Table 2 RNFL Thickness and Vascular Density Parameters in the Two Group
Figure 2 Comparison of RNFL thickness between the two groups. (A–C) Control group; (D–F): PD group; (A and D) RNFL thickness chart, blue and green indicate thinner areas, yellow and red indicate thicker areas; (B and E) RNFL thickness profile, the area marked by red lines is RNFL; (C and F) RNFL thickness line diagram.
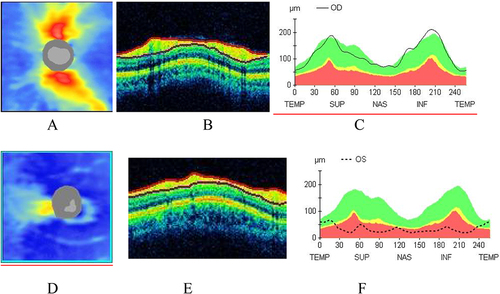
Figure 3 Comparison of vascular density between PD group and control group. (A and C) vessel length density; (B and D) vascular perfusion density; (A and B) control group; (C and D) PD group.
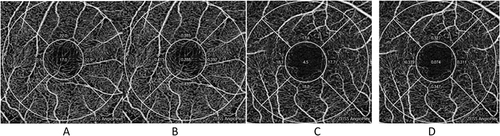
Figure 4 Comparison of RNFL thickness and vascular density between PD group and control group.
Correlation Analysis of Baseline RNFL Thickness, Vessel Density, and Disease Severity
The RNFL thickness exhibited a negative correlation with the UPDRSIII score (P < 0.05), but no correlation was observed with the duration of the disease (P > 0.05). Moreover, the vascular length density and vascular perfusion density of the inner and outer rings did not demonstrate a correlation with disease severity (P > 0.05) ().
Table 3 Correlation Analysis Between RNFL Thickness Vascular Density and Disease Severity in PD Group
Follow-Up Data of Mean RNFL Thickness and Vascular Density in Patients with PD (n=15)
Out of our initial patient cohort, 15 patients with Parkinson’s Disease successfully completed the follow-up due to outbreak control measures in place during our study period.In this study, the thickness of the RNFL in patients with PD did not demonstrate a deterioration correlated with the increase in disease duration. The correlation with disease severity was not explored in the present study. Additionally, no relation was observed between disease duration and either RNFL thickness or vessel density (P > 0.05) ().
Table 4 Follow-Up RNFL Thickness and Vascular Density in Patients with Parkinson’s Disease
Discussion
PD is a typical senile neurodegenerative disease, and the number of patients with PD is constantly increasing. The prevalence rate of PD among people over 60 years old is 1.37%,Citation17 and the increase rate of the age-standardized prevalence rate of PD in China is more than five times that of the global level. At present, there are about 3.62 million patients with PD in China. Patients with PD in China are expected to account for half of the global population by 2050,Citation18 and this number is expected to remain at a high level for a long time, bringing heavy burdens to society and families. The main challenges with PD are making an early diagnosis and predicting the progression of the disease. In recent years, relevant studies have tried to identify clinical markers for early diagnosis through the non-motor symptoms of PD, neuroimaging, or laboratory examination of body fluids, among which the structural changes in the retina have become a research focus in recent years. In rotenone-induced PD animal models, pathological changes such as swelling and loss of RGC appeared in the retina at about 20 days, while typical pathological changes in the substantia nigra and striatum did not appear until about 60 days,Citation19 suggesting that pathological changes in the retina were more important than those in the brain for the early diagnosis of PD, before the appearance of typical PD motor symptoms, the retinal structure has been damaged.
At present, the study of retinopathy in Parkinson’s disease mainly focuses on the retinal nerve fiber layer formed by amacrine cells (AC) and retinal ganglion cells (RGC) axons and dendrites. Since the central nervous system changes in Parkinson’s disease mainly occur in the substantia nigra dopamine neurons, AC and RGC in the retina also belong to dopaminergic cells. Therefore, they are the main affected cells in Parkinson’s disease. Pathological changes induced by α-syn first appear in the axons and dendrites of cells and then progress to the cellular body. Autopsy has confirmed the presence of RGC degeneration, loss, and tree/axon reduction in patients with PD.Citation20 The deposition of α-syn inclusion bodies in the RGC causes the axons and dendrites to form abnormal beaded structures, resulting in the apoptosis or dysfunction of the RGC and, eventually, RNFL thinning.Citation21 Meanwhile, the decrease in RGC is also one of the important reasons for the decrease in electroretinogram B-wave and oscillating potential, visual evoked potential, contrast sensitivity, and color discrimination in patients with PD.Citation22 Even before the RNFL thinned, the electrophysiological examination of the retina showed abnormal results. The structural abnormalities of the retina in PD patients not only lead to visual impairment, but also regulate the nerve excitability of the central nervous system through the axis of retinal ganglion cells-retinal hypothalamic tract-hypothalamic supraoptic nucleus (central biological clock), transmit information in the light and dark environment, and form biological rhythms through circadian rhythm changes. The disturbance of biological rhythm is closely related to various non-motor symptoms of PD, such as blood pressure disturbance and sleep disorder.Citation23 It has been reported that the animal model of form-deprivation myopia (fDM) was established using dopamine D2 receptor knockout mice and normal mice.Citation24 OCT fundus imaging and electroretinogram measurements after injection of dopamine receptor antagonists showed that exogenous dopamine inhibited the development of ametropia and overexpression of alpha-syn in mouse retinas via adenovirus vectors. Cell counting, ERG detection, and water maze task before and after systemic injection with L-dopa showed that α-syn overexpression caused the loss of dopaminergic cells and a decrease in electroretinogram B-wave amplitude and visual acuity in mice under light adaptation.Citation25 Rapid eye movement sleep behavior disorder (RBD) is considered to be the most specific risk factor for the development of PD and the strongest marker for the diagnosis of prodromal stage of PD. Studies on the retinal thickness of RBD patients have found that the retinal thickness of RBD patients is also thinner, and the thickness of RBD patients is between normal controls and Parkinson’s disease patients.Citation26 The deposition of α-syn in PD leads to the simultaneous damage of small RGCs (a subgroup of RGCs), and non-elongated cells. The absence of elongated cells can regulate the function of RGCs, which is one of the causes of visual abnormalities in PD.Citation27 Extensive retinal thinning, including RNFL thinning, has been reported in large-sample meta-analyses of patients with PD.Citation28 Moreover, retinal thinning of PD has nothing to do with drug therapy.Citation29 However, the correlation between RNFL thickness and disease severity has been inconclusive. In this study, RNFL thickness was negatively correlated with UPDRS scores, and the thinner the RNFL was, the more severe exercise symptoms were, which was the same as the findings of previous studies.Citation30 The thinning of RNFL may partly reflect the loss of dopaminergic cells in the CNS; however, there is no similar correlation between RNFL thickness and the H-Y stage, which may be because the patients with PD included in this study mostly had early-stage disease. Previous studies have reported that eye movements are affected in PD. With the progression of the disease, abnormal eye saccades occur in patients with PD.Citation31 The tremor of limbs and eyeballs affects the OCTA examination process to a certain extent and worsens the imaging quality. There are more shadows, and OCTA examination is limited, so if it is extremely difficult to perform OCTA examination in the “off” stage of the disease or in patients with advanced PD, it may be difficult to obtain satisfactory high-quality images even with multiple imaging. For analyzing the correlation between the severity of dyskinesia and RNFL thickness and vascular parameters, the UPDRSIII score may be more suitable than the H-Y grade.
In this study, some patients with PD were followed up for 12 months, and their average RNFL thickness and vascular density did not continue to decrease with the course of the disease. Different results were found in the study by Atum et al.Citation32 They measured retinal thickness in 23 patients with early idiopathic PD, followed them up for two years, and found that the RNFL thickness was not correlated with the UPDRSIII score and the H-Y grade. When juxtaposed with the findings by Abd et alCitation33 our study reveals a distinct pattern of RNFL thinning in patients with Parkinson’s disease. This comparison further underlines the heterogeneity of retinal structural changes in this patient population. It has been reported that the higher the H-Y grade and the longer the duration of PD, the lower the RNFL thickness and macular thickness. Hasanov et alCitation34 followed 19 patients with PD for 12 months and did not find the average RNFL thickness to decrease with the course of the disease. Jiménez et alCitation35 used OCT to measure the RNFL thickness around the optic papilla of patients with PD and proposed a regression equation to calculate the UPDRSIII score based on the RNFL thickness and predict the deterioration of the motor function in these patients. However, this equation has not been verified in a large sample population in the real world. Ma et alCitation36 conducted a comparative study of 37 patients with PD and 42 normal subjects and found that the RNFL of patients with PD gradually thinned, and the annual thinning rate was much higher than that of normal subjects. The reason for the difference in the above results is that the sample size was too small and that the disease stages of the patients with PD are different in different studies. Moreover, the loss of RGCs is a part of normal retinal aging, so conducting a longitudinal follow-up study of normal people and patients with PD is necessary. Satue et alCitation37 measured the RNFL thickness in 153 patients with PD using OCT and found that the RNFL thickness was significantly negatively correlated with H-W grade. At the same time, the team followed up on 30 patients with PD for five years and found that the RNFL thickness was progressively reduced in these patients; their study is also the longest follow-up study.Citation38 At present, few longitudinal studies on the follow-up of the RNFL thickness in patients with PD have been conducted, and their conclusions are not the same. It is worth affirming that monitoring the dynamic changes of the RNFL thickness and analyzing the severity of PD and the changes with the course of the disease are of great significance for us to further understand the abnormal retinal structure in PD. To the best of our knowledge, this is the first follow-up study of superficial retinal vascular density in patients with PD; however, we did not find a progressive decrease in vascular density with the course of the disease.
Vascular factors are the initial link of PD onset and one of the important factors in disease progression.Citation39 Due to the homology of embryonic development and the similarity of retinal and nervous system structures, retinal vascular injury can reflect intracranial microvascular injury to some extent.Citation40 Few studies on retinal vascular changes in PD, with different evaluation indexes, have been conducted. The retinal capillary perfusion density is reduced,Citation41 vascular space increased,Citation42 blood flow index decreased,Citation43 and the total annular area of the superficial capillary plexus (the total area of the measured macular area minus the area of the fovea without blood vessels) decreasedCitation44 in patients with PD; Increasingly, studies have used vascular length density and vascular perfusion density to evaluate retinal vascular injury. Vascular length density is the ratio of the total vascular length in mm to the measurement area in mm2 within the measurement range. Depicting the linear length of the blood vessels in the measurement area can reflect the vascular perfusion in the area with high accuracy and repeatability. Perfusion density is the ratio of the area (mm2) occupied by blood vessels within the measurement range to the total area (mm2) of the measurement range. Depicting the diameter and width of blood vessels in the area to reflect the coverage of blood vessels in the area can better reflect intravascular perfusion. Compared with blood flow index, microvascular density and fractal dimension, vessel length density and vessel density have higher repeatability and reproducibility and can more accurately reflect the blood perfusion in the macular area.Citation45 The area and size of FAZ reflect the size of the non-perfusion area in the macular region. Vascular quantitative analysis can detect subtle changes in early retinal vascular circulation. A total of 2790 eyes were included in 26 clinical studies, among which 1343 eyes in the PD group and 1447 eyes in the control group were included in a meta-analysis, which showed that PD had reduced retinal superficial vascular density.Citation46 In 2015, Miri used fluorescein fundus angiography to examine the retinal vascular changes in PD patients, and found that the FAZ of the retina in PD patients was significantly smaller than that in healthy controls,Citation47 but the study was conducted by manually depicting the area of capillaries and the fovea vascular-free area and manually counting the number of capillary branches in the fovea direction within the range of 3 mm, resulting in a large error. Further, since an invasive examination method was used, its clinical application was limited. In this study, OCTA was used to evaluate the structural changes of the retina in patients with PD. OCTA was developed based on OCT, and multiple scans were performed in the same plane. The changes of red blood cell signal in blood vessels were used to reconstruct the structure of blood vessels, and three-dimensional imaging of retinal blood vessels can be performed non-invasive without a contrast agent, avoiding the leakage of the contrast agent. Further, the combination of angiography and tomography of retinal structure can identify deeper retinal blood vessels, which fundus fluorescein angiography cannot achieve. This study showed that patients with PD had retinal vascular damage, and the length density of blood vessels was significantly reduced compared with that obtained using normal illumination. This is similar to the conclusions of the previous studies. Meanwhile, we also found that although the length density of blood vessels in PD was significantly reduced compared to that in the control group, the decrease in perfusion density was not obvious, suggesting that the length of blood vessels in PD was more susceptible to the disease than the diameter. α-SYN deposition was found not only in the retina but also along the vascular wall in the PD animal modelCitation48 and bound to vascular growth factors, resulting in reduced angiogenesis. Due to reduced blood vessel growth, there may be compensatory thickening of the vessels to increase blood flow to improve the local blood supply. Experiments on a mouse model of PD showed that the number of blood vessels in the retina did not decline linearly with the progression of the disease. Dopamine drug treatment resulted in a transient increase in blood vessel density in young mice but ultimately could not reverse blood vessel reduction.Citation49 There are research reports that exosomes derived from the mesenchymal stem cells can promote disease in PD mouse models by stimulating angiogenesis.Citation50 May offer a new way to cure Parkinson’s disease In this study, no correlation was found between retinal vascular parameters and disease severity, which may indicate that the loss of dopamine cells and vascular injury are not synchronized or that drug therapy alleviated retinal vascular injuries to some extent due to the short course of the disease.
The above results of our study showed that retinal structural damage existed in PD, including thinning of the RNFL and reduction of the superficial blood vessels, and the RNFL thickness was negatively correlated with disease severity. This study did not find a correlation between vascular density parameters and disease severity. Since most patients were treated with drugs, a subgroup analysis was not performed. The influence of drug therapy on the study results cannot be ruled out. In future studies, more newly diagnosed and untreated patients will be included for further verification, and the damage to visual pathways will be further studied in combination with brain functional imaging. Moreover, fewer patients completed follow-up in this study, and the 1-year follow-up time was shorter than the overall disease course of PD, so the follow-up sample size and follow-up time need to be expanded. OCTA can be used to quantitatively analyze retinal layer thickness and retinal blood vessels in a rapid and non-invasive manner and has made great progress compared to previous artificial measurements. The RNFL thickness and retinal blood vessel density are highly potential indicators for predicting the progression of PD and evaluating the severity of the disease. This study has the following limitations: first, the included patients have been treated with drugs, and although there is no effect on the thickness of RNFL, the effect of drugs on the retinal vascular layer cannot be completely excluded. In the following study, we will continue to follow up and try our best to include newly diagnosed and untreated patients with PD for a comparative study. Second, this study did not include the visual conduction pathway examination in patients. Although retinal vascular injury was found in patients with PD, whether it affected visual conduction remains to be determined. In subsequent studies, we will conduct visual stimulation of patients with PD under magnetic resonance functional imaging to further explore the damage mechanism of the visual system in PD.
Conclusion
Patients with PD exhibited retinal structural damage such as RNFL thinning and superficial vascular injury. RNFL thickness in the macular area of patients with PD was negatively correlated with the UPDRSIII score but not related to the disease duration. RNFL thickness may have a certain reference value for evaluating the severity of PD dyskinesia and monitoring the progression of PD. The thickness of RNFL and the superficial vascular density did not progressively decrease with the course of the disease.
Data Sharing Statement
The original contributions presented in the study are included in the article, further inquiries can be directed to the corresponding author/s.
Author Contributions
All authors made a significant contribution to the work reported, whether that is in the conception, study design, execution, acquisition of data, analysis and interpretation, or in all these areas; took part in drafting, revising or critically reviewing the article; gave final approval of the version to be published; have agreed on the journal to which the article has been submitted; and agree to be accountable for all aspects of the work.
Disclosure
The authors declare that the research was conducted in the absence of any commercial or financial relationships that could be construed as a potential conflict of interest.
Acknowledgments
We are very grateful to the Affiliated Hospital of North Sichuan Medical College and People’s Hospital of Deyang City for their support, and all patients/participants for their active cooperation.
Additional information
Funding
References
- Peng H, Chen S, Wu S, et al. Alpha-synuclein in skin as a high-quality biomarker for Parkinson’s disease. J Neurol Sci. 2023;451:120730. doi:10.1016/j.jns.2023.120730
- Nicoletti A, Luca A, Baschi R, et al. Vascular risk factors, white matter lesions and cognitive impairment in Parkinson’s disease: the PACOS longitudinal study. J Neurol. 2021;268(2):549–558. doi:10.1007/s00415-020-10189-8
- Kummer BR, Diaz I, Wu X, et al. Associations between cerebrovascular risk factors and Parkinson disease. Ann Neurol. 2019;86(4):572–581. doi:10.1002/ana.25564
- Liu Y, Xue L, Zhang Y, Xie A. Association between stroke and Parkinson’s disease: a meta-analysis. J Mol Neurosci. 2020;70(8):1169–1176. doi:10.1007/s12031-020-01524-9
- Hughes S, Yang H, Chan-Ling T. Vascularization of the human fetal retina: roles of vasculogenesis and angiogenesis. Invest Ophth Vis Sci. 2000;41:1217–1228.
- London A, Benhar I, Schwartz M. The retina as a window to the brain-from eye research to CNS disorders. Nat Rev Neurol. 2013;9(1):44–53. doi:10.1038/nrneurol.2012.227
- Lyu J, Mu X. Genetic control of retinal ganglion cell genesis. Cell Mol Life Sci. 2021;78:4417–4433. RGC的发生. doi:10.1007/s00018-021-03814-w
- Benhar I, Ding J, Yan W, et al. Temporal single-cell atlas of non-neuronal retinal cells reveals dynamic, coordinated multicellular responses to central nervous system injury. Nat Immunol. 2023;24:700–713. doi:10.1038/s41590-023-01437-w
- Chalkias I, Tegos T, Topouzis F, Tsolaki M. Ocular biomarkers and their role in the early diagnosis of neurocognitive disorders. Eur J Ophthalmol. 2021;31:2808–2817. doi:10.1177/11206721211016311
- Garzone D, Finger RP, Mauschitz MM, et al. Visual impairment and retinal and brain neurodegeneration: a population-based study. Hum Brain Mapp. 2023;44:2701–2711. doi:10.1002/hbm.26237
- Cole ED, Moult EM, Dang S, et al. The definition, rationale, and effects of thresholding in OCT angiography. Ophthalmol Retina. 2017;1:435–447. doi:10.1016/j.oret.2017.01.019
- Lains I, Wang JC, Cui Y, et al. Retinal applications of swept source optical coherence tomography (OCT) and optical coherence tomography angiography (OCTA). Prog Retin Eye Res. 2021;84:100951. doi:10.1016/j.preteyeres.2021.100951
- Tomlinson CL, Stowe R, Patel S, Rick C, Gray R, Clarke CE. Systematic review of levodopa dose equivalency reporting in Parkinson’s disease. Mov Disord. 2010;25(15):2649–2653. doi:10.1002/mds.23429
- Liu J. Diagnostic criteria for Parkinson’s disease in China (2016). Chin J Neurol. 2016;49(4):268–271.
- Goetz CG, Tilley BC, Shaftman SR, et al. Movement disorder society-sponsored revision of the unified parkinson’s disease rating scale (MDS-UPDRS): scale presentation and clinimetric testing results. Mov Disord. 2008;23(15):2129–2170. doi:10.1002/mds.22340
- Tewarie P, Balk L, Costello F, et al. The OSCAR-IB consensus criteria for retinal OCT quality assessment. PLoS One. 2012;7(4):e34823. doi:10.1371/journal.pone.0034823
- Feigin VL, Nichols E, Alam T, Bannick MS, Beghi E, Blake N. Global, regional, and national burden of neurological disorders, 1990–2016: a systematic analysis for the global burden of disease study 2016. Lancet Neurol. 2019;18(5):459–480. doi:10.1016/S1474-4422(18)30499-X
- Qi S, Yin P, Wang L, et al. Prevalence of Parkinson’s disease: a community‐based study in China. Mov Disord. 2021;36(12):2940–2944. doi:10.1002/mds.28762
- Normando EM, Davis BM, De Groef L, et al. The retina as an early biomarker of neurodegeneration in a rotenone-induced model of Parkinson’s disease: evidence for a neuroprotective effect of rosiglitazone in the eye and brain. Acta Neuropathol Commun. 2016;4(1):86. doi:10.1186/s40478-016-0346-z
- Veys L, Vandenabeele M, Ortuño-Lizarán I, et al. Retinal α-synuclein deposits in Parkinson’s disease patients and animal models. Acta Neuropathol. 2019;137(3):379–395. doi:10.1007/s00401-018-01956-z
- Bodis-Wollner I, Kozlowski PB, Glazman S, Miri S. α-synuclein in the inner retina in Parkinson disease. Ann Neurol. 2014;75(6):964–966. doi:10.1002/ana.24182
- Guo L, Normando EM, Shah PA, De Groef L, Cordeiro MF. Oculo-visual abnormalities in Parkinson’s disease: possible value as biomarkers. Mov Disord. 2018;33(9):1390–1406. doi:10.1002/mds.27454
- Xiao RQ, Ying W, Zhenguo L. Circadian rhythm disorder of blood pressure in Parkinson′s disease. Chin J Neurol. 2021;54(12):1307–1311.
- Huang F, Shu Z, Huang Q, et al. Retinal dopamine D2 receptors participate in the development of myopia in mice. Invest Opthalmol Vis Sci. 2022;63(1):24. doi:10.1167/iovs.63.1.24
- Marrocco E, Indrieri A, Esposito F, et al. α-synuclein overexpression in the retina leads to vision impairment and degeneration of dopaminergic amacrine cells. Sci Rep. 2020;10(1):9616. doi:10.1038/s41598-020-66497-6
- Rascunà C, Cicero CE, Chisari CG, et al. Retinal thickness and microvascular pathway in idiopathic rapid eye movement sleep behaviour disorder and Parkinson’s disease. Parkinsonism Relat Disord. 2021;88:40–45. doi:10.1016/j.parkreldis.2021.05.031
- La Morgia C, Di Vito L, Carelli V, Carbonelli M. Patterns of retinal ganglion cell damage in neurodegenerative disorders: parvocellular vs magnocellular degeneration in optical coherence tomography studies. Front Neurol. 2017;8:710. doi:10.3389/fneur.2017.00710
- Huang L, Zhang D, Ji J, Wang Y, Zhang R. Central retina changes in Parkinson’s disease: a systematic review and meta-analysis. J Neurol. 2021;268(12):4646–4654. doi:10.1007/s00415-020-10304-9
- Sen A, Tugcu B, Coskun C, Ekinci C, Nacaroglu SA. Effects of levodopa on retina in Parkinson disease. Eur J Ophthalmol. 2014;24(1):114–119. doi:10.5301/ejo.5000338
- Yin Z, Weixia D. Changes of retina I nerve fiber layer thick ness and its correlation with visuaI field mean defects in early Parkinson’s disease. Chin J Ocul Fundus Di. 2010;4:339–342.
- Kassavetis P, Kaski D, Anderson T, Hallett M. Eye Movement disorders in movement disorders. Mov Disord Clin Pract. 2022;9(3):284–295. doi:10.1002/mdc3.13413
- Atum M, Demiryürek BE. Retinal morphological changes during the two years of follow-up in Parkinson’s disease. Ideggyogy Sz. 2021;74(1–2):57. doi:10.18071/isz.74.0057
- Abd Hamid MR, Wan Hitam W, Abd Halim S. Retinal nerve fiber layer and macular thickness in Parkinson’s disease patients. Cureus. 2021;13(7):e16224. doi:10.7759/cureus.16224
- Hasanov S, Demirkilinc Biler E, Acarer A, Akkın C, Colakoglu Z, Uretmen O. Functional and morphological assessment of ocular structures and follow-up of patients with early-stage Parkinson’s disease. Int Ophthalmol. 2019;39(6):1255–1262. doi:10.1007/s10792-018-0934-y
- Jiménez B, Ascaso FJ, Cristóbal JA, López Del Val J. Development of a prediction formula of Parkinson disease severity by optical coherence tomography. Mov Disord. 2014;29(1):68–74. doi:10.1002/mds.25747
- Ma L, Xu L, Mao C, et al. Progressive changes in the retinal structure of patients with Parkinson’s disease. J Parkinsons Dis. 2018;8(1):85–92. doi:10.3233/JPD-171184
- Satue M, Seral M, Otin S, et al. Retinal thinning and correlation with functional disability in patients with Parkinson’s disease. Br J Ophthalmol. 2014;98(3):350–355. doi:10.1136/bjophthalmol-2013-304152
- Satue M, Rodrigo MJ, Obis J, et al. Evaluation of progressive visual dysfunction and retinal degeneration in patients with Parkinson’s disease. Invest Ophthalmol Vis Sci. 2017;58(2):1151–1157. doi:10.1167/iovs.16-20460
- Pierzchlińska A, Kwaśniak-Butowska M, Sławek J, Droździk M, Białecka M. Arterial blood pressure variability and other vascular factors contribution to the cognitive decline in Parkinson’s disease. Molecules. 2021;26(6):1523. doi:10.3390/molecules26061523
- Zhang X, Xiao H, Liu C, et al. Optical coherence tomography angiography reveals distinct retinal structural and microvascular abnormalities in cerebrovascular disease. Front Neurosci. 2020;14:588515. doi:10.3389/fnins.2020.588515
- Robbins CB, Thompson AC, Bhullar PK, et al. Characterization of retinal microvascular and choroidal structural changes in Parkinson disease. JAMA Ophthalmol. 2021;139(2):182. doi:10.1001/jamaophthalmol.2020.5730
- Shi C, Chen Y, Kwapong WR, et al. Characterization by fractal dimension analysis of the retinal capillary network in Parkinson disease. Retina. 2020;40(8):1483–1491. doi:10.1097/IAE.0000000000002641
- Zhang Y, Zhang D, Gao Y, et al. Retinal flow density changes in early-stage Parkinson’s disease investigated by swept-source optical coherence tomography angiography. Curr Eye Res. 2021;46(12):1886–1891. doi:10.1080/02713683.2021.1933054
- Kwapong WR, Ye H, Peng C, et al. Retinal microvascular impairment in the early stages of Parkinson’s Disease. Invest Ophthalmol Vis Sci. 2018;59(10):4115–4122. doi:10.1167/iovs.17-23230
- Zou J, Liu K, Li F, Xu Y, Shen L, Xu H. Combination of optical coherence tomography (OCT) and OCT angiography increases diagnostic efficacy of Parkinson’s disease. Quant Imaging Med Surg. 2020;10(10):1930–1939. doi:10.21037/qims-20-460
- Deng Y, Jie C, Wang J, Liu Z, Li Y, Hou X. Evaluation of retina and microvascular changes in the patient with Parkinson’s disease: a systematic review and meta-analysis. Front Med. 2022;9:957700. doi:10.3389/fmed.2022.957700
- Miri S, Shrier EM, Glazman S, et al. The avascular zone and neuronal remodeling of the fovea in Parkinson disease. Ann Clin Transl Neurol. 2015;2(2):196–201. doi:10.1002/acn3.146
- Elabi O, Gaceb A, Carlsson R, et al. Human α-synuclein overexpression in a mouse model of Parkinson’s disease leads to vascular pathology, blood brain barrier leakage and pericyte activation. Sci Rep. 2021;11(1):1120.
- Ouellette J, Lacoste B. From neurodevelopmental to neurodegenerative disorders: the vascular continuum. Front Aging Neurosci. 2021;13:749026.
- Xue C, Li X, Ba L, et al. MSC-derived exosomes can enhance the angiogenesis of human brain MECs and show therapeutic potential in a mouse model of Parkinson’s disease. Aging Dis. 2021;12(5):1211. doi:10.14336/AD.2020.1221