Abstract
Background and objective
Many surveys of neural integrity of the cerebral white matter with psychiatric diseases on diffusion tensor imaging have recently been performed, but these mainly utilize fractional anisotropy (FA) and the apparent diffusion coefficient (ADC) values, and the results were inconsistent and not fully applied clinically. In this study, we investigated the possibility of differentiating between Alzheimer’s disease (AD) and elderly major depressive disorder (MDD) patients in whom early-stage symptoms are difficult to diagnose, by visually evaluating cerebral nerve fascicles utilizing diffusion tensor tractography. We also measured and evaluated FA and ADC values at the same time.
Subjects and methods
The subjects included 13 AD patients (age: 69.5 ± 5.1 years), 19 MDD patients (65.8 ± 5.7 years), and 22 healthy control (HC) subjects (67.4 ± 4.8 years). Images were acquired using a 1.5T magnetic resonance imaging device and analyzed by diffusion tensor tractography analysis software.
Results
Depiction of the anterior thalamic radiation (ATR) tended to be poor in AD patients unlike in MDD patients and HC subjects. The FA values in the left superior longitudinal fasciculus and fornix (FX) in AD patients were significantly different from those in MDD patients and HC subjects. The ADC values in the bilateral ATR and left superior and inferior longitudinal fasciculi, left inferior fronto-occipital fasciculus, and FX in AD patients were significantly different from those in MDD patients and HC subjects.
Conclusion
Visual evaluation of the ATR in combination with the FA values of the left superior longitudinal fasciculus and FX and ADC values of the bilateral ATR, left superior and inferior longitudinal fasciculi, left inferior fronto-occipital fasciculus, and FX is useful for differentiating between AD and MDD patients, which further suggests that it may become a useful auxiliary diagnostic tool.
Introduction
In elderly major depressive disorder (MDD) patients, dementia-like symptoms may develop as pseudodementia, which may progress to Alzheimer’s disease (AD). Since a depressive state may also be observed in the early stages of AD, accurate diagnosis is difficult. Sometimes AD and MDD can also occur together, which makes their differentiation even more difficult. Because each disorder requires different treatments, establishing an objective method for differentiating between AD and MDD is important. The objective of this study is to investigate the possibility of differentiating AD patients from elderly MDD patients and healthy control (HC) subjects by identifying characteristics of visual observations in combination with the fractional anisotropy (FA) and apparent diffusion coefficient (ADC) values in abnormal white matter integrity on diffusion tensor tractography (DTT).
Alzheimer’s disease is a common dementia that most frequently develops in elderly persons. Many surveys of neural integrity of the cerebral white matter with psychiatric diseases on diffusion tensor imaging (DTI) have recently been performed,Citation1–Citation23 but these mainly utilize FA and ADC values, and the results were inconsistent and not fully applied clinically. (ADC values were sometimes referred to as mean diffusivity (MD) values in previous researches.) Additional imaging studies have reported reduced volumes of gray matter, such as in the parahippocampal gyrus and entorhinal cortex in the medial region of the temporal lobe on structural magnetic resonance imaging (MRI)Citation24–Citation26 and reduced glucose metabolismCitation27–Citation30 and circulationCitation31,Citation32 in the posterior cingulate gyrus and precuneus on positron emission tomography and single photon emission computed tomography. Since AD has recently been regarded as cortical connection insufficiency syndrome, influencing not only cortical nerve cell bodies but also axons and dendrites, many studies on white matter integrity utilizing the FA and ADC values on DTI and DTT have been performed, and abnormalities and reduced FA values in the total white matter excluding the occipital lobe,Citation16,Citation17 callosal splenium,Citation15,Citation20 cingulate fasciculus (CF),Citation18,Citation19,Citation21,Citation22 uncinate fasciculus (UF),Citation18,Citation19,Citation33 superior longitudinal fasciculus (SLF),Citation20,Citation33 inferior longitudinal fasciculus (ILF),Citation22 and fornix (FX)Citation22,Citation23 have been reported. Even though they have shown a tendency to some extent, no consensus has been reached.
Nerve-fiber visualization utilizing DTT has not previously been utilized for the evaluation of neural fiber integrity because of inferior objectivity due to variation in the results depending on MRI devices and analysis software. In this study, however, we have been able to retain the objectivity of nerve fiber depiction by utilizing an identical device and analysis software. If there is a difference in white matter integrity between AD and MDD, differentiation becomes possible, which further suggests that this method becomes a simple and useful auxiliary diagnostic tool.
In this study, we prepared DTT of cerebral white matter nerve fascicles, and investigated its usefulness for differentiation between AD and MDD by evaluating the nerve fiber depiction, in addition to the FA and ADC values. The anterior thalamic radiation (ATR),Citation34,Citation35 CF,Citation18,Citation19,Citation21,Citation22 UF,Citation9,Citation18,Citation19 SLF,Citation9,Citation10 ILF,Citation22 inferior fronto-occipital fasciculus (IFOF),Citation35 and FX,Citation22,Citation23 used as the subjects in preceding studies, were selected for the nerve fascicles to be traced.
Depiction of the bilateral ATR by DTT tended to be unfavorable in AD patients compared to those in MDD patients and HC subjects. In addition, the FA value was reduced in the left SLF and FX compared to those in MDD patients and HC subjects, and the ADC value was increased in many nerve fascicles.
The above findings suggest that visual evaluation of the ATR utilizing DTT is useful to differentiate between depression symptoms in AD patients and pseudodementia in elderly MDD patients, in addition to the FA values in the left SLF and FX, and the ADC values in the bilateral ATR, left SLF, left ILF, left IFOF, and FX.
Subjects and methods
Subjects
This study was performed after approval by the Ethics Committee of Nanbu Hospital, Okinawa, Japan. Informed consent was obtained from all subjects. The subjects included 13 age-matched AD patients (six males and seven females aged 59–77 years [mean: 69.5 ± 5.1 years]), 19 MDD patients (3 males and 16 females aged 58–74 years [mean: 65.8 ± 5.7 years]), and 22 HC subjects (8 males and 14 females aged 59–77 years [mean: 67.4 ± 4.8 years]). The AD and MDD patients were diagnosed based on an interview and patient observation following the Diagnostic and Statistical Manual of Mental Disorders, Fourth EditionCitation36 by a psychiatrist at Nanto Clinic or neurologists at Nanbu Hospital. In AD patients, the Mini Mental State Examination (MMSE) score was 0–8 in zero, 9–16 in three, 17–24 in eight, and 25–30 in two patients, respectively, and the mean was 19.6 ± 4.2. The HC subjects were patients with no mental disorder or physical disease, such as hypertension and diabetes, who visited the clinic or hospital for close examination of headache, and no apparent organic disease was observed on MRI. All subjects were right-handed ().
Table 1 Clinical characteristics of all samples (n = 54)
MRI
We performed MRI of the brain with a 1.5T MRI (Achieva Nova; Koninklijke Philips Electronics NV, Amsterdam, The Netherlands) using an eight channel SENSE-head coil.
Diffusion-weighted data were collected with a spin echo single shot echo planner imaging sequence (repetition time/echo time/flip angle: 6231 msec/75 msec/90°) with the sensitivity encoding, or SENSE, parallel imaging scheme (reduction factor, 2.0). Diffusion gradients were applied in 15 spatial directions. The b values used were 0 seconds/mm2 and 800 seconds/mm2. Images were acquired with a 116 × 116 matrix, 230 × 230 mm field of view filled to 256 × 256 pixels. The reconstruction voxel size was 1.75 × 1.75 × 1.75 mm. Fifty transverse sections of 3 mm slice thickness were acquired. Two measurements were obtained and averaged. The total acquisition time was 3 minutes and 26 seconds.
The structural data for anatomic guidance were provided by a three-dimensional T1-weighted fast field echo sequence (repetition time/echo time/flip angle: 9.3 msec/4.3 msec/10°). Images were acquired with a 256 × 256 matrix, 240 × 240 mm field of view. The reconstruction voxel size was 0.94 × 0.94 × 0.94 mm. A total of 160 sagittal sections of 2 mm slice thickness with 1 mm superimposed slices were acquired. Two measurements were obtained and averaged. The total acquisition time was 3 minutes 35 seconds.
DTT (diffusion tensor tractography)
DTI (diffusion tensor imaging) is a method of noninvasively measuring and imaging the diffusion of water molecules using MRI. In the cerebral white matter, diffusion is more enhanced in the direction parallel to the longitudinal axis of the fiber tract and less perpendicular. Microstructural abnormalities of the cerebral white matter and neural fiber integrity can be evaluated by qualitatively and quantitatively investigating the direction of nerve fiber distribution.Citation37,Citation38 The FA and ADC values are used as parameters quantitatively representing diffusion anisotropy.Citation39–Citation41 The FA value represents the normalized standard deviation of diffusion tensors in three directions crossing each other at right angles (three diffusivity), and the values range from 0 to 1. The value is close to 1 when diffusion anisotropy is strong. The ADC value represents the mean of the diffusion ranges of diffusion tensors in the three directions, and the overall diffusion range indifferent from the directions can be evaluated. In addition, DTT enabled visual observation of the nerve distribution.Citation42 The DTT method can be used to assume macroscopic nerve fascicle distribution by investigating whether or not the diffusion anisotropy vectors of adjacent voxels are continuous based on information obtained by DTI.
The collected DTI data were sent to a workstation of Philips Extended MR WorkSpace (release 2.6.3.2), and analyzed using FiberTrak software (release 2.6.3.2; Koninklijke Philips Electronics NV, Amsterdam, The Netherlands). As default values, the step width of fiber tracking was set at 10 mm, and the conditions for the discontinuation of fiber tracking were an FA value of <0.15 and flip angle of >27°. By the use of the multiple region of interest (ROI) approach, INCLUDE-ROIs, with which including regions are specified, were manually set referring to the tractography atlas, and EXCLUDE-ROIs, with which excluding regions are specified, were set in regions containing other mixed nerve fibers to exclude these fibers.Citation43,Citation44 For example, the corticospinal and corticopontine tracts are mixed in the ATR, but pure ATR can be visualized by setting EXCLUDE-ROIs including the midbrain tracts (). To exclude anatomically consistent nerve fibers appearing as if they were continuous to the opposite cerebral hemisphere due to fiber crossing, such as in the corpus callosum, EXCLUDE-ROI was also set between the cerebral hemispheres to visualize pure nerve fascicles. Likewise, the bilateral ATR, CF, SLF, ILF, UF, IFOF, and FX were also depicted (). The mean FA and ADC values of voxels containing each nerve fascicle were determined. The time required to prepare DTT was about 15 minutes. To verify the reproducibility of DTT preparation, DTT was repeated in ten HC subjects by the same operator after 1 month, and the detectability and FA and ADC values of each nerve fascicle were compared.
Figure 1 Superimposition of a DTT image of the left ATR on a sagittal T1-weighted image in HC. (A) INCLUDE-ROI I was set in the coronal plane passing the anterior commissure, and INCLUDE-ROI 2 was set in the coronal section passing the center of the genu of the corpus callosum. The ATR passing both ROIs is depicted with the corticospinal and corticopontine tracts. (B) The corticospinal and corticopontine tracts in this region were excluded by setting EXCLUDE-ROI 3 in the cross sectional plane passing the midbrain, resulting in the depiction of pure ATR.
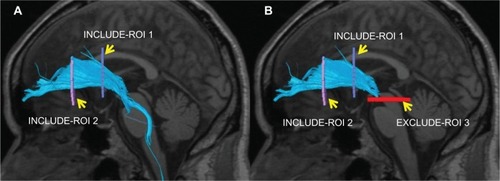
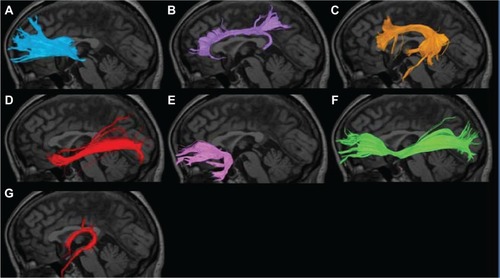
Figure 2 Nerve fascicles superimposed on T1-weighted sagittal images in HCs. (A) Anterior thalamic radiation; (B) cingulate fasciculus; (C) superior longitudinal fasciculus; (D) inferior longitudinal fasciculus; (E) uncinate fasciculus; (F) inferior fronto-occipital fasciculus; (G) fornix.
Analytical method
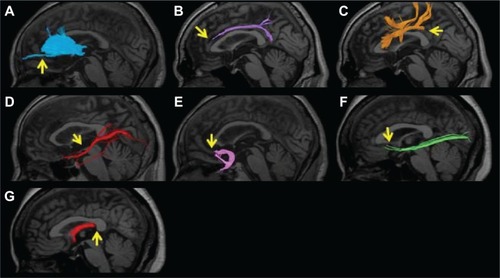
Firstly, we attempted visual evaluation of acquired tractography images. When the overall view expected from the tractography atlasCitation43,Citation44 was not visualized or the number of nerve fascicles was extremely small, the depiction was regarded as poor. Based on images of over 500 patients, depiction of no or only a few nerve fascicles in the region beyond the genu of the corpus callosum in the ATR was regarded as poor depiction. In the CF, when no nerve fascicle was depicted in the anterior upper region of the corpus callosum, the depiction was regarded as poor. In the SLF, absolutely no depiction of the tract from the parietal to the temporal lobe was regarded as poor. In the ILF, detection of extremely few nerve fascicles was regarded as poor depiction. In the UF, zero depiction of nerve fascicles extending to the orbitofrontal cortex was regarded as poor. In the IFOF, detection of extremely few nerve fascicles or no nerve fascicle extending to the prefrontal cortex was regarded as poor depiction. In the FX, zero depiction of the crus was regarded as poor ().
Figure 3 An example of poor depiction of the nerve fascicles superimposed on T1-weighted sagittal images. (A) Anterior thalamic radiation. Only a few nerve fascicles were depicted in the region beyond the genu of the corpus callosum (arrow). (B) Cingulate fasciculus. No nerve fascicle was depicted in the anterior upper region of the corpus callosum (arrow). (C) Superior longitudinal fasciculus. The region from the parietal to temporal lobe was not depicted (arrow). (D) Inferior longitudinal fasciculus. Only a few nerve fascicles were depicted (arrow). (E) Uncinate fasciculus. The nerve fascicle extending to the orbitofrontal cortex was not depicted (arrow). (F) Inferior fronto-occipital fasciculus. Very few nerve fascicles were noted, and no nerve fiber extending to the prefrontal area was depicted (arrow). (G) Fornix. The crus was not depicted (arrow).
The mean or median FA and ADC values of each nerve fascicle were compared between the AD and MDD groups, between the AD and HC groups, and between the MDD and HC groups employing Student’s and Welch’s t-tests and Mann–Whitney U-test. In addition, the laterality of nerve fascicles was compared among the subject groups.
Finally, the relationships between AD severity with ATR detectability and FA and ADC values were investigated in AD patients.
Results
The sex ratio was significantly different among the AD, MDD, and HC groups, and this may have been due to a high incidence of MDD in females. No significant differences were noted in the ages among the three groups. In the ten HC subjects investigated to confirm reproducibility, there were no significant differences in the detectability of nerve fascicles or FA or ADC values, based on which the examination was judged as reproducible.
Visual evaluation
Of the 13 AD patients, ATR depiction was poor on at least one side in nine: right and bilateral ATR in two and seven, respectively. The CF depiction was poor on at least one side in four: right and bilateral CF in two each. The SLF depiction was poor on at least one side in two: right and bilateral SLF in one each. Right ILF depiction was poor in one, and left UF depiction was poor in two. The IFOF depiction was poor on at least one side in five: right, left, and bilateral IFOF in two, one, and two, respectively. The FX depiction was poor in eleven. Of the 19 MDD patients, right CF depiction was poor in two, and SLF depiction was poor on at least one side in six: right, left, and bilateral SLF in four, one, and one, respectively. Left UF and right IFOF depiction was poor in one. The FX depiction was poor in nine. Of the 22 HC subjects, right CF depiction was poor in one, and bilateral SLF depiction was poor in two. The IFOF depiction was poor on at least one side in five: right, left, and bilateral IFOF in two, two, and one, respectively. The FX depiction was poor in eleven. No laterality was noted in the nerve fascicle detectability. The nerve fascicle detectability in the ATR in the AD group was significantly different from those in the MDD (χ2 = 18.30, P < 0.001) and HC groups (χ2 = 20.50, P < 0.001). The FX depiction was also poor, but the detectability was not significantly different from the MDD and HC groups. In the other nerve fascicles, the detectability in the AD group was not significantly different from the MDD and HC groups ().
Table 2 Number of samples with poor depiction of nerve fascicles
FA value
The FA value of the nerve fascicle was significantly reduced in the left SLF (0.410 ± 0.017, P < 0.001) and FX (0.300 ± 0.023, P < 0.001) in the AD group compared to the MDD group and HC group, and the value in the left ILF (0.409 ± 0.024, P < 0.001) was significantly lower than that in the HC group. In the left IFOF, the FA value in the AD group (0.444 ± 0.018, P = 0.045) tended to be lower than that in the MDD group. The FA value in the right ILF in the AD group (0.415 ± 0.021, P = 0.031 vs. MDD, P = 0.043 vs. HC) tended to be lower than those in the MDD and HC groups, and the values in the bilateral UF in the AD group (right: 0.383 ± 0.025, P = 0.044, left: 0.388 ± 0.038, P = 0.011) tended to be lower than those in the HC group. In the MDD group, the FA value in the left UF (0.393 ± 0.014, P < 0.001) was significantly reduced compared to the HC group, and the left ATR (0.414 ± 0.014, P = 0.028) and right UF (0.386 ± 0.017, P = 0.037) tended to be lower than those in the HC group. In the other nerve fascicles, no significant difference was noted between the AD and MDD groups, between the AD and HC groups, or between the MDD and HC groups. Laterality was noted in the SLF (P < 0.05) and IFOF (P = 0.023) in the MDD group, and UF (P = 0.003) in the HC group ().
Table 3 FA values of the nerve fascicles (means ± SD)
ADC value
The ADC values (×10−3 mm2/s) were significantly increased in the following nerve fascicles in the AD group compared to the MDD and HC groups: bilateral ATR (right: 0.905 ± 0.064, P < 0.001, left: 0.943 ± 0.104, P < 0.001), left SLF (0.871 ± 0.037, P < 0.001), left ILF (0.953 ± 0.063, P < 0.001), left IFOF (0.928 ± 0.072, P < 0.001), and FX (2.040 ± 0.184, P < 0.001). In the right CF, the value in the AD group was significantly higher than that in the MDD group and tended to be higher than that in the HC group (0.855 ± 0.034, P < 0.001 vs. MDD, P = 0.015 vs. HC). In the right ILF, the value in the AD group was significantly higher than that in the HC group and tended to be higher than that in the MDD group (0.899 ± 0.046, P < 0.001 vs. HC, P = 0.010 vs. MDD). In the left CF, the value in the AD group tended to be higher than those in the MDD and HC groups (0.863 ± 0.041, P = 0.014 vs. MDD, P = 0.013 vs. HC). In the right UF (0.910 ± 0.064, P = 0.069) and right IFOF (0.903 ± 0.068, P = 0.0299), the ADC value in the AD group tended to be higher than that in the HC group. The ADC value in the left UF (0.924 ± 0.087, P < 0.001) was significantly increased in the AD group compared to that in the HC group. Laterality was noted in the ILF (P < 0.05) in the AD group, and ILF (P < 0.05) in the MDD group ().
Table 4 ADC values of the nerve fascicles (means ± SD [× 10−3 mm2/s])
Summary
Marked differences between the AD and the MDD/HC groups were noted in the ATR on visual evaluation, left SLF and FX in the FA value, and bilateral ATR, left SLF, left ILF, left IFOF, and FX in the ADC value.
Relationships of AD severity with the ATR detectability and FA and ADC values
Of the 13 AD patients, bilateral ATR depiction was poor in two of the patients with MMSE scores between 9 and 16. In patients with MMSE scores 17–24, ATR depiction was poor on the right side in six, left side in four, and left or right side in six. In patients with an MMSE score of ≥25, bilateral ATR depiction was poor in one ( and ). The ATR depiction tended to be poor when the MMSE score was 24 or lower. The FA values of the bilateral ATR were significantly different between patients with an MMSE score of 25 or higher and 24 or lower, and they decreased with a decline in the MMSE score (P < 0.001). The ADC value was significantly different between patients with an MMSE score of 25 or higher and 24 or lower, and it increased with a rise in MMSE score (P < 0.001).
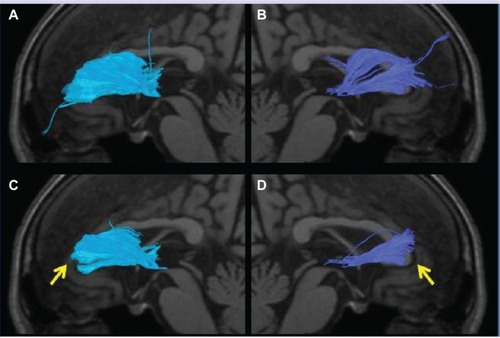
Figure 4 The anterior thalamic radiation superimposed on a T1-weighted sagittal image in an AD patient. (A) No left radiation passing the genu of the corpus callosum and extending into the prefrontal area was depicted (arrow). (B) Only a few nerve fascicles of the right radiation were observed, and depiction was poor (arrow). (C) The left posterior limb of the fornix was not depicted (arrow). (D) The right posterior limb of the fornix was only partially depicted.

Table 5 Number of AD cases with poor ATR depiction and their FA and ADC values by MMSE score
Discussion
Previous problems
In DTI, the presence or absence of impaired neuronal integrity can be observed by noninvasively measuring and imaging water molecules in the body. With the use of DTT, the nerve fiber distribution and connection can be observed by nerve-fiber tracking, which utilizes the anisotropy of DTI. Many studies on schizophrenia,Citation1–Citation8 bipolar disorder,Citation1,Citation9–Citation11 autistic spectrum disorder,Citation12,Citation13 amyotrophic lateral sclerosis,Citation14 and ADCitation15–Citation23 also reported abnormal white matter and neuronal integrity. Although the FA and ADC values were used in most of these studies, no consistent result was obtained. Because the ROI method was mainly used, in which an important difference was present, it was averaged with the surrounding voxels and its influence was maskedCitation45 or the partial volume effect that the cerebral spinal fluid might have reduced FA.Citation18 The analysis software we adopted allowed us to determine the mean FA value of only voxels traced by fiber tracking and successfully reduced the influences of other voxels around the nerve fascicle and cerebral spinal fluid. We attempted to obtain new information by visually evaluating the depicted nerve fascicles, in addition to the FA and ADC values.
Visual evaluation
The ATR and FX depictions were poor in the AD patients. In the ATR, depiction of the radiation from the region beyond the genu of the corpus callosum to the prefrontal cortex was poor in nine of the 13 AD patients. Since depiction was favorable in all MDD patients and HC subjects, the finding was specific to AD patients. This is a new finding because no visual abnormality of the ATR has previously been reported. No significant difference was noted in the FA value throughout the ATR.
Regarding the conditions for the discontinuation of fiber tracking, the default value of FA was set at 0.15, but when the FA threshold was slowly changed to 0.24, the radiation from the region beyond the genu of the corpus callosum was not depicted in eleven of the 13 AD patients (). Nerve fascicles were depicted but decreased in all MDD patients and HC subjects. When the FA value was set at 0.25, the ATR radiation to the prefrontal area in the ATR was not depicted in 12 of the 13 AD patients and one of the 22 HC subjects. The ATR radiation region was also not depicted in six AD patients in whom atrophy of the medial region of the temporal lobe including the entorhinal area, hippocampus, and amygdala could not be detected on structural MRI. Accordingly, DTT may become highly objective and sensitive in detecting ATR impairment when the FA threshold is appropriately set.
Figure 5 The anterior thalamic radiation superimposed on a T1-weighted sagittal image in an AD patient. (A and B) Several radiations passing the bilateral genus of the corpus callosum and extending to the prefrontal area are observed. (C and D) The radiations passing the bilateral genus of the corpus callosum and extending to the prefrontal area were lost by setting the threshold of the FA value at 0.24, and depiction can be readily judged as poor (arrow).
FX depiction was poor in eleven of the 13 AD patients, showing a high sensitivity (). The FX is the main output pathway from the hippocampus, and abnormality in the FX has been reported,Citation22,Citation23 which suggests that our findings are consistent with this. However, poor depiction was also noted in many MDD patients and HC subjects, and it was not specific to AD. Since this study was performed in relatively elderly subjects, age related changes may have been observed. Actually, when the FA value in the FX was closely investigated in 57 HC subjects aged 19 to 77 years, an inverse correlation was observed (r = −0.526, P < 0.001).
FA value
In the AD group, the FA value in the FX was significantly different from those in the HC and MDD groups, and the evaluation of the FX based on the FA value was more useful than the visual evaluation for the diagnosis of AD. Depiction of the left SLF was poor in only 1 of the 19 AD patients, and there was no significant difference from those in the MDD and HC groups, whereas the FA value was significantly different from those in the HC and MDD groups, showing that the FA value was also more useful for evaluation of the left SLF than visual observation for the diagnosis of AD.
ADC value
The ADC value in the AD group was significantly different from those in the MDD and HC groups in the bilateral ATR, left SLF, left ILF, left IFOF, and FX. The values in the right ILF and left UF in the AD group were significantly different from those in the HC group, respectively. The ADC value was increased in many nerve fascicles in the AD group, showing general abnormality of the cerebral white matter, as previously reported.Citation16,Citation17 In MDD group, in contrast, no significant difference was noted in each region on comparison with the HC group, showing an apparently different pattern from the AD group. Therefore, measurement of the ADC value in the cerebral white matter may be useful for differentiating between AD and MDD groups.
Summary
It has been shown that the differentiation between AD and MDD is possible by paying attention to the ATR on visual evaluation, FA values in the FX and left SLF, and ADC values in the bilateral ATR, left SLF, left ILF, left IFOF, and FX.
The FA and ADC values are quantitative parameters of DTICitation39–Citation41 mainly used in the ROI method, and also used in the voxel-basedCitation9,Citation46,Citation47 and tract-based spatial statisticsCitation48,Citation49 methods. The analysis software determines the mean FA and ADC values of voxels containing traced nerve fibers, and the FA values in the left SLF and FX in the AD group were significantly different from those in the MDD group and HC group, which was consistent with those in preceding reports.Citation15,Citation22,Citation23
Correlation of AD severity with the nerve fascicle depiction and FA value
Regarding the relationship of the AD severity with the nerve fascicle depiction and FA value, depiction of the bilateral ATR and FX was poor when the MMSE score was 24 or lower, and the FA value also tended to decrease. This suggests that visual observation and FA value measurement of the bilateral ATR and FX serve as indicators to evaluate disease progression.Citation23
Possibility as a biomarker of cognitive dysfunction
Poor ATR depiction was not limited to AD, and it was observed in our patients with cognitive dysfunction associated with Lewy body dementia, vascular dementia, schizophrenia, and bipolar disorder, which suggests that impairment of the ATR may be related to cognitive dysfunction.Citation8,Citation50 Accordingly, it is possible for observation of favorable or poor visual depiction of the ATR on DTT to serve as a useful biomarker of cognitive dysfunction.
Visual evaluation and FA value of the ATR
Why did the ATR detectability differ despite no significant difference being present in the FA value? That localization of the region with poor depiction was visually noted suggests that AD specific nerve fiber impairment does not occur throughout the nerve fiber, but some parts may be more likely to be impaired, showing localization. However, the poorly depicted region radiated from the nerve fascicle. In addition, fibers from the corpus callosum were crossing in this region, which resulted in different fiber directions in voxels. Accordingly, the FA value, which is the eigenvalue of fascicle anisotropy, tended to decrease, and it was likely that only a slight decrease in the FA value led to poor depiction. Although further investigation is necessary, for the ATR, visual evaluation of the nerve fascicles may be more useful than the FA value on the condition that the characteristics of DTT are understood: depiction is poor in regions in which many nerve fibers are mixed and cross, which causes variability even in HC subjects.Citation43,Citation44
Toward clinical application
The subjects were limited to patients with AD or MDD alone, and those with concomitant AD and MDD were excluded. The number of subjects was limited because the patient age decreased, and the age of the HC subjects and patients was matched to 77 years or younger to avoid the influence of aging, and elderly subjects aged 80 years or older were excluded. The accuracy of the visual evaluation and FA and ADC values may be improved by increasing the number of subjects.
Regarding the objectivity of DTT, the nerve fascicle detectability of conventional DTT varied depending on the MRI device and analysis software, which caused inferior objectivity for comparison among multiple facilities. However, it has been shown that we can retain the objectivity by utilizing an identical device and analysis software. The promotion of standardization of the device and analysis software may facilitate comparison among multiple institutions. Difficulty in determining the tracking direction in the nerve fiber crossing (or kissing) regions on DTT had been pointed out,Citation51 but the sensitivity of visual evaluation of abnormal nerve fascicles was high in the region with abundant crossing fibers in the ATR, ie, the region in which the nerve fascicles were crossing the genu of the corpus callosum. In voxels containing abundant crossing fibers, the FA value was reduced due to the presence of nerve fibers in different directions, and depiction of voxels was likely to become poor when the target FA value decreased, compared to that in voxels containing no crossing fibers. Q-ballCitation52 and diffusion spectrum imagingCitation53 have recently been developed, but these take a long time and cannot be readily used in clinical practice. Standardization of the tractography method may facilitate comparative studies among multiple institutions and improve the accuracy of the differential diagnosis of AD and MDD. The diagnostic performance may further be improved by combination with auxiliary diagnostic methods of MDDCitation54,Citation55 and early ADCitation56 employing voxel-based morphometry.
Conclusion
It has been shown that the differentiation of AD patients from elderly MDD patients and HC subjects becomes possible by identifying the characteristics of visual evaluation and the FA and ADC values of abnormal cerebral white matter integrity on DTT in AD.
In previous studies, abnormalities of the nerve fascicles were investigated mainly based on the FA and ADC (MD) values but the findings were inconsistent. In this study, we have considered that the addition of visual evaluation by utilizing DTT may improve the diagnostic accuracy. Depiction of the bilateral ATR on DTT tended to be poor in AD patients compared to those in MDD patients and HC subjects. The FA values in the FX and left SLF were decreased in AD patients compared to those in MDD patients and HC subjects. In addition, the ADC value was increased in many nerve fascicles.
In conclusion, differentiating between AD and elderly MDD patients becomes possible by identifying the characteristics of visual evaluation and the FA and ADC values of abnormal cerebral white matter integrity on DTT in AD, and this may become a useful auxiliary diagnostic tool.
Acknowledgment
We would like to express our sincere gratitude to Ms Takako Kuniyoshi at Nanto Clinic for her continuous encouragement and support.
Disclosure
The authors report no conflicts of interest in this work.
References
- SussmannJELymerGKMcKirdyJWhite matter abnormalities in bipolar disorder and schizophrenia detected using diffusion tensor magnetic resonance imagingBipolar Disord2009111111819133962
- SuiJPearlsonGCaprihanADiscriminating schizophrenia and bipolar disorder by fusing fMRI and DTI in a multimodal CCA+ joint ICA modelNeuroimage201157383985521640835
- BuchsbaumMSTangCYPeledSMRI white matter diffusion anisotropy and PET metabolic rate in schizophreniaNeuroreport1998934254309512384
- LimKOHedehusMMoseleyMde CrespignyASullivanEVPfefferbaumACompromised white matter tract integrity in schizophrenia inferred from diffusion tensor imagingArch Gen Psychiatry199956436737410197834
- BuchsbaumMSFriedmanJBuchsbaumBRDiffusion tensor imaging in schizophreniaBiol Psychiatry200660111181118716893533
- ParkHJWestinCFKubickiMWhite matter hemisphere asymmetries in healthy subjects and in schizophrenia: a diffusion tensor MRI studyNeuroimage200423121322315325368
- KubickiMWestinCFNestorPGCingulate fasciculus integrity disruption in schizophrenia: a magnetic resonance diffusion tensor imaging studyBiol Psychiatry200354111171118014643084
- MamahDConturoTEHarmsMPAnterior thalamic radiation integrity in schizophrenia: a diffusion-tensor imaging studyPsychiatry Res2010183214415020619618
- BrunoSCercignaniMRonMAWhite matter abnormalities in bipolar disorder: a voxel-based diffusion tensor imaging studyBipolar Disord200810446046818452442
- ZanettiMVJackowskiMPVersaceAState-dependent microstructural white matter changes in bipolar I depressionEur Arch Psychiatry Clin Neurosci2009259631632819255710
- LinFWengSXieBWuGLeiHAbnormal frontal cortex white matter connections in bipolar disorder: a DTI tractography studyJ Affect Disord20111311–329930621236494
- CheonKAKimYSOhSHInvolvement of the anterior thalamic radiation in boys with high functioning autism spectrum disorders: a Diffusion Tensor Imaging studyBrain Res20111417778621890117
- ShuklaDKKeehnBMüllerRATract-specific analyses of diffusion tensor imaging show widespread white matter compromise in autism spectrum disorderJ Child Psychol Psychiatry201152328629521073464
- AokiSIwataNKMasutaniYQuantitative evaluation of the pyramidal tract segmented by diffusion tensor tractography: feasibility study in patients with amyotrophic lateral sclerosisRadiat Med200523319519915940067
- RoseSEChenFChalkJBLoss of connectivity in Alzheimer’s disease: an evaluation of white matter tract integrity with colour coded MR diffusion tensor imagingJ Neurol Neurosurg Psychiatry200069452853010990518
- BozzaliMFranceschiMFaliniAQuantification of tissue damage in AD using diffusion tensor and magnetization transfer MRINeurology2520015761135113711571355
- BozzaliMFaliniAFranceschiMWhite matter damage in Alzheimer’s disease assessed in vivo using diffusion tensor magnetic resonance imagingJ Neurol Neurosurg Psychiatry200272674274612023417
- TaokaTIwasakiSSakamotoMDiffusion anisotropy and diffusivity of white matter tracts within the temporal stem in Alzheimer disease: evaluation of the “tract of interest” by diffusion tensor tractographyAJNR Am J Neuroradiol20062751040104516687540
- YasminHNakataYAokiSDiffusion abnormalities of the uncinate fasciculus in Alzheimer’s disease: diffusion tensor tract-specific analysis using a new method to measure the core of the tractNeuroradiology200850429329918246334
- StahlRDietrichOTeipelSJHampelHReiserMFSchoenbergSOWhite matter damage in Alzheimer disease and mild cognitive impairment: assessment with diffusion-tensor MR imaging and parallel imaging techniquesRadiology2007243248349217456872
- ChuaTCWenWSlavinMJSachdevPSDiffusion tensor imaging in mild cognitive impairment and Alzheimer’s disease: a reviewCurr Opin Neurol2008211839218180656
- KantarciKAvulaRSenjemMLDementia with Lewy bodies and Alzheimer disease: neurodegenerative patterns characterized by DTINeurology201074221814182120513818
- MielkeMMKozauerNAChanKCRegionally-specific diffusion tensor imaging in mild cognitive impairment and Alzheimer’s diseaseNeuroimage2009461475519457371
- JackCRJrPetersenRCXuYCMedial temporal atrophy on MRI in normal aging and very mild Alzheimer’s diseaseNeurology19974937867949305341
- KillianyRJGomez-IslaTMossMUse of structural magnetic resonance imaging to predict who will get Alzheimer’s diseaseAnn Neurol200047443043910762153
- XuYJackCRJrO’BrienPCUsefulness of MRI measures of entorhinal cortex versus hippocampus in ADNeurology20005491760176710802781
- MinoshimaSFosterNLKuhlDEPosterior cingulate cortex in Alzheimer’s diseaseLancet199434489268957916431
- MinoshimaSGiordaniBBerentSFreyKAFosterNLKuhlDEMetabolic reduction in the posterior cingulate cortex in very early Alzheimer’s diseaseAnn Neurol199742185949225689
- MinoshimaSFreyKAKoeppeRAFosterNLKuhlDEA diagnostic approach in Alzheimer’s disease using three-dimensional stereotactic surface projections of fuorine-18-FDG PETJ Nucl Med1995367123812487790950
- PetrellaJRColemanREDoraiswamyPMNeuroimaging and early diagnosis of Alzheimer disease: a look to the futureRadiology2003226231533612563122
- JohnsonKAJonesKHolmanBLPreclinical prediction of Alzheimer’s disease using SPECTNeurology1998506156315719633695
- KogureDMatsudaHOhnishiTLongitudinal evaluation of early Alzheimer’s disease using brain perfusion SPECTJ Nucl Med20004171155116210914904
- BurnsJJobDBastinMEStructural disconnectivity in schizophrenia: a diffusion tensor magnetic resonance imaging studyBr J Psychiatry200318243944312724248
- SummersMPapadopoulouKBrunoSCipolottiLRonMABipolar I and bipolar II disorder: cognition and emotion processingPsychol Med200636121799180916938147
- Pérez-IglesiasRTordesillas-GutiérrezDMcGuirePKWhite matter integrity and cognitive impairment in first-episode psychosisAm J Psychiatry2010167445145820160006
- American Psychiatric AssociationDiagnostic and Statistical Manual of Mental Disorders4th edWashington, DC1994123163
- BasserPJMattielloJLeBihanDMR diffusion tensor spectroscopy and imagingBiophys J19946612592678130344
- BasserPJMattielloJLeBihanDEstimation of the effective self-diffusion tensor from the NMR spin echoJ Magn Reson B199410332472548019776
- BasserPJPierpaoliCMicrostructural and physiological features of tissues elucidated by quantitative-diffusion-tensor MRIJ Magn Reson B199611132092198661285
- BasserPJInferring microstructural features and the physiological state of tissues from diffusion-weighted imagesNMR Biomed199587–83333448739270
- BeaulieuCThe basis of anisotropic water diffusion in the nervous system – a technical reviewNMR Biomed2002157–843545512489094
- MoriSCrainBJChackoVPvan ZijlPCThree-dimensional tracking of axonal projections in the brain by magnetic resonance imagingAnn Neurol19994522652699989633
- WakanaSJiangHNagae-PoetscherLMvan ZijlPCMoriSFiber tract-based atlas of human white matter anatomyRadiology20042301778714645885
- WakanaSCaprihanAPanzenboeckMMReproducibility of quantitative tractography methods applied to cerebral white matterNeuroimage200736363064417481925
- XekardakiAGiannakopoulosPHallerSWhite Matter Changes in Bipolar Disorder, Alzheimer Disease, and Mild Cognitive Impairment: New Insights from DTIJ Aging Res2011201128656422187647
- LeungLHOoiGCKwongDLChanGCCaoGKhongPLWhite-matter diffusion anisotropy after chemo-irradiation: a statistical parametric mapping study and histogram analysisNeuroimage200421126126814741664
- AbeOYamadaHMasutaniYAmyotrophic lateral sclerosis: diffusion tensor tractography and voxel-based analysisNMR Biomed200417641141615386625
- Barnea-GoralyNChangKDKarchemskiyAHoweMEReissALLimbic and corpus callosum aberrations in adolescents with bipolar disorder: a tract-based spatial statistics analysisBiol Psychiatry200966323824419389661
- SmithSMJenkinsonMJohansen-BergHTract-based spatial statistics: voxelwise analysis of multi-subject diffusion dataNeuroimage20063141487150516624579
- RobinsonLJFerrierINEvolution of cognitive impairment in bipolar disorder: a systematic review of cross-sectional evidenceBipolar Disord20068210311616542180
- WiegellMRLarssonHBWedeenVJFiber crossing in human brain depicted with diffusion tensor MR imagingRadiology2000217389790311110960
- TuchDSQ-ball imagingMagn Reson Med20045261358137215562495
- WedeenVJHagmannPTsengWYReeseTGWeisskoffRMMapping complex tissue architecture with diffusion spectrum magnetic resonance imagingMagn Reson Med20055461377138616247738
- NiidaRNiidaAMotomuraMUechiADiagnosis of depression by MRI scans with the use of VSRAD – a promising auxiliary means of diagnosis: a report of 10 years researchInt J Gen Med2011437738721625414
- NiidaANiidaRMatsudaHInadaTMotomuraMUechiAIdentification of atrophy of the subgenual anterior cingulate cortex, in particular the subcallosal area, as an effective auxiliary means of diagnosis for major depressive disorderInt J Gen Med2012566767422924012
- MatsudaHMizumuraSNemotoKAutomatic voxel-based morphometry of structural MRI by SPM8 plus diffeomorphic anatomic registration through exponentiated lie algebra improves the diagnosis of probable Alzheimer DiseaseAJNR Am J Neuroradiol20123361109111422300935