
Abstract
Purpose
Chronic kidney disease (CKD) will become an end-stage renal disease (ESRD) at stage 5. Peritoneal dialysis (PD) is required for renal replacement therapy. This study aims to identify monocytes-related genes in peritoneal cells from long-term PD (LPD) patients and short-term PD (SPD) patients.
Methods
Bulk RNA-seq data (GSE125498 dataset) and ScRNA-seq data (GSE130888) were downloaded to identify differentially expressed genes, monocytes-related genes, and monocytes marker genes in LPD patients. Immune infiltration was analyzed in the GSE125498 dataset. Core genes associated with monocytes changes were screened out, followed by functional analysis and expression validation using RT-PCR.
Results
Monocytes are the most abundant immune cell in PD. The number of monocytes was remarkably decreased in LPD compared with SPD. A total of 16 up-regulated core genes negatively correlated with the abundance of monocytes were obtained in LPD. The expression of 16 core genes was lower in monocyte clusters than that in other cell clusters. In addition, LCK, CD3G, CD3E, CD3D, and LAT were involved in the signaling pathways of Th1 and Th2 cell differentiation, T cell receptor signaling pathway, and Th17 cell differentiation. CD2 was involved in hematopoietic cell lineage signaling pathway.
Conclusion
Identification of monocytes related-genes and related signaling pathways could be helpful in understanding the molecular mechanism of monocytes changes during PD.
Introduction
The peritoneum, the largest biological internal membrane, covers the surface of abdominal organs and the walls of the abdominal cavity. Currently, peritoneal dialysis (PD) is considered as an effective method of renal replacement therapy for patients with end-stage renal disease. Compared to hemodialysis, PD offers some advantages such as better preservation of residual renal function and similar survival.Citation1 However, long-term exposure of the peritoneal membrane to non-biocompatible PD fluid results in structural and functional abnormalities of peritoneum, ultimately leading to PD failure.Citation2 Clinically, peritonitis is a common complication of PD, which contributes to reduced technique survival in the short and mid-term. In addition, peritoneal fibrosis remains a serious complication of long-term PD (LPD). Moreover, peritoneal fibrosis leads to loss of peritoneal ultrafiltration capacity, with inflammation as a key event of pathogenesis.Citation3
In the peritoneal tissues of patients who undergo an LPD therapy, peritoneal inflammation and fibrosis are regulated by the cytokine network in the celiac immune system.Citation4 It is noted that monocytes play an important role in the systemic inflammatory response to severe injury and infection. It has been demonstrated that the altered expression of monocyte subsets affects the modulation of inflammation and immunity with significant clinical implications.Citation5 During inflammation, monocytes circulate through the blood and extravasate into inflamed tissues after the general paradigm of the leukocyte recruitment cascade. Upon recruitment to sites of inflammation, monocytes are generally thought to differentiate into macrophages while maintaining the same inflammatory phenotype.Citation6 Therefore, it is crucial to fully elucidate the exact pathologic mechanisms underlying the alterations of monocytes and related genes in the peritoneal cells of the peritoneum during LPD, in order to recognize potential therapeutic targets to protect the membrane integrity. In addition, with the development of biotechnology, experimental studies have produced high-throughput transcriptome data and single-cell sequencing data, which play an important role in revealing genes related to diseases or treatments. High-throughput RNA-sequencing (RNA-seq) is an indispensable tool for transcriptome-wide transcriptional variation analysis. RNA-seq can capture various types of RNA, including mRNAs, miRNAs, lncRNAs, and circRNAs.Citation7,Citation8 High-throughput single-cell transcriptome sequencing, commonly referred to as single-cell RNA sequencing (scRNA-seq), is used to measure gene expression at the single-cell level.Citation9 ScRNA-seq analysis of systemic lupus erythematosus nephritis revealed that high expression of interferon-inducible genes in renal tubular cells was associated with disease severity.Citation10 ScRNA-seq analysis has also been applied to the rejection response after kidney transplantation to deconstruct its heterogeneity and identify new targets for personalized treatment methods.Citation11 In this study, Bulk RNA-seq and ScRNA-seq data from LPD and short-term peritoneal dialysis (SPD) patients were downloaded to identify monocytes-related genes during the PD process.
Materials and Methods
Datasets
In this study, bulk RNA-seq data and scRNA-seq data from peritoneal cell samples from PD patients were used for analysis. GSE125498 dataset (involving RNA-seq data from peritoneal cell samples)Citation12 and GSE130888 dataset (involving scRNA-seq data from peritoneal cell samples)Citation13 were downloaded from the Gene Expression Omnibus (GEO) database. There are 13 long-term PD (LPD) patients and 20 short-term PD (SPD) patients in the GSE125498 dataset. The GSE130888 dataset includes four long-term PD patients, six short-term PD patients, and three normal controls. The GSE125498 dataset was used for differential expression analysis, immune infiltration analysis, and weighted gene co-expression network analysis (WGCNA). The GSE130888 dataset was used to identify monocyte marker genes.
Identification of Differentially Expressed Genes (DEGs) and Immune Infiltration Analysis
The gene expression profile was annotated with the annotation file. DEGs were identified through the limma package in R under the screening criteria of p < 0.05 and |log2 fold change (FC)| > 0.5. Heat maps and volcano maps of DEGs were, respectively, visualized using “Pheatmap” and “GGPlot” packages in R. In addition, combined with the known immune cell characteristics, the “CIBERSORT” package in R was used to calculate the proportion of 22 kinds of immune cells in the sample based on the expression of the genes. Expression of characteristic genes was extracted to form the expression matrix. The proportion of relevant monocytes was extracted. Correlations between genes and monocytes were calculated by Pearson test and visualized through ggplot packages in R.
Wgcna
WGCNA is a typical systematic biological algorithm to construct gene co-expression networks. The “WGCNA” package in R was used to analyze the co-expression network of genes in the top 25% of the coefficient of variation, followed by the construction of a scale-free gene co-expression network. The “pickSoftThreshold” function was used to select an appropriate soft threshold power regulator to build the scale-free topology. The adjacency matrix is calculated according to the soft threshold. The adjacency matrix is transformed into a topological overlap matrix and the corresponding dissimilarity matrix. The average linkage hierarchical clustering method was used to cluster genes. According to the criteria of the hybrid dynamic shear tree method, the minimum number of genes in each gene network module was set to 30. The characteristic genes of each module were successively calculated. Those hub modules most significantly associated with monocytes were selected. Module connectivity is defined as the absolute value of Pearson correlation between genes. Monocyte relationship is defined as the absolute value of Pearson correlation between each gene and monocyte. In the hub module, genes with module connectivity > 0.8 and monocyte relationship > 0.2 were considered as monocytes related genes.
Identification of Monocytes Marker Genes
ScRNA-seq data in the GSE130888 dataset was analyzed using the “Seurat” and “SingleR” packages in R. A total of 77,197 cells from 10 PD samples were included in the analysis. Quality control was carried out according to the following standards: (1) genes detected in less than 3 cells were excluded; (2) cells with a total number of genes less than 50 were excluded; (3) cells with mitochondrial expression genes more than 5% were excluded; (4) all cells with gene expression less than 1000 were excluded. After this procedure, a total of 66,350 cells were retained. Gene expression in these cells was normalized using linear regression models. The t-distributed random neighborhood embedding algorithm is applied to reduce the dimension of top 20 principal components. Cluster analysis was performed for all cells. Different cell clusters were identified and annotated using a singleR package in R based on the compositional pattern of the marker genes. Differential expression analysis of all genes within cell clusters was performed using the limma package in R to identify marker genes for each cluster. Monocytes marker genes were identified under the threshold value of false discovery rate (FDR) < 0.05 and | log2FC | > 1.
Identification and Functional Analysis of Core Genes
The DEGs, monocytes related genes in the hub model and monocytes marker genes were intersected to obtain core genes related to monocytes changes during PD. Database for Annotation, Visualization, and Integrated Discovery (DAVID) database was used for functional analysis of core genes. Significantly enriched Gene Ontology (GO) and Kyoto Encyclopedia of Genes and Genomes (KEGG) terms were identified under the screening criteria of p < 0.05 and visualized by bubble maps.
Expression Validation of Core Genes by Reverse Transcriptase Polymerase Chain Reaction (RT-PCR)
RT-PCR was used to validate the expression of core genes in blood samples from LPD and SPD patients. Based on the standards in the GSE125498 and GSE130888 datasets, the inclusion and exclusion criteria for PD patients in this study were set. For LPD patients, the duration of dialysis was more than 25 months. For SPD patients, the duration of dialysis was 0–24 months. The common inclusion criteria of LPD and SPD patients were as follows: (1) patients had no signs of infection at the time of examination and were free of peritonitis for at least 4 weeks prior to the inclusion; (2) patients’ clinical laboratory data were complete. The exclusion criteria of LPD and SPD patients were as follows: (1) patients with peritonitis; (2) patients had severe infectious diseases, systemic inflammatory diseases, autoimmune diseases, and malignant diseases; (3) patients with diabetes; (4) patients had a family history; (5) patients had incomplete clinical data. Based on the above inclusion and exclusion criteria, a total of 14 LPD patients and 11 SPD patients were enrolled from the population examined and treated in General Hospital of Northern Theater Command. The blood samples were collected from July 4, 2022 to November 19, 2022. Clinical information about these patients is listed in . Blood samples from these patients were collected for RT-PCR. GAPDH and ACTB were used as internal references. 2−ΔΔct method was used to calculate the expression of gene. 2−ΔΔct > 1 and 2−ΔΔct < 1 represent up-regulation and down-regulation, respectively. The study was approved by the ethics committee of the General Hospital of Northern Theater Command. In addition, all individuals provided the informed consent of the patients and their families.
Table 1 Clinical Information of Patients in RT-PCR
Statistical Analysis
T-test was used for statistical analysis in the expression validation in RT-PCR. P < 0.05 was considered as a statistical difference.
Results
Identification of DEGs and Immune Infiltration in LPD Patients
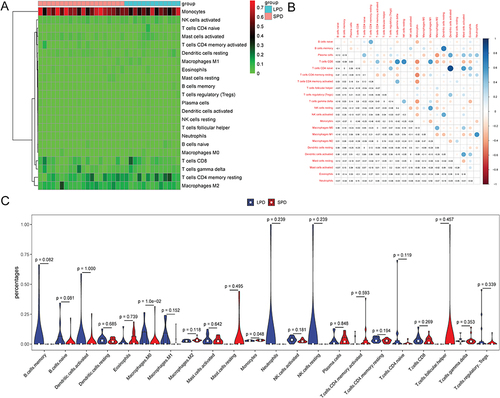
Compared with SPD patients, 823 DEGs were identified in peritoneal cells of LPD patients, including 513 up-regulated and 310 down-regulated genes. Volcanic maps and heat maps of top 100 genes are presented in and , respectively. In addition, estimation of immune cells in peritoneal cells from PD patients was performed using CIBERSORT package in R. Based on the clustering of 22 kinds of immune cell subsets, peritoneal cell samples were divided into two discrete groups (). It is noted that monocytes were the most abundant immune cell. In addition, the correlation between 22 kinds of immune cell types was further estimated (), which showed strong correlations among some immune cell subpopulations. For example, monocytes were negatively correlated with many T cells. Among which, monocytes were most negatively correlated with T cells CD4 memory resting (r = −0.48, p < 0.05). Moreover, the number of monocytes was significantly decreased in LPD compared with SPD (p = 0.05) (). It is indicated that the number of monocytes decreases with the prolongation of PD time.
Figure 1 Volcanic maps (A) and heat maps (B) of top 100 genes in LPD patients.
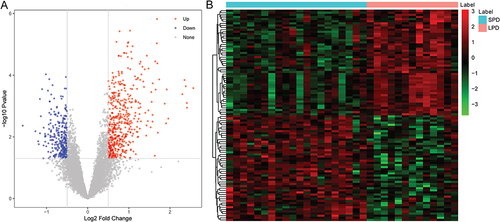
Figure 2 Immune infiltration analysis. (A) the heat maps of immune cell subsets; (B) correlation analysis between immune cell types; (C) percentages of immune cell subsets.
Identification of Monocytes Related Genes in the WGCNA
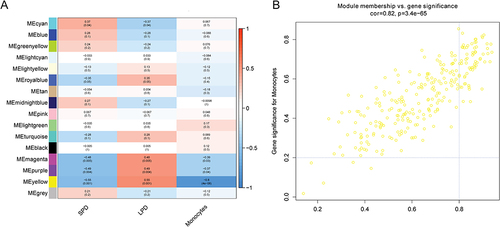
In the top 25% of the coefficient of variation in the sample, 4391 genes were utilized to construct a weighted gene co-expression network. The clustering result showed that there was an outlier sample (GSM3575608) (). After removing outlier sample, the dendrogram of 32 samples and heat map of monocyte abundance are shown in . The β = 6 was chosen as the soft threshold to construct the scale-free network (). Dynamic tree cutting method was utilized to merge modules with dissimilarity < 30%. Totally, 16 modules were finally determined (). It is worth mentioning that genes in the yellow module (involving 263 genes) were the highest negatively correlated with monocytes (R2 = −0.8, p < 0.001) (). The scatter plot of genes in yellow module is shown in . In the yellow module, 64 genes were associated with changes in monocytes during PD.
Figure 3 WGCNA in PD patients. (A) sample clustering. Above the red line was an outlier sample; (B) sample dendrogram and heat map of monocyte abundance; (C) filtering of soft thresholds; (D) identification of modules.
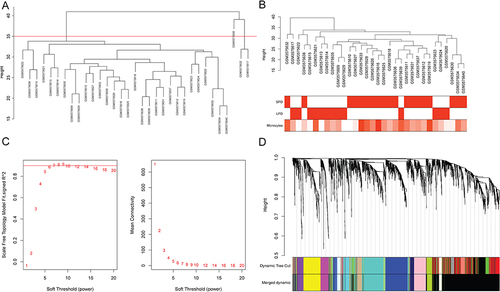
Figure 4 Identification of key modules associated with monocytes. (A) correlation between monocytes and different gene modules; (B) scatter plot of genes in yellow module.
Identification of Monocytes Marker Genes
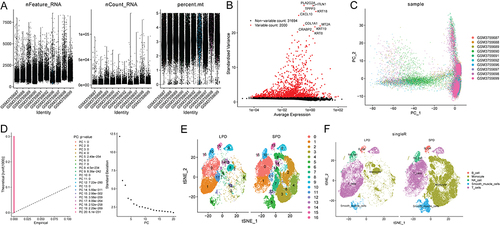
After excluding low-quality cells and genes, a total of 66,350 cells (involving 33,694 genes) from 10 PD patients were used for analysis (). There were 2000 highly variable genes in the variance analysis (). Principal components analysis (PCA) was performed to identify available dimensions and screen for relevant genes. There was no significant segregation between cells (). Top 20 principal components were selected for subsequent analysis (). Through a t-distributed random neighborhood embedding algorithm, the peritoneal cells were successfully divided into 17 independent clusters (). Clusters of 2, 3, 4, 6, 7, 8, 12, 13, 14, and 16 were annotated as monocytes. Interestingly, the number of monocytes in LPD patients was significantly lower than that in SPD patients. The results were consistent with those of the immune infiltration analysis results in the GSE125498 dataset. There were different gene expression profiles in different cell clusters. Some genes were differentially expressed among the 17 clusters. These clusters were annotated by singleR based on the expression patterns of marker genes (). After differential expression analysis between monocytes clusters and other cell clusters, a total of 231 monocytes marker genes were identified.
Figure 5 Identification of monocytes marker genes. (A) 66,350 cells were used for analysis; (B) highly variable genes in the variance analysis; (C) PCA; (D) analysis of top 20 principal components; (E) 17 independent clusters of peritoneal cells; (F) annotation of clusters.
Identification and Functional Analysis of Core Genes in LPD Patients
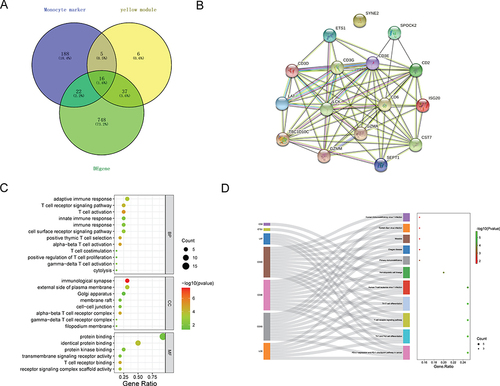
A total of 16 common up-regulated genes were identified between 823 DEGs, 64 monocytes related genes in the yellow model, and 231 monocytes marker genes (). These genes were granzyme A (GZMA), granzyme M (GZMM), TBC1 domain family member 10C (TBC1D10C), SPARC (osteonectin), cwcv and kazal-like domains proteoglycan 2 (SPOCK2), CD2 molecule (CD2), CD6 molecule (CD6), CD3 epsilon subunit of T-cell receptor complex (CD3E), CD3 delta subunit of T-cell receptor complex (CD3D), CD3 gamma subunit of T-cell receptor complex (CD3G), LCK proto-oncogene, Src family tyrosine kinase (LCK), interferon stimulated exonuclease gene 20 (ISG20), linker for activation of T cells (LAT), ETS proto-oncogene 1, transcription factor (ETS1), spectrin repeat containing nuclear envelope protein 2 (SYNE2), septin 1 (SEPTIN1), and cystatin F (CST7). PPI results showed that there were interactions between these common core genes, except for SYNE2 (). Based on GO analysis of 16 common core genes, T cell activation, immunological synapse, and T cell receptor binding was the most significantly enriched biological process, cytological component, and molecular function, respectively (). In addition, Th1 and Th2 cell differentiation, T cell receptor signaling pathway, Th17 cell differentiation, and hematopoietic cell lineage were significantly enriched signaling pathways (). It is noted that LCK, CD3G, CD3E, CD3D, and LAT were involved in the signaling pathways of Th1 and Th2 cell differentiation, T cell receptor signaling pathway, and Th17 cell differentiation. CD2 was involved in hematopoietic cell lineage signaling pathway.
Figure 6 Identification and functional analysis of core genes. (A) Venn diagram; (B) PPI network; (C) GO analysis; (D) KEGG analysis.
Expression and Correlation Analysis of Core Genes in Monocytes of LPD Patients
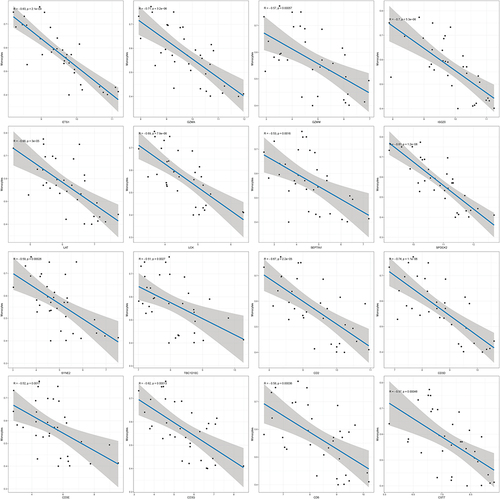
In order to explore the expression of 16 core genes in monocytes, relative expression of these genes in each cell cluster was compared. The results showed that the expression of 16 core genes was lower in monocyte clusters than that in other cell clusters (). In addition, the correlation between 16 core genes and monocytes was analyzed. The expression of 16 core genes was negatively correlated with the abundance of monocytes ().
Figure 7 Expression analysis of core genes in monocytes.
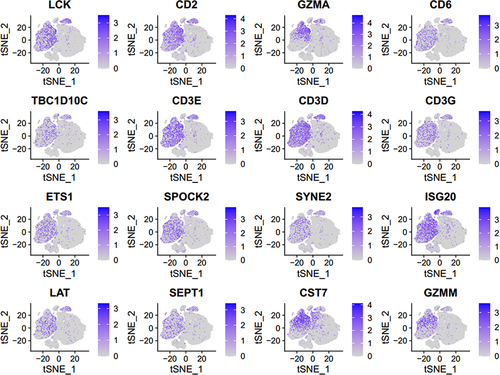
Figure 8 Correlation analysis between core genes and monocytes.
Expression Validation of Core Genes in LPD Patients
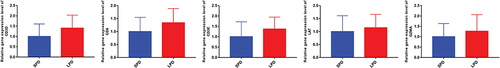
Totally, five core genes (CD3D, CD6, CD3E, LAT, and GZMA) were used for expression validation by RT-PCR (). The results showed that CD3D, CD6, CD3E, LAT, and GZMA were up-regulated in the blood samples of LPD patients compared with SPD patients. The expression trend consisted with the informatics analysis results.
Figure 9 Expression validation of core genes in LPD patients.
Discussion
In end-stage kidney disease, the altered expression of immune cells including monocyte subsets affects the modulation of immunity and inflammation.Citation14 Innate immune cells, monocytes, and polymorphonuclear leukocytes recognize pathogens through Toll-like receptors, which trigger phagocytosis, cell activation, and secretion of inflammatory cytokines. A study found that TLR2 and TLR4 expression were significantly up-regulated in monocytes in the end-stage kidney disease group.Citation15 Furthermore, monocyte count modifies the association between chronic kidney disease and the risk of death.Citation16 In this study, we found that monocytes were the most abundant immune cell in peritoneal cells of LPD patients. Moreover, the number of monocytes was significantly decreased in LPD compared with SPD. It is indicated that the number of monocytes decreases with the prolongation of PD time. In addition, 16 up-regulated core genes were negatively correlated with the abundance of monocytes, including CST7, SYNE2, SPOCK2, CD2, CD3D, CD6, LCK, ISG20, TBC1D10C, GZMM, CD3E, LAT, GZMA, SEPTIN1, CD3G, and ETS1. Moreover, the expression of 16 core genes was lower in monocyte clusters than that in other cell clusters.
CST7 acts on hematopoietic cell precursors and regulates immune function.Citation17,Citation18 Significantly increased expression of CST7 has been found in glomeruli.Citation19 SYNE2 is involved in cell cycle regulation and acted upon by viral proteins.Citation20 SPOCK2 is an important downstream target within the regulation of nephron development.Citation21 CD2 is associated with extracellular vesicle characteristics in different kidney diseases.Citation22 In transgenic mice, over expression of RORγt under the control of the CD2 promoter contributes to the development of peritoneum fibrosis.Citation23 CD3D is up-regulated in the biopsies of acute rejection patients after kidney transplantation.Citation24 CD6 is associated with acute rejection across renal allografts.Citation25 LCK plays an important role in end-stage kidney disease.Citation26 Via acting on T-cell receptor, LCK could be a therapeutic target for acute rejection after kidney transplantation.Citation27 ISG20 is over-expressed in kidney injury and antibody-mediated rejection.Citation28,Citation29 TBC1D10C is an abundant protein in peripheral blood leukocytes. In immune cells, TBC1D10C plays roles in the regulation of lymphocyte activation.Citation30 Thus, it can be seen that CST7, SYNE2, SPOCK2, CD2, CD3D, CD6, LCK, ISG20, and TBC1D10C play an important role in kidney fibrosis and acute rejection patients after kidney transplantation. However, up to now, there have been few studies on CST7, SYNE2, SPOCK2, CD2, CD3D, CD6, LCK, ISG20, and TBC1D10C regulating the role of monocytes in PD. In this study, we found that the number of monocytes significantly decreased in LPD compared to SPD. The expression of CST7, SYNE2, SPOCK2, CD2, CD3D, CD6, LCK, ISG20, and TBC1D10C were lower in monocyte clusters than that in other cell clusters. Moreover, correlation analysis showed that the expression levels of CST7, SYNE2, SPOCK2, CD2, CD3D, CD6, LCK, ISG20, and TBC1D10C were negatively correlated with monocyte abundance. Therefore, it is hypothesized that CST7, SYNE2, SPOCK2, CD2, CD3D, CD6, LCK, ISG20, and TBC1D10C may play an important role in LPD patients by regulating monocytes, but the specific molecular mechanism needs to be further studied.
GZMM is released in the context of severe inflammation.Citation31 GZMM enhances the cytotoxic function and contributes to the immunostimulatory microenvironment.Citation32 CD3E, involved in inflammatory and involved T-cell development, is associated with the transition from acute to chronic kidney injury following ischemia/reperfusion.Citation33–35 CD3E can predict T-cell–mediated rejection in kidney allograft.Citation36 LAT is involved in inflammatory signaling pathway in chronic PD.Citation33 GZMA can induce the expression of pro-inflammatory cytokines in macrophages, monocytes, and fibroblasts.Citation37–41 In kidney, ablation of expression of GZMA leads to an increase in the number of Theileria-containing tumours.Citation42 In kidney allografts, GZMA is associated with acute rejection.Citation43 However, there are few studies on GZMM, CD3E, LAT, and GZMA regulating the role of monocytes in PD. In this study, we found that the expression levels of GZMM, CD3E, LAT, and GZMA were up-regulated, and the number of monocytes was significantly decreased in LPD compared to SPD. Moreover, correlation analysis showed that the expression levels of GZMM, CD3E, LAT, and GZMA were significantly negatively correlated with monocyte abundance. Therefore, it is speculated that the increased expression of GZMM, CD3E, LAT, and GZMA may be involved in the peritoneal inflammatory response of LPD, and the mechanism may be related to the decreased abundance of monocytes.
SEPTIN1 is involved in immune and inflammatory processes.Citation44 CD3G, associated with inflammation and immune system activation, has been identified as a potential therapeutic target for acute rejection after kidney transplantation.Citation27,Citation33,Citation45 ETS1, an inflammatory and immune cell-specific transcription factor, plays a key role in kidney development.Citation46–48 The expression of ETS1 is increased in interstitium and glomeruli during the progression of crescentic glomerulonephritis.Citation49 After 12 months of dialysis treatment, CpG sites in ETS1 are significantly less methylated in patients.Citation50 In acute kidney injury patients, knocking down ETS1 will alleviate the pyroptosis of renal tubular epithelial cells.Citation51 In this study, we found that the expression levels of SEPTIN1, CD3G, and ETS1 were up-regulated. Moreover, correlation analysis showed that the expression levels of SEPTIN1, CD3G, and ETS1 were significantly negatively correlated with monocyte abundance. Therefore, it is speculated that SEPTIN1, CD3G, and ETS1 may play a crucial role in both immune and inflammatory processes in LPD by regulating monocyte abundance.
Based on functional analysis of above 16 core genes, we found that LCK, CD3G, CD3E, CD3D, and LAT were involved in the signaling pathways of Th1 and Th2 cell differentiation, T cell receptor signaling pathway and Th17 cell differentiation. CD2 was involved in hematopoietic cell lineage signaling pathway. Zamauskaite et al found that PD patients presented subclinical systemic inflammation, characterized by activated Th1/Th2 responses.Citation52 Pharmacological therapeutic strategy that modulates T cell responses could prevent PD fluids-induced peritoneal damage.Citation53 Th17 cells are participated in the pathogenesis of several autoimmune and inflammatory diseases, such as CKD.Citation54 Accumulation of Th17 cells in the dialyzed peritoneum is associated with inflammation and fibrosis.Citation55 It is found that dialysate cells in PD effluents are largely composed of a small portion of hematopoietic stem cells.Citation56 It is indicated that LCK, CD3G, CD3E, CD3D, LAT, and CD2 may be involved in the pathological mechanism of PD process.
In this study, we found that the number of monocytes significantly decreased in LPD compared to SPD, implying that monocytes influence the PD process. Moreover, correlation analysis showed that the expression levels of 16 core genes were negatively correlated with monocyte abundance, which again implied that monocytes play an important role in PD. The negative correlation between these up-regulated core genes and decreased monocytes abundance may be associated with LPD. In addition, functional enrichment analysis showed that the core genes may be involved in the regulation of multiple immune signaling pathways, which laid a theoretical foundation for understanding the molecular mechanism during PD. In short, this study contributes to the understanding of the molecular mechanism of monocytes in LPD and provides potential directions for further research. However, there are limitations to this study. Firstly, the expression of identified genes is needed to be validated in larger numbers of clinical samples. Secondly, a deeper action mechanism between genes, monocytes, and related signaling pathways is needed in further animal models.
Data Sharing Statement
The database analysed during the current study is available in the GEO database, and persistent accessible web link to database is https://www.ncbi.nlm.nih.gov/geo/. Accession numbers of the datasets used in the current study are GSE125498 and GSE130888. All data generated or analyzed during this study are included in this published article.
Ethics Approval and Consent to Participate
The present study was approved by the Ethics Committee of the General Hospital of Northern Theater Command (Y(2023)154). This study complied with the Declaration of Helsinki. Written informed consent was obtained from all participants.
Disclosure
The authors declare that they have no conflicts of interest.
Additional information
Funding
References
- Mehrotra R, Devuyst O, Davies SJ, et al. The current state of peritoneal dialysis. J Am Soc Nephrol. 2016;27(11):3238–3252. doi:10.1681/ASN.2016010112
- Htay H, Johnson DW, Wiggins KJ, et al. Biocompatible dialysis fluids for peritoneal dialysis. Cochrane Database Syst Rev. 2018;10(10):Cd007554. doi:10.1002/14651858.CD007554.pub3
- Zhang Z, Jiang N, Ni Z. Strategies for preventing peritoneal fibrosis in peritoneal dialysis patients: new insights based on peritoneal inflammation and angiogenesis. Front Med. 2017;11(3):349–358. doi:10.1007/s11684-017-0571-2
- Rumpsfeld M, McDonald SP, Johnson DW. Higher peritoneal transport status is associated with higher mortality and technique failure in the Australian and New Zealand peritoneal dialysis patient populations. J Am Soc Nephrol. 2006;17(1):271–278. doi:10.1681/ASN.2005050566
- Dounousi E, Duni A, Naka KK, et al. The innate immune system and cardiovascular disease in ESKD: monocytes and natural killer cells. Curr Vasc Pharmacol. 2021;19(1):63–76. doi:10.2174/18756212MTA3yNzEe1
- Kratofil RM, Kubes P, Deniset JF. Monocyte conversion during inflammation and injury. Arterioscler Thromb Vasc Biol. 2017;37(1):35–42. doi:10.1161/ATVBAHA.116.308198
- Xiang Y, Ye Y, Zhang Z, et al. Maximizing the utility of cancer transcriptomic data. Trend Cancer. 2018;4(12):823–837. doi:10.1016/j.trecan.2018.09.009
- Wu J, Fang Z, Liu T, et al. Maximizing the utility of transcriptomics data in inflammatory skin diseases. Front Immunol. 2021;12:761890.
- Gao S. Data analysis in single-cell transcriptome sequencing. Methods Molecul Biol. 2018;1754:311.
- Der E, Ranabothu S, Suryawanshi H, et al. Single cell RNA sequencing to dissect the molecular heterogeneity in lupus nephritis. JCI Insight. 2017;2(9). doi:10.1172/jci.insight.93009
- Wen N, Wu J, Li H, et al. Immune landscape in rejection of renal transplantation revealed by high-throughput single-cell RNA sequencing. Front Cell Dev Biol. 2023;11(1208566). doi:10.3389/fcell.2023.1208566
- Parikova A, Hruba P, Krejcik Z, et al. Peritoneal dialysis induces alterations in the transcriptome of peritoneal cells before detectible peritoneal functional changes. Am J Physiol Renal Physiol. 2020;318(1):F229–f237. doi:10.1152/ajprenal.00274.2019
- Si M, Wang Q, Li Y. Inhibition of hyperglycolysis in mesothelial cells prevents peritoneal fibrosis. Sci Transl Med. 2019;11(495). doi:10.1126/scitranslmed.aav5341
- Duni A, Vartholomatos G, Balafa O, et al. The association of circulating CD14++CD16+ monocytes, natural killer cells and regulatory T cells subpopulations with phenotypes of cardiovascular disease in a cohort of peritoneal dialysis patients. Front Med. 2021;8(724316). doi:10.3389/fmed.2021.724316
- Gollapudi P, Yoon JW, Gollapudi S, et al. Leukocyte toll-like receptor expression in end-stage kidney disease. Am J Nephrol. 2010;31(3):247–254. doi:10.1159/000276764
- Koraishy FM, Bowe B, Xie Y, et al. Monocyte count modifies the association between chronic kidney disease and risk of death. Clin Nephrol. 2018;90(3):194–208. doi:10.5414/CN109434
- Ni J, Fernandez MA, Danielsson L, et al. Cystatin F is a glycosylated human low molecular weight cysteine proteinase inhibitor. J Biol Chem. 1998;273(38):24797–24804. doi:10.1074/jbc.273.38.24797
- Galan-Caridad JM, Harel S, Arenzana TL, et al. Zfx controls the self-renewal of embryonic and hematopoietic stem cells. Cell. 2007;129(2):345–357. doi:10.1016/j.cell.2007.03.014
- Sur S, Nguyen M, Boada P, et al. FcER1: a novel molecule implicated in the progression of human diabetic kidney disease. Front Immunol. 2021;12(769972). doi:10.3389/fimmu.2021.769972
- Bass A, Liu Y, Dakshanamurthy S. Single-cell and bulk RNASeq profiling of COVID-19 patients reveal immune and inflammatory mechanisms of infection-induced organ damage. Viruses. 2021;13(12):2418. doi:10.3390/v13122418
- Nittoli V, Fortunato AE, Fasano G, et al. Characterization of paralogous uncx transcription factor encoding genes in zebrafish. Gene X. 2019;2(100011). doi:10.1016/j.gene.2019.100011
- Behrens F, Holle J, Kuebler WM, et al. Extracellular vesicles as regulators of kidney function and disease. Intensive Care Med Exp. 2020;8(Suppl 1):22. doi:10.1186/s40635-020-00306-2
- Yoh K, Ojima M, Takahashi S. Th2-biased GATA-3 transgenic mice developed severe experimental peritoneal fibrosis compared with Th1-biased T-bet and Th17-biased RORγt transgenic mice. Exp Anim. 2015;64(4):353–362. doi:10.1538/expanim.15-0019
- Flechner SM, Kurian SM, Head SR, et al. Kidney transplant rejection and tissue injury by gene profiling of biopsies and peripheral blood lymphocytes. Am J Transplant. 2004;4(9):1475–1489. doi:10.1111/j.1600-6143.2004.00526.x
- Sigdel TK, Bestard O, Tran TQ, et al. A computational gene expression score for predicting immune injury in renal allografts. PLoS One. 2015;10(9):e0138133. doi:10.1371/journal.pone.0138133
- Smyth LJ, Kilner J, Nair V, et al. Assessment of differentially methylated loci in individuals with end-stage kidney disease attributed to diabetic kidney disease: an exploratory study. Clin Epigenetics. 2021;13(1):99. doi:10.1186/s13148-021-01081-x
- Jia L, Jia R, Li Y, Li X, Jia Q, Zhang H. LCK as a potential therapeutic target for acute rejection after kidney transplantation: a bioinformatics clue. J Immunol Res. 2018;2018(6451298):1–9. doi:10.1155/2018/6451298
- Sigdel T, Nguyen M, Liberto J, et al. Assessment of 19 genes and validation of CRM gene panel for quantitative transcriptional analysis of molecular rejection and inflammation in archival kidney transplant biopsies. Front Med. 2019;6(213). doi:10.3389/fmed.2019.00213
- Alfaro R, Martínez-Banaclocha H, Llorente S, et al. Computational prediction of biomarkers, pathways, and new target drugs in the pathogenesis of immune-based diseases regarding kidney transplantation rejection. Front Immunol. 2021;12(800968). doi:10.3389/fimmu.2021.800968
- Villagomez FR, Diaz-Valencia JD, Ovalle-García E, et al. TBC1D10C is a cytoskeletal functional linker that modulates cell spreading and phagocytosis in macrophages. Sci Rep. 2021;11(1):20946. doi:10.1038/s41598-021-00450-z
- Bade B, Boettcher HE, Lohrmann J, et al. Differential expression of the granzymes A, K and M and perforin in human peripheral blood lymphocytes. Int Immunol. 2005;17(11):1419–1428. doi:10.1093/intimm/dxh320
- Garzón-Tituaña M, Arias MA, Sierra-Monzón JL, et al. The multifaceted function of granzymes in sepsis: some facts and a lot to discover. Front Immunol. 2020;11:1054. doi:10.3389/fimmu.2020.01054
- Du C, Mendelson AA, Guan Q, et al. Hyperbranched polyglycerol is superior to glucose for long-term preservation of peritoneal membrane in a rat model of chronic peritoneal dialysis. J Transl Med. 2016;14(1):338. doi:10.1186/s12967-016-1098-z
- Wegener AM, Letourneur F, Hoeveler A, et al. The T cell receptor/CD3 complex is composed of at least two autonomous transduction modules. Cell. 1992;68(1):83–95. doi:10.1016/0092-8674(92)90208-T
- Liu J, Kumar S, Dolzhenko E, et al. Molecular characterization of the transition from acute to chronic kidney injury following ischemia/reperfusion. JCI Insight. 2017;2(18). doi:10.1172/jci.insight.94716
- Luan D, Dadhania DM, Ding R, et al. FOXP3 mRNA profile prognostic of acute T cell-mediated rejection and human kidney allograft survival. Transplantation. 2021;105(8):1825–1839. doi:10.1097/TP.0000000000003478
- Metkar SS, Menaa C, Pardo J, et al. Human and mouse granzyme A induce a proinflammatory cytokine response. Immunity. 2008;29(5):720–733. doi:10.1016/j.immuni.2008.08.014
- Joeckel LT, Wallich R, Martin P, et al. Mouse granzyme K has pro-inflammatory potential. Cell Death Differ. 2011;18(7):1112–1119. doi:10.1038/cdd.2011.5
- Sharma M, Merkulova Y, Raithatha S, et al. Extracellular granzyme K mediates endothelial activation through the cleavage of protease-activated receptor-1. Febs j. 2016;283(9):1734–1747. doi:10.1111/febs.13699
- Sower LE, Klimpel GR, Hanna W, et al. Extracellular activities of human granzymes. I. Granzyme A induces IL6 and IL8 production in fibroblast and epithelial cell lines. Cell Immunol. 1996;171(1):159–163. doi:10.1006/cimm.1996.0187
- Campbell RA, Franks Z, Bhatnagar A. Granzyme A in human platelets regulates the synthesis of proinflammatory cytokines by monocytes in aging. J Immunol. 2018;200(1):295–304. doi:10.4049/jimmunol.1700885
- Rchiad Z, Haidar M, Ansari HR, et al. Novel tumour suppressor roles for GZMA and RASGRP1 in Theileria annulata-transformed macrophages and human B lymphoma cells. Cell Microbiol. 2020;22(12):e13255. doi:10.1111/cmi.13255
- Dooley BJ, Verma A, Ding R, et al. Urinary cell transcriptome profiling and identification of ITM2A, SLAMF6, and IKZF3 as biomarkers of acute rejection in human kidney allografts. Transplant Direct. 2020;6(8):e588. doi:10.1097/TXD.0000000000001035
- Yeh YC, Lawal B, Hsiao M, Huang T-H, Huang C-YF. Identification of NSP3 (SH2D3C) as a prognostic biomarker of tumor progression and immune evasion for lung cancer and evaluation of organosulfur compounds from allium sativum L. as therapeutic candidates. Biomedicines. 2021;9(11):1582. doi:10.3390/biomedicines9111582
- Tagliabue M, Maffini F, Fumagalli C, et al. A role for the immune system in advanced laryngeal cancer. Sci Rep. 2020;10(1):18327. doi:10.1038/s41598-020-73747-0
- Yang P, Liu L, Sun L, et al. Immunological feature and transcriptional signaling of Ly6C monocyte subsets from transcriptome analysis in control and hyperhomocysteinemic mice. Front Immunol. 2021;12:632333.
- Park J, Guan Y, Sheng X, et al. Functional methylome analysis of human diabetic kidney disease. JCI Insight. 2019;4(11). doi:10.1172/jci.insight.128886
- Razzaque MS, Naito T, Taguchi T. Proto-oncogene Ets-1 and the kidney. Nephron. 2001;89(1):1–4. doi:10.1159/000046034
- Naito T, Razzaque MS, Nazneen A, et al. Renal expression of the Ets-1 proto-oncogene during progression of rat crescentic glomerulonephritis. J Am Soc Nephrol. 2000;11(12):2243–2255. doi:10.1681/ASN.V11122243
- Witasp A, Luttropp K, Qureshi AR, et al. Longitudinal genome-wide DNA methylation changes in response to kidney failure replacement therapy. Sci Rep. 2022;12(1):470. doi:10.1038/s41598-021-04321-5
- Juan C, Zhu Y, Chen Y. Knocking down ETS Proto-oncogene 1 (ETS1) alleviates the pyroptosis of renal tubular epithelial cells in patients with acute kidney injury by regulating the NLR family pyrin domain containing 3 (NLRP3) transcription. Bioengineered. 2022;13(5):12927–12940. doi:10.1080/21655979.2022.2079242
- Zamauskaite A, Yaqoob MM, Madrigal JA, et al. The frequency of Th2 type cells increases with time on peritoneal dialysis in patients with diabetic nephropathy. Eur Cytokine Netw. 1999;10(2):219–226.
- Marchant V, Tejera-Muñoz A, Marquez-Expósito L. IL-17A as a potential therapeutic target for patients on peritoneal dialysis. Biomolecules. 2020;10(10):1361. doi:10.3390/biom10101361
- Patel DD, Kuchroo VK. Th17 cell pathway in human immunity: lessons from genetics and therapeutic interventions. Immunity. 2015;43(6):1040–1051. doi:10.1016/j.immuni.2015.12.003
- Rodrigues-Díez R, Aroeira LS, Orejudo M, et al. IL-17A is a novel player in dialysis-induced peritoneal damage. Kidney Int. 2014;86(2):303–315. doi:10.1038/ki.2014.33
- Shen J, Zheng J, Saxena R, et al. Novel source of human hematopoietic stem cells from peritoneal dialysis effluents. Stem Cell Res. 2015;15(2):299–304. doi:10.1016/j.scr.2015.07.003