
Abstract
Background
Lung adenocarcinoma (LUAD) has high morbidity and mortality. Current studies indicate nucleoporin 107 (NUP107) is involved in the construction of nuclear pore complex, and NUP107 overexpression contributes to the growth and development in most types of cancers, but its effect in LUAD has not been elucidated.
Methods
Differences in NUP107 expression were investigated using the Cancer Genome Atlas (TCGA) and multiple Gene Expression Omnibus (GEO) data sets. Enrichment analysis were implemented to probe the NUP107 function. The association of NUP107 with the degree of immune cell infiltration was investigated by the TIMER database, single-sample gene set enrichment analysis (ssGSEA), and ESTIMATE. The association of NUP107 expression with tumor mutation burden (TMB), TP53, and immune checkpoint was analyzed. Single-cell RNA sequencing data were used to detect NUP107 expression in different cell clusters. Finally, we performed real-time quantitative polymerase chain reaction (RT-qPCR) and immunohistochemistry (IHC) to prove the difference of NUP107 expression.
Results
NUP107 was overexpressed in LUAD and mainly expressed in cancer stem cell (CSC). Overexpression of NUP107 in LUAD suggested a poorer prognosis. Functional enrichment analysis pointed out that NUP107 was mainly linked to the regulation of cell cycle. Both immune cell infiltration and TMB were found to be in connection with NUP107. Cases in the group with high NUP107 expression had poorer immune infiltration, but had higher expression of immune checkpoints, TMB, and proportion of TP53 mutations.
Conclusion
NUP107 is a sensitive diagnostic and prognostic factor for LUAD and may be involved in tumor progression through its effects on cell cycle and immune infiltration.
Introduction
Lung cancer is one of the most common types of cancer worldwide and the leading cause of cancer death.Citation1 The main category of lung cancer is non-small cell lung cancer, accounting for about 85%, and lung adenocarcinoma, as a kind of non-small cell lung cancer, is the most frequently occurring pathological type.Citation2,Citation3 High incidence and low survival rate are important features of lung adenocarcinoma. Although immunological and targeted therapy appears to promote the treatment outcome, it is still not ideal.Citation4
NUP107 not only comes into play in the development of many types of cancer, it is also involved in the construction of nuclear pore complex.Citation5,Citation6 Regulating nucleocytoplasmic transport and chromatin organization is a crucial role of the nuclear pore complex, which may control the biological properties of cancer and influence the therapeutic effect of cancer.Citation7
Tumor immunotherapy and immune infiltration are the focus of cancer research and have wide clinical application in LUAD. However, NUP107 has not been systematically explored in relation to immune infiltration and immunotherapy in LUAD.
We obtained the TCGA data set of LUAD and several GEO data sets, and used R language for bioinformatics analysis. We investigated differential expression of NUP107 in various cancers and in different cell clusters. Functional enrichment analysis was performed using differential expression genes (DEGs) to explore NUP107 functions. The connection between NUP107 and immune infiltration, tumor mutation burden, and immune checkpoint was studied. Finally, RT-qPCR and IHC was conducted to verify NUP107 expression in LUAD and adjacent tissues.
Materials and Methods
Data Acquisition
LUAD RNA data in TCGA database were obtained from UCSC Xena (xenabrowser.net), including 510 tumor tissue and 58 normal tissue samples. Corresponding survival data (overall survival time, survival status) was also downloaded. GSE10072 (58 LUAD cases and 49 normal cases), GSE27262 (25 LUAD cases and 25 normal cases), GSE30219 (85 LUAD cases and 14 normal cases), GSE171145, and GSE198291 were obtained from GEO database (https://www.ncbi.nlm.nih.gov/geo/). Fasta format sequences of all mature miRNA sequences and microRNA (miRNA) data of LUAD were downloaded from miRbase (https://www.mirbase.org/) and TCGA respectively. Data had been converted by log2(x+1). Pan-Cancer dataset was obtained from UCSC Xena, and performed log2(x+1) transformations for each expression value. Genomic Data Commons (https://portal.gdc.cancer.gov/) was used to acquire simple nucleotide variation data for LUAD from TCGA.
Differential Expression of NUP107 and Its Diagnostic Value in LUAD
The R package UCSCXenaShiny was applied to calculate and visualize differential expression of NUP107 between tumor and normal samples in each cancer. Data from TCGA, GSE10072, GSE27262, and GSE30219 datasets were devoted to verification of NUP107 expression differences between LUAD and normal samples. In order to assess the value of NUP107 in diagnosis, the receiver operator characteristic (ROC) curve was established by R package ROCR and the area under the ROC curve was calculated.
Analysis of the Prognostic Value of NUP107 in LUAD
LUAD in TCGA and GSE30219 database were split into two groups according to NUP107 expression (cutoff value was the quartile). The value of NUP107 in prognosis was assessed using survival analysis performed with R package survival and survminer. Kaplan–Meier (KM) survival analyses of overall survival time was performed to draw the survival curve. The prognostic value of NUP107 in LUAD was validated using the GEPIA database (http://gepia.cancer-pku.cn/). Independent factors of LUAD were determined by COX analysis.
Identification of Differential Expression Genes (DEGs) and Functional Enrichment Analysis of NUP107
To identify DEGs of NUP107, high and low NUP107 expression tumor cases in TCGA dataset were performed with R package limma. The absolute value of log 2 fold change ≥1.0 was set as the threshold for filtering out DEGs. The visualization of DEGs’ volcano map was realized through R package ggpubr and ggthemes. In order to probe the NUP107 function in LUAD, GO, KEGG, and GSEA were respectively deployed on DEGs by R package clusterProfiler.
Identification of Hub Genes by WGCNA and Protein–Protein Interaction (PPI) Network
Weighted gene co-expression networkCitation8 was constructed to pick out the modules related to clinical phenotypes using R Package WGCNA. DEGs were classified into modules according to their characteristics, and a heat map of the connection between clinical phenotypes and modules was drawn. Key modules were defined as those most relevant to clinical phenotypes. On the basis of the setting of gene significance (GS) and module membership (MM), 14 genes were selected from key modules to construct PPI network (highest confidence). Finally, 5 genes interact closely and are defined as hub genes.
Expression Difference and Survival Analysis of Hub Genes
Data from the TCGA dataset were used for differential expression analysis and survival analysis of hub genes, and the ability of hub genes to distinguish LUAD was evaluated using ROC curves. Immunohistochemical images of hub genes were obtained from the Human Protein Atlas (HPA) (www.proteinatlas.org) to demonstrate discrepancies in protein expression level. Finally, KM survival analysis of hub genes was performed.
Construction of ceRNA Network of NUP107
ENCORI (https://starbase.sysu.edu.cn/) was used to forecast related miRNAs and long non-coding RNAs (lncRNAs). According to the ceRNA theory, predicted miRNAs inversely correlated expressed with NUP107 (Spearman coefficient r < −0.2, p < 0.05) were considered miRNA targeted NUP107. Core miRNAs of NUP107 are differentially expressed in tumor and normal cases and their expression can affect the prognosis of tumor cases. According to the ceRNA theory, predicted lncRNAs inversely correlated expressed with miRNA (Spearman coefficient r < −0.2, p < 0.05) were considered lncRNA targeted miRNA. Core lncRNAs also meet the conditions that Their expression differ between tumor and normal cases and affect the prognosis of tumor cases.
Tumor Immunology Analysis
The Tumor Immune Estimation Resource (TIMER) (https://cistrome.shinyapps.io/timer/), a network analysis tool that provides a multi-analysis of tumor immune interactions,Citation9 was applied to detect the connection between NUP107 copy number variation and immune infiltration levels. The ssGSEA quantifies the infiltration levels of 28 immune cells in tumor cases by R package GSVA. ESTIMATECitation10 can infer the stromal and immune cell components of tumor cases from the signatures of gene expression, and finally get the tumor purity, ESTIMATE score, immune score, and stromal score of all LUAD cases. According to NUP107 expression, tumor cases were split into high and low expression groups (cutoff value was the quartile), and differences in immune infiltration were analyzed.
NUP107 Expression in Relation to TMB and Immune Checkpoints
Oncoplots of NUP107 in different expression groups were drawn and visualized using R package maftools. The TMB and immune checkpoints expression in tumor cases was analyzed for differences between the two groups.
Comparison of NUP107 Expression in Different Cell Clusters
GSE171145 and GSE198291 were used to analyze NUP107 expression in different cell clusters. R package Seurat was used to perform quality control (QC) procedure. Reduction of dimensionality and clustering were implemented through uniform manifold approximation and projection (UMAP). The clusters were manually annotated using marker genes through CellMarker database (http://biocc.hrbmu.edu.cn/CellMarker/). Finally, NUP107 expression in different clusters was compared.
Real-Time Quantitative Polymerase Chain Reaction (RT-qPCR)
After informed consent was obtained from the Medical Ethics Committee of First Affiliated Hospital of Guangxi Medical University and from all patients participating in the study, tumors and adjacent tissues from 21 LUAD patients were gathered from the First Affiliated Hospital of Guangxi Medical University. We extract total RNA from these tissues and reverse transcribe total RNA into cDNA. Finally, RT-qPCR was implemented to analyze NUP107 expression. The primer sequence is as follows: NUP107-F, 5′-TCATTGCACCTGACCTGATCC-3′; NUP107-R, 5′-TCCAACAGACAGCATCATCGG-3′.
Immunohistochemistry (IHC) Staining
Paraffin-embedded specimens of 20 LUAD patients, including cancerous and adjacent tissues, were gathered from the First Affiliated Hospital of Guangxi Medical University. The experiment was approved by the Medical Ethics Committee of First Affiliated Hospital of Guangxi Medical University and informed consent was obtained from all patients. Immunohistochemical staining was performed on each tissue according to the instructions of the general two-step kit. The tissue sections were incubated with the anti NUP107 (1:400) overnight at 4°C. They were then incubated for 30 minutes with the enhanced enzyme labeled goat anti mouse/rabbit IgG polymer. DAB chromogenic kit (ZLI-9018, Origin, Beijing) and hematoxylin were used for color development and counterstain of tissue sections. The IHC score of each tissue was assessed independently by two pathologists.
Statistical Analysis
Statistics were performed by R, version 4.2.0. Two-group differential expression analysis was performed by t-test. The KM survival analysis was implemented using Log rank test. The correlation analysis employed Spearman correlation to evaluate. The threshold of significant difference was set as p < 0.05 (ns, No significance; *p < 0.05; **p < 0.01; ***p < 0.001).
Results
Diagnostic Value of NUP107 in LUAD
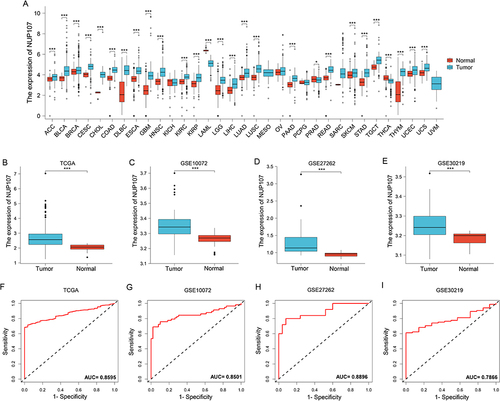
Pan-cancer analysis results from the TCGA dataset show that NUP107 was overexpressed in tumor tissue than in normal tissue in multiple types of cancer (). Analysis of TCGA dataset and 3 GEO validation datasets showed that NUP107 was overexpressed in LUAD (). The area under the curve (AUC) from the TCGA dataset was 0.8595 (), and the results of the GEO validation datasets were 0.8501, 0.8896, and 0.7866 (). ROC curve results indicate that NUP107 has good positive diagnostic value for LUAD.
Figure 1 NUP107 is overexpressed in LUAD and is a meaningful diagnostic factor. (A) Differential expression of NUP107 in tumor and normal groups in multiple cancers in the TCGA database. (B-E) Comparison of NUP107 expression levels between tumor and normal groups in TCGA dataset and 3 GEO validation datasets (GSE10072, GSE27262, GSE30219). (F-I) Diagnostic ROC curve of NUP107 in TCGA dataset and 3 GEO validation datasets (GSE10072, GSE27262, GSE30219). *p < 0.05; ***p < 0.001.
Prognostic Value of NUP107 in LUAD
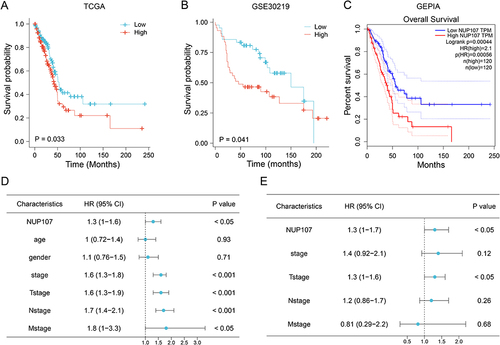
Results from KM survival analyses from the TCGA (), GSE30219 () datasets, and GEPIA database () indicated that NUP107 overexpression in LUAD contributed to poor prognosis. HR of NUP107 was 1.3 in both COX univariate analysis () and COX multivariate analysis (), suggesting that NUP107 was an independent prognostic factor indicating poor survival in LUAD.
Figure 2 Overexpression of NUP107 is related to poor prognosis. (A and B) Kaplan-Meier (KM) survival analysis of NUP107 in TCGA dataset and GSE30219 dataset. (C) KM survival curve of NUP107 from the GEPIA database. (D) COX univariate analysis of clinical characteristics in LUAD. (E) COX multivariate analysis of meaningful clinical characteristics.
Identification of DEGs and Functional Enrichment Analysis of NUP107
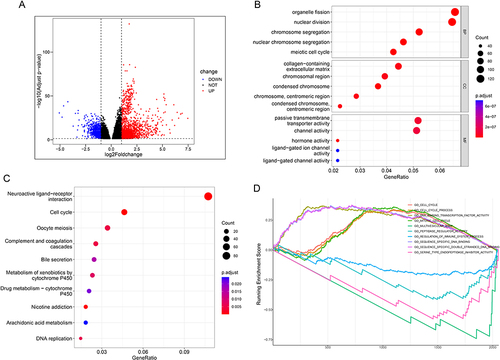
A total of 2211 DEGs were obtained, including 1514 up-regulated DEGs and 697 down-regulated DEGs (), and all were used in enrichment analysis. Biological Process (BP) in Gene Ontology (GO) analysis shows five terms, all related to the cell cycle, including “organelle fission”, “nuclear division”, “chromosome segregation”, “nuclear chromosome segregation”, and “meiotic cell cycle” (). The DEGs in Kyoto Encyclopedia of Genes, Genomes (KEGG) analysis were concentrated in items related to cell cycle and metabolism, including “Neuroactive ligand−receptor interaction”, “Cell cycle”, “Oocyte meiosis”, “Complement and coagulation cascades”, “Bile secretion”, “Metabolism of xenobiotics by cytochrome P450”, “Drug metabolism − cytochrome P450”, “Nicotine addiction”, “Arachidonic acid metabolism”, and “DNA replication” (). With Gene Set Enrichment Analysis (GSEA) enrichment analysis, DEGs were concentrated in these terms, including “GO_CELL_CYCLE”, “GO_CELL_CYCLE_PROCESS”, “GO_DNA_BINDING_TRANSCRIPTION_FACTOR_ACTIVITY”, “GO_MITOTIC_CELL_CYCLE”, “GO_MULTIVESICULAR_BODY”, “GO_PEPTIDASE_REGULATOR_ACTIVITY”, “GO_REGULATION_OF_IMMUNE_SYSTEM_PROCESS”, “GO_SEQUENCE_SPECIFIC_DNA_BINDING”, “GO_SEQUENCE_SPECIFIC_DOUBLE_STRANDED_DNA_BINDING”, and “GO_SERINE_TYPE_ENDOPEPTIDASE_INHIBITOR_ACTIVITY”, which are principally correlative with cell cycle (). GO, KEGG, and GSEA analysis indicated that NUP107 expression promotes cell division.
Figure 3 DEGs and function analysis of NUP107. (A) A volcanic map composed of meaningful DEGs in the TCGA dataset. (B) The dot plot displayed the outcomes of GO analysis. (C) The dot plot displayed the outcomes of KEGG analysis. The degree of gene enrichment and significance in the dot plot were indicated by dot size and color, respectively. (D) Demonstration of the outcomes of GSEA analysis.
Screening of Hub Genes by WGCNA and PPI Network
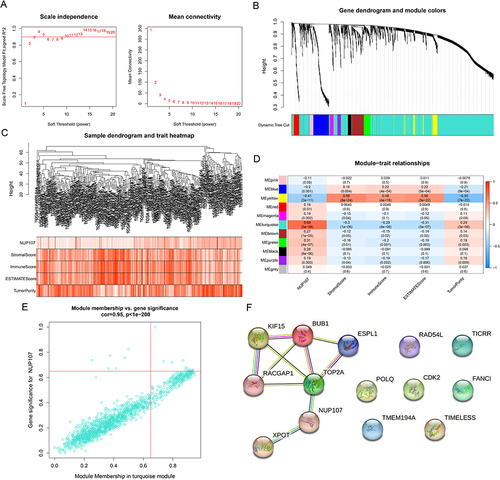
The WGCNA analysis of 2211 DEGs was carried out, and the DEGs were clustered into 11 modules by using the average link level clustering method (). According to correlation analysis between modules and traits, turquoise module had the maximum positive correlation coefficient with NUP107 (R = 0.68, P = 5e-36) and negative correlation coefficient with immunity (R = −0.29, P = 4e-06) respectively, so it was considered as a key module (). By setting module membership and gene significance both greater than 0.65, 14 genes (NUP107, CDK2, XPOT, TMEM194A, TIMELESS, TOP2A, ESPL1, FANCI, POLQ, RAD54L, BUB1, KIF15, RACGAP1, TICRR) in turquoise module were screened out (). PPI network was constructed with 14 genes obtained from WGCNA, and 5 closely interacting genes were considered as hub genes (TOP2A, ESPL1, BUB1, KIF15, RACGAP1) ().
Figure 4 Screening of hub genes in LUAD. (A) Based on different soft thresholds (powers), the scale-free fitting index was calculated, and the analysis of mean connectivity was carried out. (B) Gene dendrogram of LUAD cases for clustering. (C) The composite diagram showed the clustering of tumor cases and the relevance between LUAD samples and clinical parameters. (D) Heatmap showing correlations between modules and clinical phenotypes. (E) Scatter plot showing genes in the key module (turquoise module). (F) PPI networks of genes with MM and GS greater than 0.65 in turquoise modules.
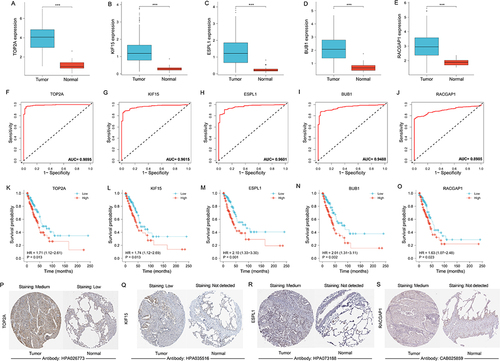
Further Analysis of Hub Genes
Hub genes in tumor tissues was overexpressed in tumor cases (). Diagnostic ROC curve was constructed to assess the value of TOP2A, KIF15, ESPL1, BUB1 and RACGAP1 in terms of diagnosis for LUAD, and their AUC were 0.9895, 0.9615, 0.9601, 0.9488 and 0.8985, respectively (), indicating that hub genes have good diagnostic value for LUAD. Hub genes contributed to a poor outcome in terms of prognosis in LUAD and were considered as risk factors (HR > 1) (). Compared with normal tissues, the degree of immunohistochemical staining in tumor tissues was deeper, confirming the overexpression of TOP2A, ESPL1, KIF15, and RACGAP1 in LUAD ().
Figure 5 Value of hub gene in diagnosis and prognosis of LUAD. (A–E) Differential expression of hub genes between tumor and normal groups. (F-J) Diagnostic ROC curve of hub genes identifying LUAD from normal tissue. (K–O) KM curves from survival analysis of hub genes. The comparisons were performed between two groups with different expression. (P–S) Immunohistochemical images of TOP2A, ESPL1, KIF15, RACGAP1 from the HPA database. The contrast was made by immunohistochemical staining between LUAD and lung tissue. ***p < 0.001.
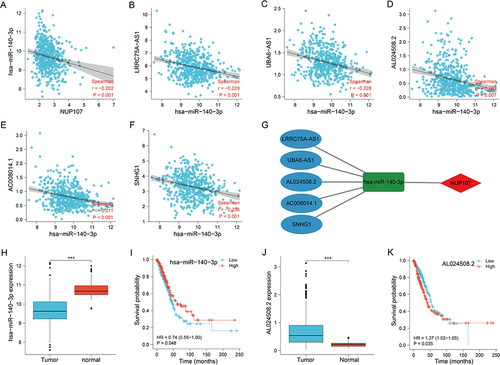
Construction of ceRNA Network Associated with NUP107
hsa-miR-140-3p was the miRNA predicted by NUP107, and there was a negative correlation between them (). Five predicted lncRNAs had inverse correlation with the hsa-miR-140-3p expression (). The ceRNA network was established to demonstrate the connection between mRNA, miRNA, and lncRNA (). hsa-miR-140-3p was overexpressed in lung tissue (), and its overexpression contributed to good prognosis of LUAD samples (). Among the five predicted lncRNAs, AL024508.2 was overexpressed in tumor tissues (), and its overexpression contributed to poor prognosis in tumor cases (). Therefore, AL024508.2 was identified as a core lncRNA due to its differential expression and correlation with prognosis.
Figure 6 Exploration of upstream genes for NUP107 in LUAD. (A) Correlation analysis of NUP107 with predicted miRNA (hsa-miR-140-3p). (B–F) Correlation analysis of hsa-miR-140-3p with 5 predicted lncRNAs (LRRC75A−AS1, UBA6−AS1, AL024508.2, AC008014.1, SNHG1). (G) CeRNA network of NUP107. (H) Comparison of hsa-miR-140-3p expression between tumor and normal groups. (I) KM survival analysis of hsa-miR-140-3p in LUAD cases. (J) Comparison of AL024508.2 expression levels between tumor and normal groups. (K) KM survival analysis of AL024508.2 in LUAD cases. ***p < 0.001.
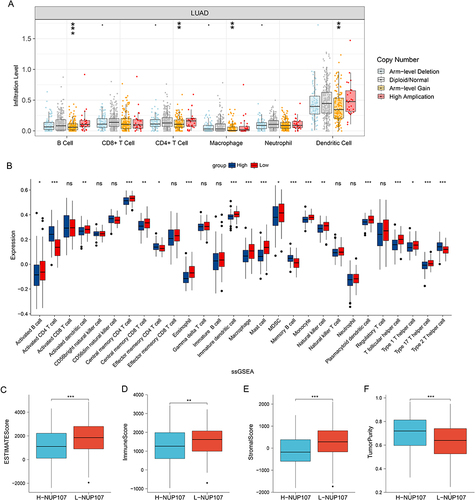
Comparison of Immune Infiltrates Associated with NUP107 Expression in LUAD
The analysis results from the TIMER database indicated that the infiltration of B cells, CD4+ T cell, Macrophage and dendritic cell decreased significantly after the arm-level gain of NUP107 (). The results of ssGSEA indicated that 15 subtypes of immune cell in high NUP107 expression group was low expressed, including Activated B cell, Activated dendritic cell, Central memory CD4 T cell, Central memory CD8 T cell, Eosinophil, Immature dendritic cell, Macrophage, Mast cell, MDSC, Monocyte, Natural killer cell, Plasmacytoid dendritic cell, T follicular helper cell, Type 1 T helper cell, and Type 17 T helper cell; 4 subtypes of immune cells (Activated CD4 T cell, Effector memory CD4 T cell, Memory B cell, Type 2 T helper cell) were highly expressed in NUP107 high expression group (). The high NUP107 expression group showed lower ESTIMATE, immune, and Stromal score, and higher tumor purity than low NUP107 expression group ().
Figure 7 Immune relation analysis in LUAD. (A) Comparison of immune infiltration levels between different CNV types of NUP107 in LUAD. (B) Differences in the expression of immune cells in LUAD cases with different NUP107 expression. (C–F) Comparison of the ESTIMATE score, immune score, stromal score, and tumor purity between two groups with different NUP107 expression. ns, No significance; *p < 0.05; **p < 0.01; ***p < 0.001.
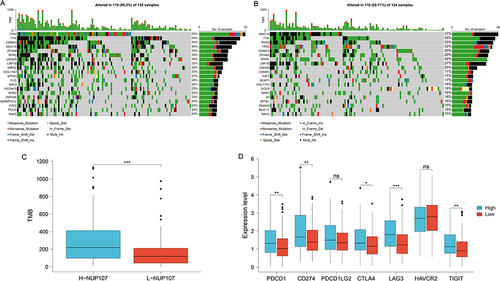
Differences in Gene Mutation and Comparison of Immune Checkpoint Expression
The effect of immunotherapy on tumors can be influenced by immune checkpoints and TMB. The gene mutation maps of different NUP107 expression groups were shown in the Figure, and the proportion of TP53 mutations was higher in high NUP107 expression group ( and ). NUP107 high expression group showed higher TMB (), and had higher immune checkpoint (PDCD1, CD274, CTLA4, LAG3, TIGIT) expression ().
Figure 8 Exploration of the relationship between immunotherapy and NUP107 through TMB and immune checkpoint. (A) The gene mutation maps of high NUP107 expression group in LUAD. (B) The gene mutation maps of low NUP107 expression group. (C) Comparison of TMB between different NUP107 expression groups. (D) Comparison of immune checkpoint expression between different NUP107 expression groups. *p < 0.05; **p < 0.01; ***p < 0.001.
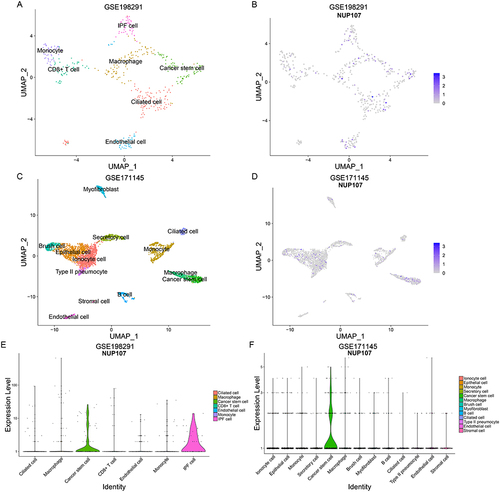
Comparison of NUP107 Expression in Different Cell Clusters
In the GSE198291 dataset, seven types of cell clusters were obtained after reduction of dimensionality and clustering, including ciliated cell, macrophage, cancer stem cell (CSC), CD8+ T cell, endothelial cell, monocyte, and idiopathic pulmonary fibrosis (IPF) cell (), and NUP107 was mainly expressed in cancer stem cell and IPF cell ( and ). Ionocyte cell, epithelial cell, monocyte, secretory cell, cancer stem cell, macrophage, brush cell, myofibroblast, B cell, ciliated cell, type II pneumocyte, endothelial cell, and stromal cell were obtained by reduction of dimensionality and clustering of GSE171145 dataset (), and analysis again revealed that NUP107 was mainly expressed in tumor stem cell ( and ).
Figure 9 Identification of cell types and comparison of NUP107 expression. (A) UMAP map of dimensionality reduction and cell clustering in the GSE198291 dataset. (B) UMAP map of NUP107 expression in various cell clusters from the GSE198291 dataset. (C) UMAP map of dimensionality reduction and cell clustering in the GSE171145 dataset. (D) UMAP map of NUP107 expression in various cell clusters from the GSE171145 dataset. (E and F) Differences in NUP107 expression among different cell clusters in the GSE198291 and GSE171145 datasets.
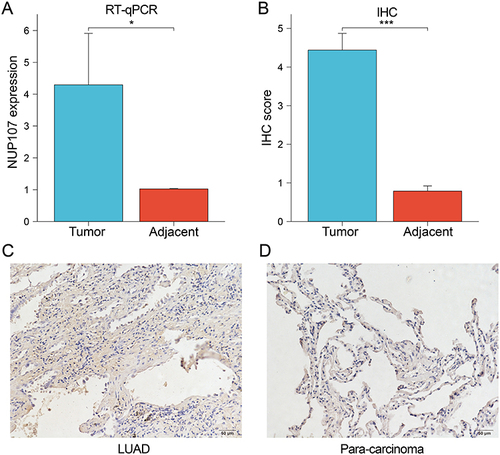
Validation of Differences in NUP107 Expression Between LUAD and Adjacent Lung Tissues by RT-qPCR and IHC
RT-qPCR was performed on tumor and adjacent tissues from 21 LUAD patients to detect NUP107 expression levels, and it was concluded that NUP107 was overexpressed in tumor tissues (). The IHC score of tumor tissue was significantly higher () and the degree of immunohistochemical staining was deeper ( and ) than that of adjacent lung tissue, indicating that the protein level of NUP107 is higher in LUAD tissue.
Figure 10 (A) The expression levels of NUP107 were compared in the tumor versus the adjacent lung tissues by RT-qPCR. (B) Comparison of IHC scores between LUAD tissue and adjacent lung tissue. (C and D) Immunohistochemical images of tumor tissue and adjacent lung tissue from a LUAD patient. *p < 0.05; ***p < 0.001.
Discussion
Overexpression of NUP107 has been reported in cervical cancer, gastric cancer, and colon cancer and participates in the onset and development of tumors.Citation5,Citation11,Citation12 For example, in cervical cancer, NUP107 contributes to cancer cell survival, and overexpression of NUP107 makes cancer cells more resistant to oxidative damage.Citation5 In this study, results from pan-cancer analysis indicated that NUP107 was overexpressed in most types of cancer. We further analyzed NUP107 expression in LUAD by using multiple datasets and detected that NUP107 was up-regulated in tumor tissues and mainly expressed in CSCs. LUAD can be distinguished from normal tissues by NUP107 expression levels according to ROC curve results, suggesting that NUP107 may be a novel marker in terms of diagnostics for LUAD. Survival analysis indicated that the prognosis tended to be poor in patients with higher NUP107 expression, revealing that NUP107 has an important prognostic value.
We identified DEGs associated with NUP107 expression in LUAD and performed functional enrichment analyses to probe potential functions of NUP107. The cell cycle was a function in which GO, KEGG, and GSEA are enriched. The results of functional enrichment indicate that NUP107 is closely related to cell cycle. Abnormal cell cycle is one of the basic mechanisms of cancer onset and development, and provides more targets for cancer treatment.Citation13 Recently, upregulation of PRR11 has been reported to be associated with cell cycle pathways, and its overexpression promotes cancer progression in LUAD and has been identified as a prognostic biomarker of LUAD.Citation14 In conclusion, it is suggested that NUP107 may promote cancer development by regulating the cell cycle. NUP107 was closely linked to cytochrome P450 and arachidonic acid metabolism in KEGG analysis. Recent studies have shown that CYP27A1, a member of the cytochrome P450 oxidase family, is closely related to the prognosis of LUAD.Citation15 It has been reported that cytochrome P450 mediates the metabolism of carcinogens in lung cancer and is an significant factor in carcinogenesis.Citation16 Arachidonic acid, which binds to cancer membranes, can be metabolized into eicosanoids, which promotes cancer progression and invasion.Citation17 The GSEA enrichment analysis indicated that NUP107 may participate in regulation of immune system and transcription factor activity. It has been found that some genes acting as transcriptional activators, such as CHURC1, can bind to transcription factors to affect the development of LUAD.Citation18 In summary of the above functional enrichment analysis, NUP107 took on important functions in the onset and development of LUAD.
We constructed WGCNA and PPI network to explore the downstream genes for NUP107. Downstream hub genes, including TOP2A, ESPL1, BUB1, KIF15, and RACGAP1, were identified and further analyzed. Each hub gene was overexpressed in tumor tissue, and their overexpression in tumor samples suggested a poor prognosis. The value of 5 hub genes in diagnosis and prognosis of LUAD was excellent. According to existing reports, TOP2A is overexpressed in LUAD and contributes to the migration and invasion of cancer cells;Citation19 ESPL1 is up-regulated in LUAD cells and promotes cancer cell invasion and migration;Citation20 BUB1 is overexpressed in LUAD and may act on the cell cycle to affect tumor progression;Citation21 KIF15 expression was detected at higher levels in lung adenocarcinoma than in normal lung tissue and is critical in the growth of LUAD cells;Citation22 RACGAP1 expression in LUAD exhibits higher levels than in normal tissues and is concerned in tumorigenesis.Citation23
Non-coding RNAs, including miRNAs and lncRNAs, participate in competitive regulation and are part of the ceRNA network, and abnormal expression of any component in the network may cause the onset and development of cancer.Citation24 In the ceRNA network, the occurrence and progression of cancer can be regulated in the following ways: miRNA can specifically bind to downstream mRNA to reduce the protein production in the process of gene translation, while lncRNA can competitively bind to miRNA, reducing the binding of downstream mRNA to miRNA and restoring the activity of mRNA.Citation25 hsa-miR-140-3p was predicted as the upstream miRNA of NUP107, and it was underexpressed in tumor tissues, and its overexpression in tumor cases was conducive to good prognosis. hsa-miR-140-3p has been proved to be down-regulated in lung squamous cell carcinoma and has important diagnostic value.Citation26 There were five upstream lncRNAs predicted by hsa-miR-140-3p, and AL024508.2 was regarded as the core lncRNAs depending on its significance in differential analysis and survival analysis. Overall, further experiments are needed to confirm our hypothesis.
The tumor microenvironment interacts with onset and development of tumor, and immune cells are also involved as one of the cell types of the microenvironment.Citation27 In the analysis of the relevance between NUP107 and immune infiltration, it was found that the infiltration of B cells, CD4+ T cells, macrophages, and dendritic cells were declined in tumor samples with arm-level gain of NUP107. In ssGSEA analysis, immune cells showed low infiltration in NUP107 overexpressed tumor samples. The immune cells mentioned above included B cell, dendritic cell, CD4 T cell, CD8 T cell, eosinophil, macrophage, mast cell, MDSC, monocyte, natural killer cell, T follicular helper cell, Type 1 T helper cell (Th1), and Type 17 T helper cell (Th17). B cells are antigen-presenting cells that differentiate into plasma cells that produce antitumor antibodies and promote T cell responses to enhance antitumor effects.Citation28 Dendritic cells can participate in anti-tumor t cell immunity by infiltrating tumors and playing an antigen-presenting function.Citation29 CD4 T cells are necessary to maintain the antitumor properties of CD8 T cells, and can play an indirect tumor suppressor role by promoting the antineoplastic activity of other effector cells, as well as a direct antitumor role by producing tumor necrosis factor-α (TNF-α) and interferon-γ (IFN-γ).Citation30 CD8 T cells play an indispensable role as the main force of antineoplastic immune cells in the microenvironment.Citation31 Whether eosinophils have an antitumor or tumor-promoting role in cancer is still debated and may be related to a variety of factors, including different cancer types and unexplored subtypes of eosinophils.Citation32,Citation33 The role of macrophages in cancer is mainly related to the subtypes of cell differentiation, in which M2 cells play a pro-tumor role while M1 cells do the opposite.Citation34 Function of mast cell in tumors is related to cancer type and plays an antitumor role in lung cancer.Citation35 There is a positive correlation between mast cell infiltration and clinical outcome in early LUAD.Citation36 T follicular helper cells can maintain the antineoplastic function of CD8 T cells and enhance cytokine production and cytotoxic function, which is of great significance in anti-tumor.Citation37 Th1, Type 2 T helper cell (Th2), and Th17 are three subtypes of CD4+ T helper cells; The onset and development of lung cancer may be related to the imbalance between Th1 and Th2, and Th1 has antitumor effect; Th17 can play an indirect antitumor role in induction of anti-tumor immunity.Citation38 In the ESTIMATE analysis, NUP107 overexpression group displayed higher tumor purity and lower ESTIMATE score, immune score, stromal score. In conclusion, there is a relationship between NUP107 and immune infiltration in LUAD, and immune function is poorer in the high NUP107 expression group.
Receptor–ligand interaction is the mechanism by which many immune checkpoints cause immune escape, and blocking this mechanism can enhance the anti-tumor effects.Citation39 The application of immune checkpoint inhibitors (ICIs) is an immunological therapy targeting immune checkpoints that has shown positive improvement in survival and prognosis of patients with lung cancer.Citation40 CD274 (PD-L1) is a ligand of PDCD1 (PD-1), and their binding can cause the suppression of T-cell-mediated immune response, resulting in immune escape of tumor cells.Citation41 The therapeutic effect of immune checkpoint inhibitors targeting PD-1, PD-L1, and CTLA4 has been widely reported, and their combination therapy can improve the effectiveness of treatment.Citation41,Citation42 LAG3 and TIGIT, as the next generation targets of immunotherapy, provide new therapeutic strategies for patients who do not respond to anti-PD1 immunotherapy.Citation43 Immunotherapy targeting LAG3 or TIGIT, in combination with other immune checkpoint inhibitors, demonstrated a more powerful antitumor effect than monotherapy.Citation44–46 Higher expressions of the above immune checkpoints were detected in the high NUP107 expression group. Through the analysis of mutant landscapes, significant differences were reflected in the two groups with different NUP107 expression. It was found that the TMB was higher in the high NUP107 expression group and there were more gene mutations, especially TP53. The connection between TMB and ICI response has been demonstrated in multiple cancers, including lung cancer, and patients with tumors with high TMB may respond better to immunotherapy.Citation47 We can infer from these results that immunotherapy may be more effective in patients with high NUP107 expression.
However, there are some limitations to the results in this study that should be acknowledged. First of all, the sample size from the public database is not large enough and may cause inevitable errors. Secondly, molecular functions are explored based on bioinformatics analysis, which lacks the verification of cell experiments. Finally, a direct mechanism of NUP107 with antitumor immunity has not been demonstrated and may need to be elucidated in animal experiments.
Conclusions
NUP107 is a sensitive diagnostic and prognostic factor for LUAD, and it has potential as a therapeutic target for LUAD. In addition, NUP107 expression has connections with cell cycle, immune infiltration, and TP53 mutations, possibly contributing to tumor progression by influencing these factors.
Ethics Statement
The experimental part of this study was approved by the Medical Ethics Committee of First Affiliated Hospital of Guangxi Medical University and informed consent was obtained from all patients who participated in this study. All methods were carried out in accordance with the Helsinki declaration guidelines and regulations.
Author Contributions
All authors made a significant contribution to the work reported, whether that is in the conception, study design, execution, acquisition of data, analysis and interpretation, or in all these areas; took part in drafting, revising or critically reviewing the article; gave final approval of the version to be published; have agreed on the journal to which the article has been submitted; and agree to be accountable for all aspects of the work.
Disclosure
The authors declare that the research was conducted in the absence of any commercial or financial relationships that could be construed as a potential conflict of interest.
Acknowledgments
We would like to thank the public database (TCGA, GEO, TIMER, ENCORI, CellMaker, and HPA databases) and everyone involved in this study.
Data Sharing Statement
The original data for this paper can be found in the UCSC Xena (xenabrowser.net), GEO database (https://www.ncbi.nlm.nih.gov/geo/), Genomic Data Commons (https://portal.gdc.cancer.gov/), miRbase (https://www.mirbase.org/). Relevant data for this study are also available upon request from the corresponding author.
Additional information
Funding
References
- Sung H, Ferlay J, Siegel RL, et al. Global cancer statistics 2020: GLOBOCAN estimates of incidence and mortality worldwide for 36 cancers in 185 countries. CA Cancer J Clin. 2021;71(3):209–249. doi:10.3322/caac.21660
- Goldstraw P, Ball D, Jett JR, et al. Non-small-cell lung cancer. Lancet. 2011;378(9804):1727–1740. doi:10.1016/S0140-6736(10)62101-0
- Travis WD, Brambilla E, Nicholson AG, et al. The 2015 World Health Organization classification of lung tumors: impact of genetic, clinical and radiologic advances since the 2004 classification. J Thorac Oncol. 2015;10(9):1243–1260. doi:10.1097/JTO.0000000000000630
- Macheleidt IF, Dalvi PS, Lim SY, et al. Preclinical studies reveal that LSD1 inhibition results in tumor growth arrest in lung adenocarcinoma independently of driver mutations. Mol Oncol. 2018;12(11):1965–1979. doi:10.1002/1878-0261.12382
- Shi R, Xu L, Huang L, Cheng JX. Nucleoporin 107 promotes the survival of tumor cells in cervical cancers. Gynecol Obstet Invest. 2020;85(1):41–52. doi:10.1159/000502788
- Nong JS, Zhou X, Liu JQ, et al. Nucleoporin 107 is a prognostic biomarker in hepatocellular carcinoma associated with immune infiltration. Cancer Med. 2023;12(9):10990–11009. doi:10.1002/cam4.5807
- Alanee S, Delfino K, Wilber A, Robinson K, Brard L, Semaan A. Single nucleotide variant in nucleoporin 107 may be predictive of sensitivity to chemotherapy in patients with ovarian cancer. Pharmacogenet Genomics. 2017;27(7):264–269. doi:10.1097/FPC.0000000000000288
- Langfelder P, Horvath S. WGCNA: an R package for weighted correlation network analysis. BMC Bioinf. 2008;9(1):559. doi:10.1186/1471-2105-9-559
- Li T, Fan J, Wang B, et al. TIMER: a web server for comprehensive analysis of tumor-infiltrating immune cells. Cancer Res. 2017;77(21):e108–e110. doi:10.1158/0008-5472.CAN-17-0307
- Yoshihara K, Shahmoradgoli M, Martínez E, et al. Inferring tumour purity and stromal and immune cell admixture from expression data. Nat Commun. 2013;4(1):2612. doi:10.1038/ncomms3612
- Chen D, Wang M, Jiang X, Xiong Z. Comprehensive analysis of ZFPM2-AS1 prognostic value, immune microenvironment, drug sensitivity, and co-expression network: from gastric adenocarcinoma to pan-cancers. Discov Oncol. 2022;13(1):24. doi:10.1007/s12672-022-00487-0
- Liu G, Wu X, Chen J. Identification and validation of a glycolysis-related gene signature for depicting clinical characteristics and its relationship with tumor immunity in patients with colon cancer. Aging. 2022;14(21):8700–8718. doi:10.18632/aging.204226
- Liu J, Peng Y, Wei W. Cell cycle on the crossroad of tumorigenesis and cancer therapy. Trends Cell Biol. 2022;32(1):30–44. doi:10.1016/j.tcb.2021.07.001
- Wang WH, Ma CG, Cui YS, et al. Role of prognostic marker PRR11 in immune infiltration for facilitating lung adenocarcinoma progression. Biomed Environ Sci. 2023;36(9):862–868. doi:10.3967/bes2023.111
- Yin Y, He M, Huang Y, Xie X. Transcriptomic analysis identifies CYP27A1 as a diagnostic marker for the prognosis and immunity in lung adenocarcinoma. BMC Immunol. 2023;24(1):37. doi:10.1186/s12865-023-00572-1
- Anttila S, Raunio H, Hakkola J. Cytochrome P450-mediated pulmonary metabolism of carcinogens: regulation and cross-talk in lung carcinogenesis. Am J Respir Cell Mol Biol. 2011;44(5):583–590. doi:10.1165/rcmb.2010-0189RT
- McCarty MF, DiNicolantonio JJ. Minimizing membrane arachidonic acid content as a strategy for controlling cancer: a review. Nutr Cancer. 2018;70(6):840–850. doi:10.1080/01635581.2018.1470657
- Qiu A, Xu H, Mao L, et al. A novel apaQTL-SNP for the modification of non-small-cell lung cancer susceptibility across histological subtypes. Cancers. 2022;14(21):5309. doi:10.3390/cancers14215309
- Kou F, Sun H, Wu L, et al. TOP2A promotes lung adenocarcinoma cells’ malignant progression and predicts poor prognosis in lung adenocarcinoma. J Cancer. 2020;11(9):2496–2508. doi:10.7150/jca.41415
- Nie Z, Pu T, Han Z, et al. Extra spindle pole bodies-like 1 serves as a prognostic biomarker and promotes lung adenocarcinoma metastasis. Front Oncol. 2022;12:930647. doi:10.3389/fonc.2022.930647
- Wang L, Yang X, An N, Liu J. Bioinformatics analysis of BUB1 expression and gene regulation network in lung adenocarcinoma. Transl Cancer Res. 2020;9(8):4820–4833. doi:10.21037/tcr-20-1045
- Qiao Y, Chen J, Ma C, et al. Increased KIF15 expression predicts a poor prognosis in patients with lung adenocarcinoma. Cell Physiol Biochem. 2018;51(1):1–10. doi:10.1159/000495155
- Yi M, Li T, Qin S, et al. Identifying tumorigenesis and prognosis-related genes of lung adenocarcinoma: based on weighted gene coexpression network analysis. Biomed Res Int. 2020;2020:4169691. doi:10.1155/2020/4169691
- Chan JJ, Tay Y. Noncoding RNA: RNA regulatory networks in cancer. Int J Mol Sci. 2018;19(5):1310. doi:10.3390/ijms19051310
- Su K, Wang N, Shao Q, Liu H, Zhao B, Ma S. The role of a ceRNA regulatory network based on lncRNA MALAT1 site in cancer progression. Biomed Pharmacother. 2021;137:111389. doi:10.1016/j.biopha.2021.111389
- Tan X, Qin W, Zhang L, et al. A 5-microRNA signature for lung squamous cell carcinoma diagnosis and hsa-miR-31 for prognosis. Clin Cancer Res. 2011;17(21):6802–6811. doi:10.1158/1078-0432.CCR-11-0419
- Belli C, Trapani D, Viale G, et al. Targeting the microenvironment in solid tumors. Cancer Treat Rev. 2018;65:22–32. doi:10.1016/j.ctrv.2018.02.004
- Wang SS, Liu W, Ly D, Xu H, Qu L, Zhang L. Tumor-infiltrating B cells: their role and application in anti-tumor immunity in lung cancer. Cell Mol Immunol. 2019;16(1):6–18. doi:10.1038/s41423-018-0027-x
- Wylie B, Macri C, Mintern JD, Waithman J. Dendritic cells and cancer: from biology to therapeutic intervention. Cancers. 2019;11(4). doi:10.3390/cancers11040521
- Tay RE, Richardson EK, Toh HC. Revisiting the role of CD4(+) T cells in cancer immunotherapy-new insights into old paradigms. Cancer Gene Ther. 2021;28(1–2):5–17. doi:10.1038/s41417-020-0183-x
- He QF, Xu Y, Li J, Huang ZM, Li XH, Wang X. CD8+ T-cell exhaustion in cancer: mechanisms and new area for cancer immunotherapy. Brief Funct Genomics. 2019;18(2):99–106. doi:10.1093/bfgp/ely006
- Sakkal S, Miller S, Apostolopoulos V, Nurgali K. Eosinophils in cancer: favourable or unfavourable? Curr Med Chem. 2016;23(7):650–666. doi:10.2174/0929867323666160119094313
- Grisaru-Tal S, Itan M, Klion AD, Munitz A. A new Dawn for eosinophils in the tumour microenvironment. Nat Rev Cancer. 2020;20(10):594–607. doi:10.1038/s41568-020-0283-9
- Najafi M, Hashemi Goradel N, Farhood B, et al. Macrophage polarity in cancer: a review. J Cell Biochem. 2019;120(3):2756–2765. doi:10.1002/jcb.27646
- Varricchi G, Galdiero MR, Loffredo S, et al. Are mast cells MASTers in cancer? Front Immunol. 2017;8:424. doi:10.3389/fimmu.2017.00424
- Bao X, Shi R, Zhao T, Wang Y. Mast cell-based molecular subtypes and signature associated with clinical outcome in early-stage lung adenocarcinoma. Mol Oncol. 2020;14(5):917–932. doi:10.1002/1878-0261.12670
- Niogret J, Berger H, Rebe C, et al. Follicular helper-T cells restore CD8 + -dependent antitumor immunity and anti-PD-L1/PD-1 efficacy. J Immunother Cancer. 2021;9(6):e002157. doi:10.1136/jitc-2020-002157
- Duan MC, Zhong XN, Liu GN, Wei JR. The Treg/Th17 paradigm in lung cancer. J Immunol Res. 2014;2014:730380. doi:10.1155/2014/730380
- Pardoll DM. The blockade of immune checkpoints in cancer immunotherapy. Nat Rev Cancer. 2012;12(4):252–264. doi:10.1038/nrc3239
- Memon H, Patel BM. Immune checkpoint inhibitors in non-small cell lung cancer: a bird’s eye view. Life Sci. 2019;233:116713. doi:10.1016/j.lfs.2019.116713
- Liu J, Chen Z, Li Y, Zhao W, Wu J, Zhang Z. PD-1/PD-L1 checkpoint inhibitors in tumor immunotherapy. Front Pharmacol. 2021;12:731798. doi:10.3389/fphar.2021.731798
- Ganesh K, Stadler ZK, Cercek A, et al. Immunotherapy in colorectal cancer: rationale, challenges and potential. Nat Rev Gastroenterol Hepatol. 2019;16(6):361–375. doi:10.1038/s41575-019-0126-x
- Anderson AC, Joller N, Kuchroo VK. Lag-3, Tim-3, and TIGIT: co-inhibitory receptors with specialized functions in immune regulation. Immunity. 2016;44(5):989–1004. doi:10.1016/j.immuni.2016.05.001
- De Giglio A, Di Federico A, Nuvola G, Deiana C, Gelsomino F. The landscape of immunotherapy in advanced NSCLC: driving beyond PD-1/PD-L1 inhibitors (CTLA-4, LAG3, IDO, OX40, TIGIT, vaccines). Curr Oncol Rep. 2021;23(11):126. doi:10.1007/s11912-021-01124-9
- Woo SR, Turnis ME, Goldberg MV, et al. Immune inhibitory molecules LAG-3 and PD-1 synergistically regulate T-cell function to promote tumoral immune escape. Cancer Res. 2012;72(4):917–927. doi:10.1158/0008-5472.CAN-11-1620
- Harjunpää H, Guillerey C. TIGIT as an emerging immune checkpoint. Clin Exp Immunol. 2020;200(2):108–119. doi:10.1111/cei.13407
- Havel JJ, Chowell D, Chan TA. The evolving landscape of biomarkers for checkpoint inhibitor immunotherapy. Nat Rev Cancer. 2019;19(3):133–150. doi:10.1038/s41568-019-0116-x