
Abstract
Background
Psoriasis is a common chronic, recurrent, and inflammatory skin disease. Identifying novel and potential biomarkers is valuable in the treatment and diagnosis of psoriasis. The goal of this study was to identify novel key biomarkers of psoriasis and analyze the potential underlying mechanisms.
Methods
Psoriasis-related datasets were downloaded from the Gene Expression Omnibus database to screen differential genes in the datasets. Functional and pathway enrichment analyses were performed on the differentially expressed genes (DEGs). Candidate biomarkers for psoriasis were identified from the GSE30999 and GSE6710 datasets using four machine learning algorithms, namely, random forest (RF), least absolute shrinkage and selection operator (LASSO) logistic regression, weighted gene co-expression network analysis (WGCNA), and support vector machine recursive feature elimination (SVM-RFE), and were validated using the GSE41662 dataset. Next, we used CIBERSORT and single-cell RNA analysis to explore the relationship between ADAM23 and immune cells. Finally, we validated the expression of the identified biomarkers expressions in human and mouse experiments.
Results
A total of 709 overlapping DEGs were identified, including 426 upregulated and 283 downregulated genes. Enhanced by enrichment analysis, the differentially expressed genes (DEGs) were spatially arranged in relation to immune cell involvement, immune-activating processes, and inflammatory signals. Based on the enrichment analysis, the DEGs were mapped to immune cell involvement, immune-activating processes, and inflammatory signals. Four machine learning strategies and single-cell RNA sequencing analysis showed that ADAM23, a disintegrin and metalloprotease, may be a unique, critical biomarker with high diagnostic accuracy for psoriasis. Based on CIBERSORT analysis, ADAM23 was found to be associated with a variety of immune cells, such as macrophages and mast cells, and it was upregulated in the macrophages of psoriatic lesions in patients and mice.
Conclusion
ADAM23 may be a potential biomarker in the diagnosis of psoriasis and may contribute to the pathogenesis by regulating immunological activity in psoriatic lesions.
Introduction
Psoriasis is a chronic skin condition caused by skin cells that multiply faster than normal due to immune system dysregulation.Citation1 Psoriasis is classified by the World Health Organization as one of the most serious non-communicable diseases, affecting 2–3% of the global population. Inverse psoriasis (IP), also known as flexural or intertriginous psoriasis, is a variety of plaque psoriasis that involves the body folds, most often the axillary, anogenital, and inframammary ones.Citation2 Clinical variants of psoriasis include plaque, guttate, erythrodermic, and pustular psoriasis. Most psoriasis variants have three main clinical features: erythema, thickening, and scaling.Citation3 Drugs targeting TNF-α, IL-23, and IL-17 and signaling pathways such as JAK/STAT are effective in the clinical management of plaque psoriasis. However, alternate inflammatory pathways may be valid for distinct psoriatic variants. The hallmark of psoriasis is sustained inflammation that leads to uncontrolled keratinocyte proliferation and dysfunctional differentiation. The histology of the psoriatic plaque shows acanthosis (epidermal hyperplasia), which overlies inflammatory infiltrates composed of dermal dendritic cells, macrophages, T cells, and neutrophils.Citation4 The current biological treatments for psoriasis include mainly sJAK inhibitors, ROCK inhibitors, S1P agonists, and AhR agonists.Citation5 The newest therapeutic opportunities include the inhibitors of Janus kinase/tyrosine kinase 2, phosphodiesterase-4 and IL-36 receptor.Citation6 The glutathione-S transferase regulation is also helpful in treating psoriasis.Citation7 Although researchers have found that biologics can effectively relieve clinical symptoms and reduce psoriasis areas and severity index patient scores,Citation8 patients still experience frequent adverse events and psoriasis recurrence.Citation9 Therefore, additional potential biomarkers of psoriasis need to be discovered to provide more possible targets for the treatment of psoriasis.
Psoriasis is an immune disease, and immunity plays a key role in the pathogenesis of psoriasis. Immunological studies in recent decades have shown that both innate and acquired immunity play a key role in the pathogenesis of psoriasis.Citation10,Citation11 For instance, it is well known that the pathogenic factors of psoriasis involve antimicrobial peptides, dendritic cells, tumor necrosis factor-α (TNF-α), interleukin (IL)-23, Th17, IL-17, IL-22, and signal transducer and activator of transcription-3. Although innate and adaptive immunity jointly promote the occurrence and development of psoriasis, the specific mechanism of immunity on psoriasis has not been thoroughly elucidated. Therefore, it is essential to determine how immune cells are involved in the occurrence and development of psoriasis.
Machine learning algorithms have been widely used to diagnose psoriasis and to screen molecular markers associated with the disease.Citation12–15 Single-cell RNA sequencing data have revealed immune cell characteristics in psoriasis subsets,Citation16,Citation17 and the molecular immunological mechanisms underlying psoriasis are yet to be fully elucidated. Therefore, we explored the potential molecular markers of psoriasis using the CIBERSORT method and machine learning algorithms based on omics data, which were further verified using clinical samples. We found ADAM23 may be a novel predictor of prospective psoriasis targets and may contribute to the pathogenesis by regulating immunological activity in psoriatic lesions.
Materials and Methods
Microarray Dataset Collection and Data Preprocessing
The raw gene expression profiles of patients with psoriasis were retrieved from the Gene Expression Omnibus (GEO) database.Citation18 To search for RNA-sequencing profiles in the GEO database, we used the keyword “psoriasis” [all fields]. The selection criteria were as follows: the term “microarray dataset” refers to the microarray dataset of the gene expression profile psoriasis and healthy samples should be included in the microarray dataset; and none of the patients received medicinal treatment. Finally, we narrowed our analysis down to three datasets: GSE30999,Citation19,Citation20 GSE6710,Citation21 and GSE41662.Citation22 The GSE30999 dataset comprises psoriasis cases with positive samples and healthy controls. The GSE30999 dataset was derived using the GPL570 platform and includes 85 non-lesion and 85 psoriasis lesion samples. The GSE6710 dataset was derived using the GPL96 platform and includes 13 lesion skin biopsy samples and 13 non-lesion skin samples. The GSE41662 dataset was derived using the GPL570 platform and includes 24 lesion skin samples and 24 non-lesion skin samples. The GSE41662 dataset was included as an external validation dataset. Additionally, R software was used to conduct quality control analysis and microarray data preprocessing with the Bioconductor package.Citation23
Identification of DEGs
Differentially expressed genes (DEGs) were screened from the GSE30999 and GSE6710 datasets using the “limma” package in R.Citation24 The filter conditions for the DEGs were set as an adjusted p-value < 0.05 and the absolute value of | log2 fold change | > 1. The R software ggplot2 V3.3.5 package was used to create volcano plots, while Pheatmap V1.0.12 was used to plot heatmaps for the top 100 DEGs from each dataset, and Venn Diagram V1.6.20 was used to create Venn diagrams.
Go and KEGG Functional Enrichment Analysis of DEGs
Functional enrichment analysis was performed using the R software cluster Profiler V3.18.1 packageCitation25 and Goplot V1.0.2 packageCitation26 (p < 0.05 and q < 0.05 were considered statistically significant) to explore the functions and pathways of overlapping DEGs. For all overlapping DEGs, Gene Ontology (GO; using the terms: biological process [BP], cellular component [CC], and molecular function [MF]) and Kyoto Encyclopedia of Genes and Genomes (KEGG) pathway enrichment analyses and visualization were performed.
Screening and Validation of Critical Gene Markers
Four algorithms, including random forests (RF),Citation27 least absolute shrinkage and selection operator (LASSO) logistic regression,Citation28 weighted gene co-expression network analysis (WGCNA)Citation29 and Support Vector Machine Recursive Feature Elimination (SVM-RFE),Citation30 were performed to screen for the key signatures for psoriasis. The R software random Forest V4.7–1 package and R software glmnet V4.1–4 package were used for implementing the RF algorithm and LASSO algorithm, respectively. SVM-RFE is a sequential backward feature elimination method based on SVM learning. The “E1071” and “msvmRFE” packagesCitation30 were used to find the optimal hub genes for SVM modeling by deleting feature vectors. Therefore, we used SVM-RFE analysis to screen for core biomarkers at the intersections of the DEGs.
Finally, WGCNA was performed on overlapping DEGs obtained from the GSE30999 and GSE6710 datasets. Based on the scale-free topology criterion, soft-power parameters ranging from 1–20 were selected using the “pickSoftThreshold” function in the WGCNA package. The extracted values were selected to construct an adjacency matrix, then the most appropriate value was selected and the correlation matrix was converted first to an adjacency matrix, then to a topological overlap matrix (TOM). Next, the average linkage hierarchical clustering method was used to cluster the genes based on a TOM, in which the minimum module size was set to 50. Thereafter, modules with similarities were merged. Pearson’s correlation analysis was used to evaluate the association between integrated and eigengene modules in psoriasis.
By intersecting the three sets using these algorithms, the critical biomarkers were identified, and the area under the receiver operating characteristic (ROC) curve (AUC) was used to evaluate the diagnostic performance of the critical biomarkers in the validated dataset GSE41662.
Evaluation and Correlation Analysis of Infiltration-Related Immune Cells
Using CIBERSORT,Citation31 the proportions of 22 types of immune cells were screened, with a p-value < 0.05 as the cutoff, to obtain the immune cell infiltration matrix. Principal component analysis (PCA) clustering of the immune cell infiltration matrix was performed using the “ggplot2” package. The “corrplot” package was used to map and visualize the correlations between the 22 types of infiltrating immune cells. Correlations between infiltrating immune cells and crucial biomarkers were determined using Spearman (non-parametric) correlation analysis.
Acquisition and Hematoxylin and Eosin Staining of Psoriasis Tissue Samples from Humans and Mice
Skin lesion samples from patients with psoriasis were obtained from lesion tissue biopsies of patients with plaque psoriasis. Psoriatic lesions from patients with psoriasis were examined using immunohistochemistry. The study was approved by the Ethics Committee of the First Affiliated Hospital of the University of Science and Technology of China (Anhui, Hefei), and all participants provided written informed consent before enrollment.
The animal experimental protocol was approved by the Animal Ethics Committee of the University of Science and Technology of China, in compliance with the Guidelines for the Ethical Review of Laboratory Animal Welfare, People’s Republic of China National Standard GB/T 35892–2018. Eight male mice from the Experimental Animal Center of the University of Science and Technology of China were maintained at 22–24 °C with 50% humidity, and all mice had free access to food and water. An area of 2.5 × 3 cm was selected on the back of each mouse and carefully shaved. Ten mice were randomly divided into two groups: control (normal group) and experimental (IMQ group). Once a day, 62.5 mg of IMQ ointment (Med-shine Pharma, Chengdu, China) was applied to the prepared back skin of each experimental mouse, and 62.5 mg of Vaseline® was applied to the prepared back skin of each control mouse. The skin in the back modeling area was dehydrated and fixed with 4% paraformaldehyde, embedded in paraffin, and cut into 5-μm paraffin sections. Sections from each group were stained with hematoxylin (Beyotime, China) and eosin (H&E). The sections were observed under a light microscope. At the end of the study, the mice were euthanized to obtain samples from psoriatic lesions after intraperitoneal injection of sodium pentobarbital (60 mg/kg) under anesthesia.
Immunofluorescence Staining
Human psoriasis tissue sections were obtained from paraffin samples. For immunofluorescence staining, the sections were incubated overnight at 4 °C and stained with a polyclonal antibody against ADAM23 (diluted 1:200, Rabbit, Bs-5853R, Bioss, London, UK) and a Cy3-labeled polyclonal secondary antibody (diluted 1:500, A0516, Beyotime, Shanghai, China). Sections were counterstained with 4’,6-diamidino-2-phenylindole (DAPI, C1002). Finally, images were acquired using a fluorescence microscope (KF-FL-020; Jiang Feng, Taichung City, China) and quantified using Image-Pro™ Plus analysis software V8.0 (Media Cybernetics, Rockville, MD, USA). CD68 antibody (diluted 1:300, AFSA006) and fluorescein isothiocyanate were purchased from Yeasen (Shanghai, China).
Western Blot
Psoriasis skin of mice lesions were harvested and lysed on ice with RIPA buffer. Protein samples were analyzed using 10% or 12% SDS-PAGE and transferred onto a polyvinylidene fluoride membrane. The membranes were blocked with 5% non-fat milk for 1 h at room temperature (25 °C), washed three times in TBST, and co-incubated with the primary antibody overnight at 4 °C. The membranes were washed three times with TBST and incubated with horseradish peroxidase-conjugated secondary antibodies (1:1000; ABclonal, Wuhan, China) for 1 h at room temperature. The bands were detected using a western ECL blotting substrate according to the manufacturer’s protocol. The following primary antibodies were used: anti-ADAM23 polyclonal antibody (diluted 1:1000; Bioss) and anti-GAPDH antibody (1:1000; AC001; ABclonal). Densitometric analysis was performed using ImageJ software (National Institutes of Health, Bethesda, MD, USA). The Western blot data from mice are expressed as means ± the standard deviation. Comparisons were performed using an unpaired t-test. Differences were considered statistically significant at two-tailed p-values < 0.05. GraphPad Prism V8.4.3 software (Prism 8 for macOS; San Diego, CA, USA) was used for the statistical analyses and to generate graphs.
Immunohistochemistry (IHC)
The skin sections embedded in paraffin were subjected to immunohistochemical analysis. The sections were subjected to heat treatment in a pressure cooker using citrate buffer (pH 6.0) at 121°C for 10 minutes. The endogenous peroxidase in the tissue sections was blocked with methanol containing 0.3% H2O2. The sections were then incubated with the anti-ADAM23 antibody (diluted 1:500; Bioss). Nuclei were stained with hematoxylin.
Results
Identification of DEGs Between Patients with Psoriasis and Controls Using GEO Datasets
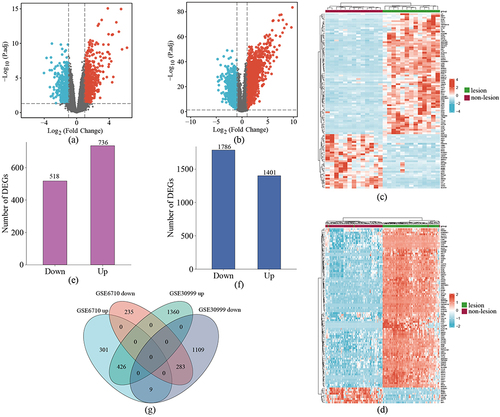
Based on the GSE6710 dataset, a total of 1254 DEGs were identified, of which 518 and 736 genes were downregulated and upregulated, respectively (). A total of 3187 DEGs, of which 1786 and 1401 genes were downregulated and upregulated, respectively, were obtained from the GSE30999 dataset (). The distribution of these DEGs in the GSE6710 and GSE30999 datasets is presented as volcano plots in and . The top 100 DEGs in the GSE6710 and GSE177477 datasets are shown in heatmaps ( and ). A Venn diagram () was used to show that there were 283 downregulated genes and 426 upregulated genes common in GSE6710 and GSE30999.
Figure 1 Differential gene screening. (a) Heatmap of DEGs in GSE6710. (b) Heatmap of DEGs in GSE30999. (c) Volcano plot of DEGs in GSE6710. (d) Volcano plot of DEGs in GSE30999. Number of DEGs in (e) GSE6710 and (f) GSE30999. (g) Venn diagram of common DEGs in GSE6710 and GSE30999.
GO and KEGG Pathway Analyses of DEGs
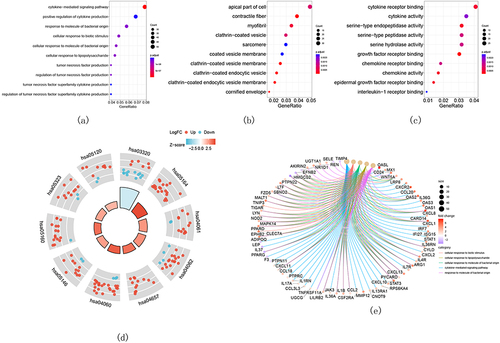
GO and KEGG pathway functional enrichment analyses of the 709 overlapping DEGs were conducted, and the results are presented in . The results showed that the significantly enriched BPs included the cytokine-mediated signaling pathway, positive regulation of cytokine production, and responses to molecules of bacterial origin (). In the CC category, the DEGs were enriched mainly in the apical part of cell, contractile fiber, and myofibril (). As for the MF category, the most enriched terms were cytokine receptor binding, cytokine activity, and serine-type endopeptidase activity (). Finally, KEGG pathway functional enrichment analysis was conducted on the DEGs. The PPAR signaling pathway, viral protein interactions with cytokines and cytokine receptors, chemokine signaling pathway, IL-17 signaling pathway, and influenza A were regarded as the most significantly enriched pathways ( and ).
Figure 2 GO and KEGG pathway enrichment analysis of DEGs. (a–c) Bubble charts show GO-enriched items of DEGs in BP, CC, and MF. (d) The circle plot shows KEGG-enriched items of DEGs. The red and the blue dots of the outer ring represent upregulated and downregulated genes, respectively. The height of the bar in the inner ring describes the adjusted p-value and the color corresponds to the z-score. (e) Chord plots show GO-enriched items of the overlapping DEGs.
Screening of Critical Signatures
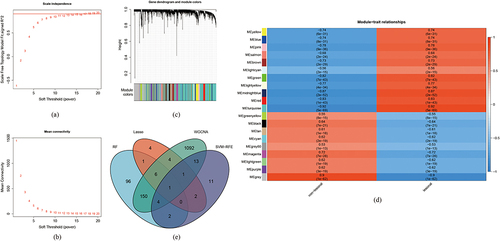
Because differential expressions in GSE30999 were more prominent than those in GSE6710, GSE30999 was used for the subsequent analyses. More specifically, RF, LASSO, WGCNA, and SVM-RFE analyses were performed to screen critical biomarkers, and the results are presented in . The data showed that the mean out-of-band error rate was at a minimum when mtry = 260, which meant that 260 critical genes were selected using the RF algorithms (). Moreover, 19 key biomarkers were screened using the LASSO logistic regression algorithm ( and ) where the mean-squared error was at a minimum, and 34 key biomarkers were selected with SVM-RFE (). WGCNA was then performed with the default recommended parameters (). Twenty notable co-expression modules were identified, of which the turquoise module corresponding to 1388 genes was selected for subsequent investigation because psoriasis was most significantly associated with the turquoise module (maximum p-value = 0.92). Finally, Venn diagrams () indicated that ADAM23 was the only overlapping gene in these algorithms.
Figure 3 Results of screening of critical signatures by using RF, LASSO, and SVM-RFE algorithms. (a–c) Identification of signatures using RF. Variant of mean out-of-band error rate with (a) mtry and (b) trees. (c) The out-of-band error is used to compute the variable importance, which is represented by the mean decline in accuracy (left panel) or the Gini coefficient (right panel). (d, e) LASSO was used to establish signatures. (d) Logistic regression analysis where different genes were represented with different colors. (e) Choosing the ideal parameter (lambda) for the LASSO model (left dash line). (f) Variant of 10-fold cross-validation error with the indicated number of signatures.
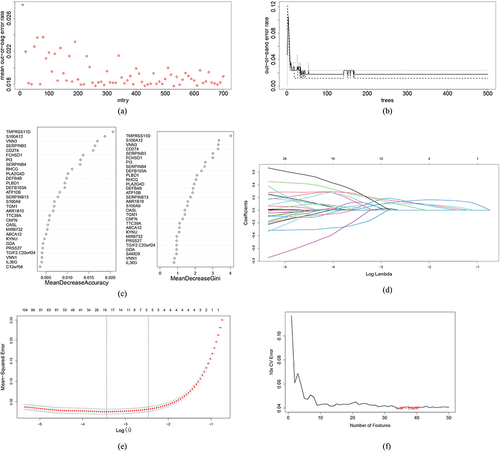
Figure 4 Results of screening of critical signatures using WGCNA. (a and b) Analysis of network topology for various soft-powers. By setting threshold = 0.9, soft-power = 17 was selected as the best parameter. (c and d) DEGs associated with psoriasis in a Clustering dendrogram, with differences based on topological overlap and given module colors (c). Module-trait relationships (d). Each module is represented by a row and each trait by a column. The matching correlation and p-value are included in each cell. According to the color legend, the table is color-coded based on association. (e) Venn diagrams showing the intersection of critical signatures obtained from these four machine learning algorithms.
Verification of ADAM23 as a Diagnostic Shared Gene
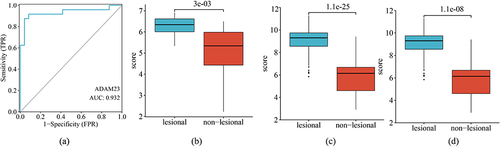
We validated the critical gene marker ADAM23 by performing ROC analysis on the GSE41662 validated dataset, in which the AUC was 0.932 (), indicating that ADAM23 had a high prediction accuracy for psoriasis. In addition, the expression differences () indicated the notable expression of ADAM23 in lesion and healthy samples. Additionally, ADAM23 was upregulated in psoriasis samples, compared with that in control samples in GSE6710, GSE30999, and GSE41662 (all p < 0.01).
Figure 5 Verification of ADAM23 as a diagnostic shared gene. (a) Diagnostic power of ADAM23 in GSE41662. Expression of ADAM23 in the (b) GSE6710, (c) GSE30999, and (d) GSE41662 datasets.
Immune Infiltration Analysis of Critical Biomarker ADAM23
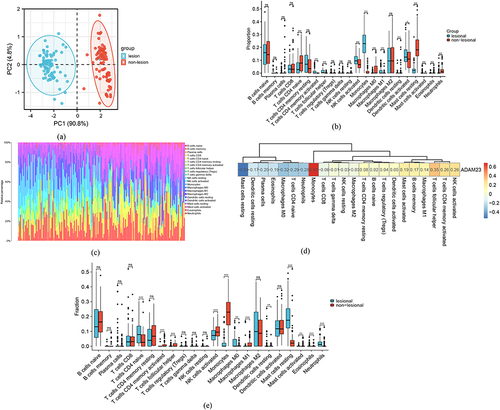
Considering that the enrichment analysis results showed that the immune response had a significant influence on psoriasis, we performed an immune infiltration analysis of ADAM23 using the CIBERSORT algorithm. PCA was conducted at first, and the results showed that the psoriasis and healthy samples were clearly separated from each other in the plot (). Naïve B cells, follicular helper T cells CD8, T cells, resting CD4+ memory cells, activated NK cells, activated monocytes, and activated dendritic cells expressed positive correlations, and CD4-naïve T cells, neutrophils, and resting mast cells expressed negatively correlations ( and ). In addition, as shown in the correlation results () and box plots () of the single-cell RNA sequencing data analysis, ADAM23 displayed the strongest positive correlations with monocytes (r = 0.68; p < 0.05) and the most significant negative correlations with resting mast cells (r = −0.54; p < 0.05).
Figure 6 Immune infiltration analysis of ADAM23. (a) PCA cluster plot of gene expression profiles of psoriasis and control samples in GSE30999. (b) Boxplot of 22 types of immune cells in the GSE6710 dataset. *** p < 0.001, ** p < 0.01, * p < 0.05; not significant (ns) p ≥ 0.05. (c) Bar plot showing immune cell infiltration in GSE30999. (d) Correlations between ADAM23 and infiltrating immune cells in GSE30999. (e) Correlations between ADAM23 and infiltrating immune cells in GSE30999.
Upregulation of ADAM23 in Mice Psoriasis Samples
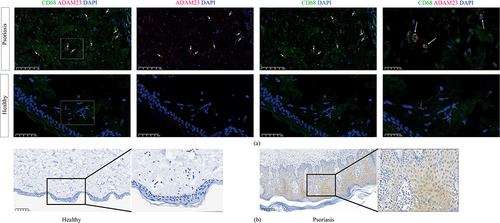
To further validate our findings, we used imiquimod to establish a mouse psoriasis model ( and ) and H&E staining to observe a mouse psoriasis model in which psoriatic lesions were significantly thicker than normal skin (). Furthermore, we measured the expression of ADAM23 in mouse psoriatic lesions, and immunoblotting showed that ADAM23 was significantly increased in the skin lesions of psoriatic mice compared to that in the controls ( and ). To investigate the relationship between ADAM23 and macrophages, we performed immunofluorescence analysis in human psoriatic lesions and healthy skins. Immunofluorescence staining of psoriasis lesion skins and healthy skins showed colocalization of ADAM23 with CD68-positive macrophages (). Therefore, these results further support the notion that ADAM23, as a potential diagnostic marker of psoriasis, colocalizes with macrophages and potentially contributes to the pathogenesis of psoriatic lesions. Immunohistochemistry showed that ADAM23 was increased in the lesion skins of psoriasis patients compared with healthy controls ().
Figure 7 Upregulation of ADAM23 in mice psoriasis tissues. (a and b) Establishment of a mouse model of psoriasis. (c) H&E staining of skin from healthy mice and skin lesions from psoriatic mice. (d and e) Protein levels of ADAM23 in mice psoriasis lesion samples assessed by Western blot analysis.
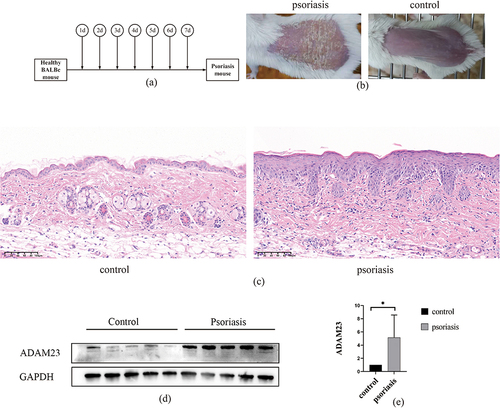
Figure 8 Immunohistochemistry and immunofluorescence showed that ADAM23 was elevated in psoriasis lesion skins. (a) Immunofluorescence for ADAM23 and CD68 in psoriasis tissues from human psoriasis lesion samples and healthy skin samples. (b) Immunohistochemistry for ADAM23 in psoriasis lesion skins and healthy skin tissues.
Discussion
Mounting evidence suggests that the identification of possible biomarkers and targets is critical for the effective treatment of cutaneous inflammatory disorders.Citation32,Citation33 Our study is the first to identify ADAM23 as a potential biomarker for psoriasis. Our results show that ADAM23 may be upregulated in macrophage-rich psoriatic lesions in psoriatic mice as well as in patients with psoriasis. Thus, this is the first report confirming that ADAM23 localizes to macrophages in vivo and that ADAM23 may be a novel potential biomarker for psoriasis. At present, our study demonstrated that ADAM23 is highly expressed in psoriatic lesions compared with healthy skin samples, indicating that ADAM23 may be a diagnosis of psoriasis. In this study, the IHC assay shows that ADAM23 is highly expressed in psoriasis lesion skins, compared with healthy skins, so we suggest that ADAM23 might be a potential biomarker for psoriasis. However, we lack the related evidence to determine whether it could be regarded as a biomarker for early detection or late detection, or the indicator of treatment efficiency. Currently, the diagnosis of psoriasis is mainly based on clinical diagnosis. We propose that high ADAM23 expression could be a potential biomarker for the diagnosis of psoriasis, which support its potential application in clinical practice.
Bioinformatics and machine learning algorithms have expanded our understanding of the mechanisms underlying psoriasis. Many studies have used machine learning algorithms for disease analysis.Citation34,Citation35 In this study, we used four machine learning algorithms, WGCNA, RF, LASSO, and SVM-RFE, to screen key psoriasis genes. The purpose of using multiple machine learning algorithms was to establish a consensus model. The intersection of markers extracted from this algorithm can help to identify more specific psoriasis-related biomarkers from a large amount of data, thereby enhancing the specificity and sensitivity of the biomarker. ADAM23 was selected as a potential signature of psoriasis using four machine learning algorithms. In addition, ROC analysis showed that ADAM23 levels differed significantly between psoriatic lesions and healthy human tissues. ADAM23 maintained a stable performance on other datasets.
Innate immunity and adaptive immunity play key roles in the pathogenesis of psoriasis. An increased number of immune cells (especially dendritic cells and T cells) are present in psoriatic lesions.Citation36 Given the vital role of immunity in psoriasis, we attempted to explore the relationship between psoriasis-related biomarkers and immune cells. We used the CIBERSORT algorithm, and the results showed that ADAM23 was highly expressed on macrophages. ADAM23 was localized to macrophages by single-cell transcriptome analysis of psoriasis data. Therefore, these data provide new insights into the pathogenesis of psoriasis and the immune mechanisms of ADAM23 in the pathogenesis of psoriasis. To confirm that ADAM23 is a key associated biomarker in psoriasis and is correlated with immune cells, immunofluorescence colocalization and Western blot assay were performed on psoriasis lesions in humans. Investigations backed the high expression of ADAM23 in psoriatic lesions, along with the colocalization of ADAM23 with macrophages.
ADAM23 is a member of the brain macrophage-derived chemokine familyCitation37 and is a receptor for leucine-rich repeat LGI family member 3 (LGI3). LGI3 increases proinflammatory proteins, including TNF-α, in macrophages.Citation38,Citation39 HaCaT cells, a keratinocyte, can produce LGI3.Citation40 LGI3 is a proinflammatory cytokine secreted by preadipocytes and macrophages.Citation39 Research has shown that psoriasis is regulated by complex interactions between immune cells, such as keratinocytes, dendritic cells, T lymphocytes, neutrophils, macrophages, natural killer cells, mast cells, and other immune cells.Citation41 Therefore, we hypothesized that both macrophages and ADAM23 are involved in the immune pathogenesis of psoriasis. This is consistent with our results from psoriatic lesions in humans and mice.
In addition to its association with macrophages, ADAM23 is involved in the development and differentiation of the nervous system. ADAM23 is a cell surface glycoprotein expressed by neurons in the central nervous system.Citation42 Several members of a disintegrin and metalloproteinase (ADAM) protein family are involved in biological processes ranging from fertilization to myoblast fusion and nerve cell fate determination. ADAM23 plays a pivotal role in various neuronal processes, including modulation of neuronal excitability and differentiation, facilitation of cell adhesion through integrin binding, promotion of neurite outgrowth and differentiation. Additionally, its involvement has been implicated in cancer metastasis and epilepsy.Citation43,Citation44 In psoriasis, peripheral sensory nerves, especially nociceptors, can promote the release of pathogenic cytokines, such as dermal dendritic cell IL-23 and T cell IL-17, through the secretion of calcitonin gene-related peptide neuropeptides.Citation45,Citation46 Recent studies have shown that mesodermal fibroblast subgroups in mouse psoriasis samples promote the abnormal proliferation of nerve axons and neuroimmune interactions.Citation47 Therefore, ADAM23 may be involved in psoriasis by regulating the nervous system, ADAM23 is also associated with neuroinflammation and neurogenesis. Psoriasis is a chronic, psycho-dermatological condition.Citation48 In the skin–brain axis, psoriasis as a chronic stress activates the hypothalamic–pituitary–adrenal (HPA) axis, which can control the immune system via neuroendocrine factors and the autonomous nervous system.Citation49
Therefore, this study might provide new insights into psoriasis and novel ideas for its treatment and diagnosis. To this end, the limitations of this study should be overcome in the future, including the verification of large-scale clinical samples and the mechanisms by which ADAM23 is involved in the pathogenesis of psoriasis.
Conclusions
Our findings revealed, for the first time, that ADAM23 is implicated in the pathogenesis of psoriasis and upregulation of ADAM23 may be a novel biomarker of psoriasis targets. ADAM23 colocalizes with macrophages in psoriatic lesions, suggesting that its effect might be mediated by the immune system.
Abbreviations
DEGs, Differentially expressed genes; TNF-α, tumor necrosis factor-α; IL, interleukin; GEO, Gene Expression Omnibus; GO, Gene Ontology; BP, biological process; CC, cellular component; MF, molecular function; KEGG, Kyoto Encyclopedia of Genes and Genomes; RF, random forests; LASSO, least absolute shrinkage and selection operator; WGCNA, weighted gene co-expression network analysis; SVM-RFE, Support Vector Machine Recursive Feature Elimination; TOM, topological overlap matrix; AUC, area under the curve; ROC, receiver operating characteristic; H&E, hematoxylin and eosin; PCA, principal component analysis.
Ethics Approval and Informed Consent
The study was conducted in accordance with the declaration of Helsinki. The study was also approved by the Ethics Committee of the First Affiliated Hospital of the University of Science and Technology of China (Anhui, Hefei), number: 2022-N (A)-270 and 2022-N (H)-131, in compliance with the Guidelines for the Ethical Review of Laboratory Animal Welfare, People’s Republic of China National Standard GB/T 35892-2018.
Author Contributions
All authors read and approved the final manuscript. All authors made a significant contribution to the work reported, whether that is in the conception, study design, execution, acquisition of data, analysis and interpretation, or in all these areas; took part in drafting, revising or critically reviewing the article; gave final approval of the version to be published; have agreed on the journal to which the article has been submitted; and agree to be accountable for all aspects of the work.
Disclosure
The authors declare that there are no conflicts of interest.
Acknowledgments
We thank the authors of the GSE6710, GSE41662, and GSE30999 datasets for their contribution.
Data Sharing Statement
The datasets generated during and/or analyzed during the current study are publicly available.
Additional information
Funding
References
- Walter K. Psoriasis. JAMA. 2022;327(19):1936. doi:10.1001/jama.2022.5270
- Omland SH, Gniadecki R. Psoriasis inversa: a separate identity or a variant of psoriasis vulgaris? Clin Dermatol. 2015;33(4):456–461. doi:10.1016/j.clindermatol.2015.04.007
- Armstrong AW, Read C. Pathophysiology, Clinical Presentation, and Treatment of Psoriasis: a Review. JAMA. 2020;323(19):1945–1960. doi:10.1001/jama.2020.4006
- Rendon A, Schäkel K. Psoriasis Pathogenesis and Treatment. Int J Mol Sci. 2019;20(6):1475. doi:10.3390/ijms20061475
- Tokuyama M, Mabuchi T. New Treatment Addressing the Pathogenesis of Psoriasis. Int J Mol Sci. 2020;21(20):7488. doi:10.3390/ijms21207488
- Campione E, Cosio T, Di Prete M, Lanna C, Dattola A, Bianchi L. Experimental Pharmacological Management of Psoriasis. J Exp Pharmacol. 2021;13:725–737. doi:10.2147/JEP.S265632
- Campione E, Mazzilli S, Di Prete M, et al. The Role of Glutathione-S Transferase in Psoriasis and Associated Comorbidities and the Effect of Dimethyl Fumarate in This Pathway. Front Med Lausanne. 2022;9:760852. doi:10.3389/fmed.2022.760852
- Al-Hammadi A, Ruszczak Z, Magariños G, Chu CY, El Dershaby Y, Tarcha N. Intermittent use of biologic agents for the treatment of psoriasis in adults. J Eur Academy Dermatol Venereol. 2021;35(2):360–367. doi:10.1111/jdv.16803
- Gordon KB, Strober B, Lebwohl M, et al. Efficacy and safety of risankizumab in moderate-to-severe plaque psoriasis (UltIMMa-1 and UltIMMa-2): results from two double-blind, randomised, placebo-controlled and ustekinumab-controlled Phase 3 trials. Lancet. 2018;392(10148):650–661. doi:10.1016/S0140-6736(18)31713-6
- Uppala R, Tsoi LC, Harms PW, et al. “Autoinflammatory psoriasis”-genetics and biology of pustular psoriasis. Cell Mol Immunol. 2021;18(2):307–317. doi:10.1038/s41423-020-0519-3
- Lowes MA, Suárez-Fariñas M, Krueger JG. Immunology of psoriasis. Annu Rev Immunol. 2014;32(1):227–255. doi:10.1146/annurev-immunol-032713-120225
- Lebwohl M, Soliman AM, Yang H, Wang J, Freimark J, Puig L. Impact of PASI response on work productivity and the effect of risankizumab on indirect costs using machine learning in patients with moderate-to-severe psoriasis. J DermatolTreat. 2022;33(4):2094–2101. doi:10.1080/09546634.2021.1919287
- Gottlieb AB, Mease PJ, Kirkham B, et al. Secukinumab Efficacy in Psoriatic Arthritis: machine Learning and Meta-analysis of Four Phase 3 Trials. J Clin Rheumatol. 2021;27(6):239–247. doi:10.1097/RHU.0000000000001302
- Meienberger N, Anzengruber F, Amruthalingam L, et al. Observer-independent assessment of psoriasis-affected area using machine learning. J Eur Academy Dermatol Venereol. 2020;34(6):1362–1368. doi:10.1111/jdv.16002
- Martínez BA, Shrotri S, Kingsmore KM, Bachali P, Grammer AC, Lipsky PE. Machine learning reveals distinct gene signature profiles in lesional and nonlesional regions of inflammatory skin diseases. Sci Adv. 2022;8(17):eabn4776. doi:10.1126/sciadv.abn4776
- Hughes TK, Wadsworth MH, Gierahn TM, et al. Second-Strand Synthesis-Based Massively Parallel scRNA-Seq Reveals Cellular States and Molecular Features of Human Inflammatory Skin Pathologies. Immunity. 2020;53(4):878–94.e7. doi:10.1016/j.immuni.2020.09.015
- Liu Y, Wang H, Taylor M, et al. Classification of human chronic inflammatory skin disease based on single-cell immune profiling. Sci Immunol. 2022;7(70):eabl9165. doi:10.1126/sciimmunol.abl9165
- Barrett T, Wilhite SE, Ledoux P, et al. NCBI GEO: archive for functional genomics data sets—update. Nucleic Acids Res. 2012;41(D1):D991–D995. doi:10.1093/nar/gks1193
- Suárez-Fariñas M, Li K, Fuentes-Duculan J, Hayden K, Brodmerkel C, Krueger JG. Expanding the psoriasis disease profile: interrogation of the skin and serum of patients with moderate-to-severe psoriasis. J Invest Dermatol. 2012;132(11):2552–2564. doi:10.1038/jid.2012.184
- Correa da Rosa J, Kim J, Tian S, Tomalin LE, Krueger JG, Suárez-Fariñas M. Shrinking the Psoriasis Assessment Gap: early Gene-Expression Profiling Accurately Predicts Response to Long-Term Treatment. J Invest Dermatol. 2017;137(2):305–312. doi:10.1016/j.jid.2016.09.015
- Reischl J, Schwenke S, Beekman JM, Mrowietz U, Stürzebecher S, Heubach JF. Increased expression of Wnt5a in psoriatic plaques. J Invest Dermatol. 2007;127(1):163–169. doi:10.1038/sj.jid.5700488
- Bigler J, Rand HA, Kerkof K, Timour M, Russell CB. Cross-study homogeneity of psoriasis gene expression in skin across a large expression range. PLoS One. 2013;8(1):e52242. doi:10.1371/journal.pone.0052242
- Gentleman RC, Carey VJ, Bates DM, et al. Bioconductor: open software development for computational biology and bioinformatics. Genome Biol. 2004;5(10):R80. doi:10.1186/gb-2004-5-10-r80
- Ritchie ME, Phipson B, Wu D, et al. limma powers differential expression analyses for RNA-sequencing and microarray studies. Nucleic Acids Res. 2015;43(7):e47–e47. doi:10.1093/nar/gkv007
- Yu G, Wang LG, Han Y, He QY. clusterProfiler: an R package for comparing biological themes among gene clusters. Omics. 2012;16(5):284–287. doi:10.1089/omi.2011.0118
- Walter W, Sánchez-Cabo F, Ricote M. GOplot: an R package for visually combining expression data with functional analysis. Bioinformatics. 2015;31(17):2912–2914. doi:10.1093/bioinformatics/btv300
- Breiman L. Random Forests. Machine Learning. 2001;45(1):5–32. doi:10.1023/A:1010933404324
- Tibshirani R. Regression Shrinkage and Selection via The Lasso: a Retrospective. J Royal Statistical Society Series B. 2011;73(3):273–282. doi:10.1111/j.1467-9868.2011.00771.x
- Langfelder P, Horvath S. WGCNA: an R package for weighted correlation network analysis. BMC Bioinf. 2008;9(1):559. doi:10.1186/1471-2105-9-559
- Yoon S, Kim S. AdaBoost-based multiple SVM-RFE for classification of mammograms in DDSM. BMC Med Inform Decis Mak. 2009;9 Suppl 1(Suppl 1):S1. doi:10.1186/1472-6947-9-S1-S1
- Chen B, Khodadoust MS, Liu CL, Newman AM, Alizadeh AA. Profiling Tumor Infiltrating Immune Cells with CIBERSORT. Methods Mol Biol. 2018;1711:243–259.
- Huang J, Feng X, Zeng J, et al. Aberrant HO-1/NQO1-Reactive Oxygen Species-ERK Signaling Pathway Contributes to Aggravation of TPA-Induced Irritant Contact Dermatitis in Nrf2-Deficient Mice. J Immunol. 2022;208(6):1424–1433. doi:10.4049/jimmunol.2100577
- Ge Y, Luo J, Li D, et al. Deficiency of vitamin D receptor in keratinocytes augments dermal fibrosis and inflammation in a mouse model of HOCl-induced scleroderma. Biochem Biophys Res Commun. 2022;591:1–6. doi:10.1016/j.bbrc.2021.12.085
- Guo F, Zhu X, Wu Z, Zhu L, Wu J, Zhang F. Clinical applications of machine learning in the survival prediction and classification of sepsis: coagulation and heparin usage matter. J Transl Med. 2022;20(1):265. doi:10.1186/s12967-022-03469-6
- Yue S, Li S, Huang X, et al. Machine learning for the prediction of acute kidney injury in patients with sepsis. J Transl Med. 2022;20(1):215. doi:10.1186/s12967-022-03364-0
- Nestle FO, Kaplan DH, Barker J. Psoriasis. N Engl J Med. 2009;361(5):496–509. doi:10.1056/NEJMra0804595
- Elizondo DM, Andargie TE, Marshall KM, Zariwala AM, Lipscomb MW. Dendritic cell expression of ADAM23 governs T cell proliferation and cytokine production through the α(v)β(3) integrin receptor. J Leukoc Biol. 2016;100(5):855–864. doi:10.1189/jlb.2HI1115-525R
- Kim HA, Park WJ, Jeong HS, et al. Leucine-rich glioma inactivated 3 regulates adipogenesis through ADAM23. Biochim Biophys Acta. 2012;1821(6):914–922. doi:10.1016/j.bbalip.2012.02.010
- Kim HA, Kwon NS, Baek KJ, Kim DS, Yun HY. Leucine-rich glioma inactivated 3 and tumor necrosis factor-α regulate mutually through NF-κB. Cytokine. 2015;72(2):220–223. doi:10.1016/j.cyto.2014.12.023
- Kim IW, Jeong HS, Kwon NS, Baek KJ, Yun HY, Kim DS. LGI3 promotes human keratinocyte differentiation via the Akt pathway. Exp Dermatol. 2018;27(11):1224–1229. doi:10.1111/exd.13766
- Yu J, Zhao Q, Wang X, et al. Pathogenesis, multi-omics research, and clinical treatment of psoriasis. J Autoimmun. 2022;133:102916. doi:10.1016/j.jaut.2022.102916
- Goldsmith AP, Gossage SJ, ffrench-Constant C. ADAM23 is a cell-surface glycoprotein expressed by central nervous system neurons. J Neurosci Res. 2004;78(5):647–658. doi:10.1002/jnr.20320
- Hsia HE, Tüshaus J, Brummer T, Zheng Y, Scilabra SD, Lichtenthaler SF. Functions of ‘A disintegrin and metalloproteases (ADAMs)’ in the mammalian nervous system. Cell Mol Life Sci. 2019;76(16):3055–3081. doi:10.1007/s00018-019-03173-7
- Markus-Koch A, Schmitt O, Seemann S, et al. ADAM23 promotes neuronal differentiation of human neural progenitor cells. Cell Mol Biol Lett. 2017;22(1):16. doi:10.1186/s11658-017-0045-1
- Riol-Blanco L, Ordovas-Montanes J, Perro M, et al. Nociceptive sensory neurons drive interleukin-23-mediated psoriasiform skin inflammation. Nature. 2014;510(7503):157–161. doi:10.1038/nature13199
- Cohen JA, Edwards TN, Liu AW, et al. Cutaneous TRPV1(+) Neurons Trigger Protective Innate Type 17 Anticipatory Immunity. Cell. 2019;178(4):919–32.e14. doi:10.1016/j.cell.2019.06.022
- Cai X, Han M, Lou F, et al. Tenascin C(+) papillary fibroblasts facilitate neuro-immune interaction in a mouse model of psoriasis. Nat Commun. 2023;14(1):2004.
- Liluashvili S, Kituashvili T. Dermatology Life Quality Index and disease coping strategies in psoriasis patients. Postepy Dermatol Alergol. 2019;36(4):419–424. doi:10.5114/ada.2018.75810
- Weiglein A, Gaffal E, Albrecht A. Probing the Skin-Brain Axis: new Vistas Using Mouse Models. Int J Mol Sci. 2022;23(13):7484. doi:10.3390/ijms23137484