Abstract
Background
Participation and performance trends in age group athletes have been investigated in endurance and ultraendurance races in swimming, cycling, running, and triathlon, but not in long-distance inline skating. The aim of this study was to investigate trends in participation, age, and performance in the longest inline race in Europe, the Inline One-Eleven over 111 km, held between 1998 and 2009.
Methods
The total number, age distribution, age at the time of the competition, and race times of male and female finishers at the Inline One-Eleven were analyzed.
Results
Overall participation increased until 2003 but decreased thereafter. During the 12-year period, the relative participation in skaters younger than 40 years old decreased while relative participation increased for skaters older than 40 years. The mean top ten skating time was 199 ± 9 minutes (range: 189–220 minutes) for men and 234 ± 17 minutes (range: 211–271 minutes) for women, respectively. The gender difference in performance remained stable at 17% ± 5% across years.
Conclusion
To summarize, although the participation of master long-distance inline skaters increased, the overall participation decreased across years in the Inline One-Eleven. The race times of the best female and male skaters stabilized across years with a gender difference in performance of 17% ± 5%. Further studies should focus on the participation in the international World Inline Cup races.
Introduction
The popularity of endurance sports increased in the last decades. For half-marathons and marathons, the participation has changed over the years. While the overall participation increased for marathons and ultramarathons,Citation1–Citation3 the age pattern changed. Jokl et alCitation4 showed that for the New York City Marathon, participation for athletes in the 10–19-year age group decreased, while participation among athletes aged 30–59 years showed a remarkable increase. The finding of an increased participation of master athletes was verified by other authors in marathon running and ultramarathon running.Citation3,Citation5–Citation10 Other endurance competitions held in ultraswimming,Citation11–Citation14 ultracycling,Citation15–Citation19 and ultratriathlons started in the late 20th century.Citation20–Citation22
Apart from an increase in master athletes, the increase in female participation was also attributed to an increase in the overall participation in marathon running.Citation4 Female participation in endurance and ultraendurance events increased from the early 1980s to the present. Jokl et alCitation4 reported that for the New York City Marathon, female participation increased at a greater rate than male participation between 1983 and 1999. Based on the decline in the ratio of male to female runners from 5.6:1 in 1983 to 2.47:1 in 1999, and assuming that this pattern would continue, the authors expected the ratio to approach 1:1 in 2007.Citation4 Participation of female athletes in ultraendurance events exhibited a similar trend. Female participation in ultramarathons such as the Western States 100 Mile Endurance Run progressively increased from 10%–12% of the field in 1986 to 20%–22% since 2001.Citation3
It has been assumed that gender differences in performance would vanish for longer running distances in the future.Citation23 Although women improved performance at a greater rate than men, there is still a small gap in performance between women and men. Based on the analysis of the world’s best running times from 1980 to 1996 for races of 1500 m and the marathon distance, Sparling et alCitation24 concluded that distance running performances for women had reached a plateau after demonstrating an initial improvement. The comparison of the top 50 running times among women and men showed a gender difference in performance of 10%–13%. The reason behind the conclusion that women would outrun men sooner was a comparative analysis of recent or future performances.Citation23,Citation25 Coast et alCitation26 investigated the gender difference in performance for distances between 100 m and 200 km and showed that men were ~12% faster than women. Longer distances were associated with a greater gender difference in performance.Citation26 For the ultramarathon distances, female performance improved relative to men throughout the 1980s, but in the past two decades, the average times of the fastest runners showed no change for either gender.Citation26 The fastest women are still running ~20% slower than the fastest men.Citation27
Another key topic addressed in recent years was the investigation of endurance performance related to the age of the athletes.Citation4,Citation5,Citation28,Citation29 It was widely accepted that endurance performance showed an age-related decline, as reported for running and for other disciplines such as swimming and triathlon.Citation6,Citation28,Citation30–Citation37 Recent research showed that master athletes, defined as athletes older than 35 years,Citation38 improved their performance times at a higher rate than younger athletes.Citation1,Citation4–Citation6,Citation28 Thus, the argument of a decline in endurance performance with advancing age beyond the age of 30–35 years needs to be questioned.Citation39–Citation41 The analysis of finishing times of trained endurance athletes showed that the decline in running performance started after the age of 50 years, and that the decline in performance of runners aged beyond 35 years was mostly due to physical inactivity and negative lifestyle factors (eg, smoking, malnutrition, or overnutrition).Citation28
Apart from the traditional endurance sports running,Citation1–Citation6 cycling,Citation15–Citation18 and swimming,Citation11–Citation14 new sports disciplines were created in the last two decades, such as long-distance inline skating.Citation42–Citation45 In the early 1990s, the popularity of inline skating showed an enormous increase, leading to inline-speed skating competitions, like sprint races or marathon races such as the Athens-2-Atlanta (86 miles = 138.4 km).Citation46 Inline speed skating is a special endurance discipline because of its technical aspect. Special skates are used where the number, size, and hardness of the wheels can be changed and may affect performance.Citation43 According to the race track, the skaters can assemble their skating shoes especially for each road. The use of ordinary skates or custom-made skates, and the different wheel bearings can have a remarkable effect on performance. Apart from anthropometry, training, and pre-race experience, equipment is the most important variable for performance of nonexperienced skaters. Performance of experienced skaters who know their equipment relies upon body mass, skin-fold thickness, and body fat.Citation44
Recent studies have investigated participation and performance trends for marathon races like the New York City Marathon,Citation1 or ultramarathon and long-distance triathlon events like the Ironman Hawaii,Citation20 but to date there is no data available on participation and performance trends in inline speed skating races. Studies focused on predictor variables in athletes competing in the long-distance speed skating race, Inline One-Eleven.Citation42,Citation44 Knechtle et alCitation42 investigated female finishers in the Inline One-Eleven, showing that body height, age, and duration of each training unit were the best predictor variables for female ultraendurance inliners. An investigation focusing on male participants in the Inline One-Eleven demonstrated that the performance of experienced long-distance skaters relied upon body mass, skin-fold thickness, and body fat.Citation44
Participation and performance trends in endurance and ultraendurance races have been investigated for different sports disciplines such as swimming,Citation11–Citation14 road cycling,Citation15–Citation17 mountain bike cycling,Citation18,Citation19 running of different distances,Citation2–Citation4,Citation7,Citation9,Citation47–Citation50 wheelchair cycling,Citation51,Citation52 duathlon,Citation53 and triathlon of different race distances;Citation20,Citation22,Citation35–Citation37,Citation54 however, these were not investigated for long-distance inline skating. The aim of the present study was to investigate the participation and performance trends of the Inline One-Eleven held in Switzerland from 1998 to 2009. The Inline One-Eleven was the longest inline skating race in Europe, covering the total distance of 111 km with a total altitude of 1400 m to climb. The start of the race was in the heart of the city of St Gallen, Switzerland, and then went on to a large loop of 111 km in the east of Switzerland, returning to St Gallen. The race took place each year at the beginning of June. Inline skaters from all over Europe came to St Gallen for the longest inline race in Europe, held on completely closed routes, where drafting was allowed. Due to increased costs, a lack of sponsoring, and a decreased number of participants (only 900 athletes participated in the last race in 2009), the Inline One-Eleven was suspended. According to existing literature, we hypothesized that (1) overall participation in the Inline One-Eleven increased across years; (2) performance of the best athletes improved during the 12-year period of the race; and (3) participation of women and master athletes increased.
Methods
This study was approved by the institutional review board of St Gallen, Switzerland, with a waiver of the requirement for informed consent given that the study involved the analysis of publicly available data. All race results were provided by the race director. The age at the time of the competition, as well as race times of male and female finishers at the Inline One-Eleven were analyzed from the first race held in 1998 to the last race held in 2009.
Data analysis
Winner and top ten overall performances
The age at the time of competition and race times of the annual winners and the annual top ten men and women were analyzed from 1998 to 2009. Data (ie, ages and race times) were averaged across the first ten female and male finishers for each year from 1998 to 2009. Race times were converted to minutes. The magnitudes of the gender difference were examined by calculating the percent difference for the race times of the male versus female winners and of the top ten men versus the top ten women.
Age-related changes in performance
We distinguished between the age group categories of 18–24 years, 25–29 years, 30–34 years, 35–39 years, 40–44 years, 45–49 years, 50–54 years, 55–59 years, 60–64 years, and 65–69 years. Due to the low number of female finishers over 59 years, the last female age group analyzed was 55–59 years. We therefore considered only the performances of the best 50 male and the best 20 female skaters per age group during the 12-year period. This differentiation was selected due to the lower number of women compared to men. For this period, the skating time performances of the best 50 male and the best 20 female skaters per age group was expressed in terms of the percentage of winner performance times.
Statistical analysis
Data are reported as means ± standard deviation in the text. Linear regressions were used for estimating the changes of selected variables per year. Pearson’s correlation coefficients were used to assess the association between variables (Statistica version 6.1; StatSoft, Inc, Tulsa, OK, USA). The age of the female versus male winners was compared using an unpaired Student’s t-test. To determine if the age of the top ten male and the female finishers differed across years, an analysis of variance (ANOVA) with repeated measures on year with gender as the between-subject factor was performed. One-way ANOVA was used to compare the race times between the different age groups for both men and women. Tukey’s post hoc analyses were used to test differences within the ANOVA when appropriate. Statistical significance was accepted at P < 0.05.
Results
Participation trends
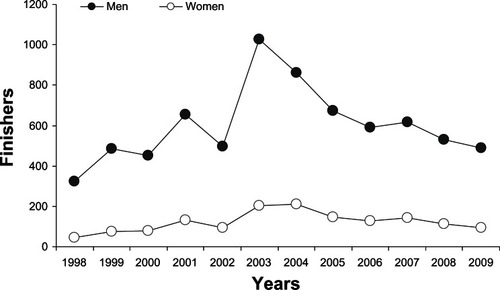
The Inline One-Eleven started in 1998. In the 12-year period, a total of 8662 finishers could be counted with 1463 female and 7199 male finishers. The number of male finishers indicated a slight increase from 322 to about 500 in the following years until 2002, and then a sharp rise was observed, with a peak of 1026 finishing men in 2003, which was twice as many as in 2002. The number of finishers each year over the history of the event is shown in . Between 1998 and 2009, the average number of finishers per year was 600 ± 190 (range: 322–1026) for men and 122 ± 50 (range: 44–209) for women, respectively. The number of female finishers showed a constant increase from 44 in 1998 to 209 in 2003. Then, the number of finishers showed a constant deterioration again to about 500 men and 100 women finishing the race in 2009. Women accounted on average for 16.5% ± 2.2% of the field over the 12-year period.
Figure 1 Number of finishers at the Inline One-Eleven for each gender from 1998 to 2009.
Age of the skaters
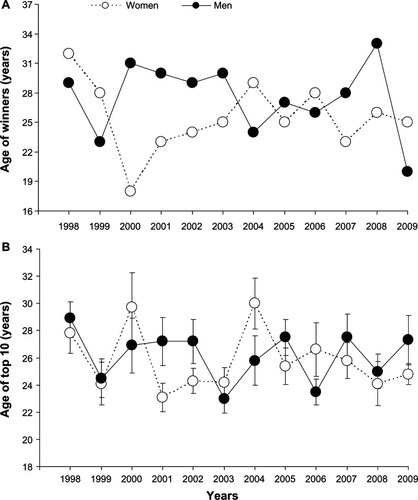
The age distribution of both female and male finishers during the 12-year period is presented in . The 5-year age brackets with the greatest participation were 30–34 years for women and 35–39 years for men. Skaters older than 40 years represented ~41% of male finishers and 23% of female finishers. The changes in the percentage of finishers per age group from 1998 to 2009 for both men and women are shown in . For both men and women, the percentage of finishers decreased over the 13-year period for age groups 20–29 years (men: r = −0.82, P = 0.0011; women: r = −0.70, P = 0.011) and 30–39 years (men: r = −0.87, P = 0.0002; women: r = −0.53, P = 0.075), while it increased for age groups 40–49 years (men: r = 0.95, P = 0.0001; women: r = 0.87, P = 0.0002) and 50–59 years (men: r = 0.86, P = 0.0003; women: r = 0.87, P = 0.0002). The percentage of finishers increased for the men’s age group 60–69 years (men: r = 0.93, P = 0.0001), but remained low and stable for the women’s age group 60–69 years (women: r = −0.57, P = 0.06). The ages of both male and female winners are shown in . The ages of the female winners (25.5 ± 3.6 years) were not significantly different compared to male winners (27.5 ± 3.7 years). Because one-way ANOVA showed no significant difference for the top ten female and male race times between 1998 and 2009, data were pooled together to analyze the age-related changes in skating performances. The mean ages of the top ten placed females and males were 25.8 ± 2.3 years and 26.2 ± 1.8 years, respectively ().
Figure 2 Percentage of female and male finishers per age group over the period 1998–2009.
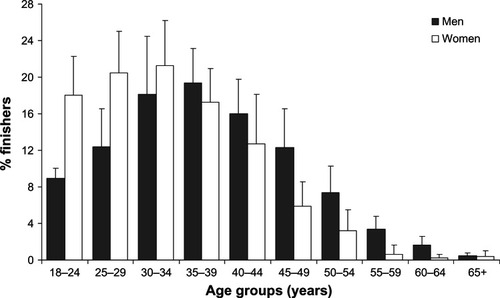
Figure 3 Changes in percentage finishers per age group from 1998 to 2009. (A) Men; (B) Women.
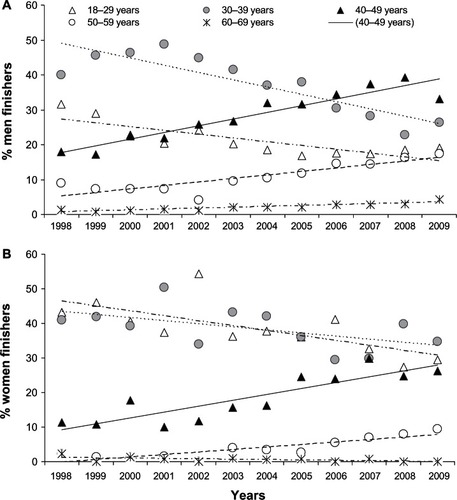
Figure 4 Age of the overall winners and top ten female and male athletes at the Inline One-Eleven from 1998 to 2009. (A) Age of the female and male winners from 1998 to 2009. (B) Mean (±standard error) age of the overall top ten female and male finishers from 1998 to 2009.
Winner and top ten performance trends
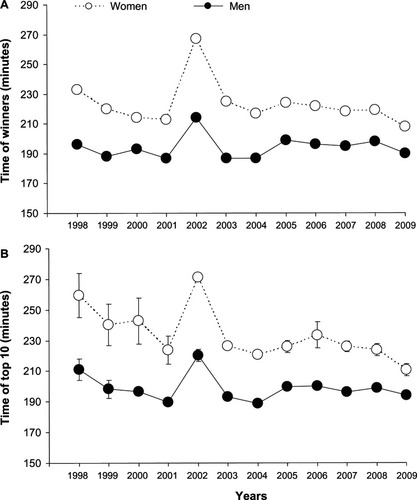
shows the historical performance trends for female and male winners during the studied period. The mean winner race time was 194 ± 8 minutes (range: 187–214 minutes) for men and 223 ± 15 minutes (range: 208–267 minutes) for women. The average time difference between female and male winners over the 1998–2009 period was equal to 15% ± 5% (range: 9%–25%). shows the historical performance trends of the top ten men and women during the 12-year period. The mean top ten race time was 199 ± 9 minutes (range: 189–220 minutes) for men and 234 ± 17 minutes (range: 211–271 minutes) for women. The average time difference between the top ten men and women over the 1998–2009 period was equal to 17% ± 5% (range: 9%–24%).
Figure 5 Performance times of the overall and top ten female and male winners at the Inline One-Eleven from 1998 to 2009. (A) Performance times of the overall female and male winners at the Inline One-Eleven from 1998 to 2009. (B) Mean (±standard deviation) performance times of the overall top ten female and male finishers from 1998 to 2009.
Age-related changes in performance
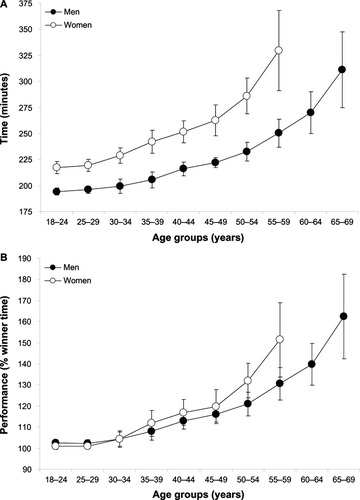
The mean age-related changes for both female and male race times throughout the 1998–2009 period are presented in . The race times increased in a curvilinear manner with advancing age. There was a significant (P < 0.0001) age effect for both female and male race times. No significant difference in time was observed for the three age groups between 18–24 years and 30–34 years for both women and men. For women and men, race time was significantly (P < 0.01) greater for the age group 40–44 years and older when compared to the age groups between 18–24 years and 30–34 years. shows the age-related changes in skating performance expressed as a percentage of the winner race time. Compared to the winner, the oldest female age group (55–59 years) was on average 51% ± 18% slower, while the oldest male age group (65–69 years) was on average 62% ± 20% slower.
Figure 6 Age-related changes in skating performances at the Inline One-Eleven. (A) Age-related changes in skating performances at the Inline One-Eleven. Data were pooled from 1998 to 2009. Values are means ± standard deviations. The best 50 male and 20 female skaters per age group were considered during the 12-year period. For men and women, skating times were significantly greater (P < 0.01) for the age group 40–44 years and older compared to age groups between 18–34 years and 30–34 years. There was no significant difference between the three age groups 18–24 years, 25–29 years, and 30–34 years for both women and men. (B) Age-related changes in skating performances when performance is expressed as a percentage of the winner time.
Discussion
The aims of the present study were to investigate the participation and performance trends of inline skaters competing in the Inline One-Eleven held in Switzerland, which was the longest inline skating race in Europe from 1998 to 2009. The main findings were: (1) that after an initial increase from 1998 to 2003, the overall participation rate in the Inline One-Eleven decreased; (2) the relative participation for skaters older than 40 years increased while it decreased for skaters younger than 40 years over the whole period; and (3) the mean top ten race times remained stable for both men and women.
Participation in Inline One-Eleven
This is the first study to describe the participation and performance trends of inline skaters in an endurance race such as the Inline One-Eleven. In contrast to our hypothesis, the participation in the race increased only in the beginning years of the race; after 2003, the number of participants diminished until the race was cancelled in 2009. The race was discontinued due to the decreasing number of athletes taking part in the race; other reasons included increasing costs and reduced sponsorship. These findings were in contrast to reports on participation trends in other disciplines like marathon running,Citation4,Citation6 ultramarathon running,Citation2,Citation3 and the Ironman triathlon,Citation20,Citation55 where participation is still growing. One reason for the decreased participation in the Inline One-Eleven could be the general diminishing interest in inline skating.Citation56 Later, the so-called “trend sport” of inline skating normalized to a public sport and lost its distinctiveness. The beginning of the 21st century showed shrinking sales volume and a general diminished interest in inline skating, which may be caused by a lack of acceptable roads where inline skating is allowed. Considered pedestrians, inline-skaters had to use walkways for their sport, which were not adequate at all. In 2009, the Swiss Inline Cup consisted of eight inline events held throughout Switzerland.Citation57 Today, a few years later, there are only two of these events left; interestingly, these two events are characterized by a maximum length of 42 km and a very short lap distance.Citation54 There seemed to be a trend towards shorter races, which has also been shown for the Swiss Bike Masters, where the participation showed a dramatic decline since 1998.Citation18,Citation19 In addition, there was a tendency of internationalizing the disciplines, leading to more concurrent races worldwide.Citation58,Citation59 The resulting effect was that the number of races in every country decreased, such that there existed an acceptable level of participation for at least one or two events every year. Another reason was the fact that inline skating races like the Inline One-Eleven were not considered as ultraendurance events due to their duration of less than 6 hours which, like the Ironman triathlon or the 161 km marathon, still exhibit increasing participation.Citation2,Citation6
This decrease in overall participation might have had a considerable influence on the participation among different genders and age groups. Over the 12-year period studied, the percentage of finishers decreased for athletes in age groups 20–29 years and 30–39 years, while it increased for athletes in age groups 40–49 years and 50–59 years for both men and women. The percentage of finishers slightly increased for men in age group 60–69 years and remained low and stable for women in the age group 60–69 years. These changes in participation might have influenced the statistical analyses.
Age of participants and performances
A further important finding was that the participation rates for men and women decreased for athletes in the 20–39-year age group, while participation for athletes in the 40–59-year age group showed a remarkable increase. This was expected because similar results were found for other endurance performances like the marathon and half-marathon.Citation4–Citation6 This could be due to the idea that younger individuals regard endurance sports as leisure activities, and therefore they might quit this type of activity much easier. In contrast, master endurance athletes older than 35 years often practice their endurance sport in order to improve their general physical fitness or to partake in the sport as a health precaution. Older athletes may need more training to achieve their optimal physical condition to take part in an endurance event. Most likely, there must be a greater motivation for athletes to train for an endurance performance event, and therefore the impetus of maintaining the physical status has to be greater. There was a general trend towards an increasing number of healthy aging people in the population being physically able to participate in these events.Citation4
The analysis of the age-related performances exposed several findings. The ages of female and male winners were not significantly different with women aged 25.5 ± 3.6 years and men aged 27.5 ± 3.7 years. The mean age of the top ten women and men across the years remained quite stable at 25.8 ± 2.3 and 26.2 ± 1.8 years, respectively. Similar age patterns were found in marathon running where the top female and male finishers were in their late 20s.Citation60 This was in contrast to the results from ultramarathon races like the 100 km Lauf Biel, where the finishers in the age groups younger than 30 years were slower than finishers in the age groups between 30 and 50 years.Citation50 Other studies regarding ultraendurance performance such as the 161 km marathon also showed faster racing times for older participants aged 30–50 years.Citation2 It seemed that the race times of older participants improved with increasing length of the race.Citation10,Citation48
According to Zaryski and Smith,Citation61 ultraendurance is defined as competitions lasting at least 6 hours, and successful performance relies on long-term preparation, sufficient nutrition, and accommodation of environmental stressors and psychological toughness. It seemed that these demands were met better by older athletes than by younger ones. The athletes had on average less than 6 hours to complete the race, so it is no ultra-endurance race by definition. This was consistent with the finding that the fastest racers were in the age group 20–29 years, and not in the older groups.
Gender differences in participation and performance
Regarding participation, female participation was parallel to male participation across years, irrespective of the high rate of male participation in 2003 and 2004, and the decrease in the last years of the race. The rate of female participants was quite stable at ~16% of all skaters over the 12-year period. This is in contrast to existing reports about participation in ultraendurance races, where the participation of women and older athletes increased across years.Citation2,Citation3 This could be due to the fact that the Inline One-Eleven was not an ultraendurance race.
The highest number of female finishers during the whole 12-year period was observed in the age group 30–34 years, which was quite similar to male participation where the largest group was the age group 35–39 years. Data about the Western States 100 Mile Endurance Run showed the largest participation in the age group 40–44 years for both genders. The percentage of skaters older than 40 years of age was 41% for men and 23% for women. Regarding the percentage of finishers per age group, there was no remarkable difference between women and men. Comparing the ages of male and female winners, there was no significant difference between women aged 25.5 ± 3.6 years and men aged 27.5 ± 3.7 years. Additionally, no difference was apparent in the mean age of the top ten women and top ten men with ages of 25.8 ± 2.3 years and 26.2 ± 1.8 years, respectively.
We also compared the winners and the top ten performances of women and men. The mean winner race time for men was 194 ± 8 minutes and 223 ± 15 minutes for women, which means an average time difference between men and women winners of 15% ± 5% over the studied period. The investigation of the top ten winning times of men and women demonstrated similar results. In running disciplines, females were slower than males and the gender difference increased with increasing race distance.Citation26 Comparing the winner times since 2003, the reduction of the gap between the males and females indicates that females showed better improvement than their male counterparts and probably would have outpaced men in the long run.
Limitations
This cross-sectional data analysis is limited due to the lack of inclusion of training characteristics,Citation44 previous experience,Citation45 anthropometric characteristics,Citation42 aspects of equipment,Citation43 and influence of weather and environmental conditions in the analysis.Citation12,Citation53 Some athletes might have participated in the race several times across different years, and the inclusion of repeated athletes might have had an influence on the statistical analysis. The nonfinishers were not included due to missing data for nonfinishers in the race results. The inclusion of nonfinishers would give an insight as to whether more women than men were not able to finish the race, and whether more older than younger athletes were among the nonfinishers.Citation62
Conclusion
To summarize, overall participation in a long-distance inline skating race such as the Inline One-Eleven decreased, while participation of master athletes increased during the 12-year period. The female participation rate of 16.5% ± 2.2% and the gender difference in performance of 17% ± 5% for the annual top ten women and men remained stable. The mean age of the top ten female and male runners was ~26 years, which was similar to recent findings in marathon and half-marathon distance performances. The race times of the best female and male skaters stabilized across years. The decrease in overall participation was an unexpected finding. Inline skating events with national and international championships are still taking place all over the world. The standard distance for international races is 42 km, with shorter courses increasing in popularity. Further studies should focus on the participation in the international World Inline Cup races. To date, the majority of studies are focusing on injuries related to inline skating. A comparison of participation in nontraditional endurance races such as inline skating and mountain-biking would also be of interest.
Disclosure
The authors report no conflicts of interest in this work.
References
- BurfootAThe history of the marathon: 1976-presentSports Med2007374–528428717465589
- HoffmanMDOngJCWangGHistorical analysis of participation in 161 km ultramarathons in North AmericaInt J Hist Sport201027111877189120684085
- HoffmanMDWegelinJAThe Western States 100-Mile Endurance Run: participation and performance trendsMed Sci Sports Exerc200941122191219819915499
- JoklPSethiPMCooperAJMaster’s performance in the New York City Marathon 1983–1999Br J Sports Med200438440841215273172
- LeykDErleyORidderDAge-related changes in marathon and half-marathon performancesInt J Sports Med2007286513517
- LepersRCattagniTDo older athletes reach limits in their performance during marathon running?Age (Dordr)2012343773781
- ZinggMAKnechtleBRüstCARosemannTLepersRReduced performance difference between sexes in master mountain and city marathon runningInt J Gen Med20136267275
- EichenbergerEKnechtleBRüstCARosemannTLepersRAge and gender interactions in mountain ultramarathon running – the Swiss Alpine MarathonOpen Access Journal of Sports Medicine201237380
- ZinggMRüstCARosemannTLepersRKnechtleBMaster runners dominate the 24-hour ultra-marathons worldwide – a retrospective data analysis from 1998 to 2011Extreme Physiology and Medicine
- ZinggMAKnechtleBRüstCARosemannTLepersRAnalysis of participation and performance in athletes by age group in ultramarathons of more than 200 km in lengthInt J Gen Med20139620922010.2147/IJGM.S43454
- EichenbergerEKnechtleBChristophARKnechtlePLepersRRosemannTNo gender difference in peak performance in ultraendurance swimming performance – analysis of the ‘Zurich 12-h Swim’ from 1996 to 2010Chin J Physiol2012555346351
- EichenbergerEKnechtleBKnechtlePSex difference in open-water ultra-swim performance in the longest freshwater lake swim in Europe: sex difference in ultra-swimmingJ Strength Cond Res Epub6282012
- EichenbergerEKnechtleBKnechtlePRüstCARosemannTLepersRBest performances by men and women open-water swimmers during the ‘English Channel Swim’ from 1900 to 2010J Sports Sci2012301212951301
- FischerGKnechtleBRüstCARosemannTMale swimmers cross the English Channel faster than female swimmersScand J Med Sci Sports2013231e48e5523121394
- RüstCAKnechtleBRosemannTLepersRMen cross America faster than women – the ‘Race Across America’ (RAAM) from 1982 to 2012Int J Sports Physiol Perform Epub2202013
- ZinggMKnechtleBRüstCARosemannTLepersRAge and gender difference in non-drafting ultra-endurance cycling performance – the ‘Swiss Cycling Marathon’Extreme Physiology and Medicine
- Abou ShoakMKnechtleBKnechtlePRüstCARosemannTLepersRParticipation and performance trends in ultracyclingOpen Access Journal of Sports Medicine201244151
- GloorRKnechtleBKnechtlePSex-related trends in participation and performance in the ‘Swiss Bike Masters’ from 1994–2012Percept Mot Skills
- HauptSKnechtleBKnechtlePRüstCARosemannTLepersRThe age-related performance decline in ultraendurance mountain bikingRes Sports Med201321214615823541101
- LepersRAnalysis of Hawaii ironman performances in elite triathletes from 1981 to 2007Med Sci Sports Exerc200840101828183418799994
- LepersRKnechtleBKnechtlePRosemannTAnalysis of ultratriathlon performancesOpen Access Journal of Sports Medicine201120112131136
- KnechtleBKnechtlePLepersRParticipation and performance trends in ultra-triathlons from 1985 to 2009Scand J Med Sci Sports2011216e82e9020626703
- WhippBJWardSAWill women soon outrun men?Nature19923556355251731197
- SparlingPBO’DonnellEMSnowTKThe gender difference in distance running performance has plateaued: an analysis of world rankings from 1980 to 1996Med Sci Sports Exerc19983012172517299861606
- TatemAJGuerraCAAtkinsonPMHaySIAthletics: momentous sprint at the 2156 Olympics?Nature2004431700852515457248
- CoastJRBlevinsJSWilsonBADo gender differences in running performance disappear with distance?Can J Appl Physiol200429213914515064423
- HoffmanMDPerformance trends in 161-km ultramarathonsInt J Sports Med2010311313720029736
- LeykDErleyOGorgesWPerformance, training and lifestyle parameters of marathon runners aged 20–80 years: results of the PACE-studyInt J Sports Med200930536036519277939
- WrightVJPerricelliBCAge-related rates of decline in performance among elite senior athletesAm J Sports Med200836344345018055922
- TrappeSMarathon runners: how do they age?Sports Med2007374–530230517465594
- TanakaHSealsDREndurance exercise performance in Masters athletes: age-associated changes and underlying physiological mechanismsJ Physiol20085861556317717011
- LepersRSultanaFBernardTHausswirthCBrisswalterJAge-related changes in triathlon performancesInt J Sports Med201031425125620166005
- BakerABTangYQAging performance for masters records in athletics, swimming, rowing, cycling, triathlon, and weightliftingExp Aging Res201036445347720845122
- BernardTSultanaFLepersRHausswirthCBrisswalterJAge-related decline in olympic triathlon performance: effect of locomotion modeExp Aging Res2010361647820054727
- EtterFKnechtleBRüstCARosemannTLepersRThe age-related decline in Olympic distance triathlon performance differs between males and femalesJ Sports Med Phys Fitness
- KnechtleBRüstCAKnechtlePRosemannTLepersRAge-related changes in ultra-triathlon performancesExtreme Physiology and Medicine201215
- EtterFKnechtleBBukowskiARüstCARosemannTLepersRAge and gender interactions in short distance triathlon performanceJ Sports Sci Epub1282013
- ReaburnPDascombeBEndurance performance in masters athletesEur Rev Aging Phys Act200853142
- FlegJLLakattaEGRole of muscle loss in the age-associated reduction in VO2 maxJ Appl Physiol1988653114711513182484
- FuchiTIwaokaKHiguchiMKobayashiSCardiovascular changes associated with decreased aerobic capacity and aging in long-distance runnersEur J Appl Physiol Occup Physiol19895888848892504587
- HagbergJMEffect of training on the decline of VO2 max with agingFed Proc1987465183018333556603
- KnechtleBKnechtlePRosemannTLepersRIs body fat a predictor of race time in female long-distance inline skaters?Asian J Sports Med20101313113622375200
- KnechtleBKnechtlePRosemannTA paradigm for identifying ability in competition: the association between anthropometry, training and equipment with race times in male long-distance inline skaters–the ‘Inline One Eleven’Human Movement2011122171179
- KnechtleBKnechtlePRüstCASennORosemannTLepersRPredictor variables of performance in recreational male long-distance inline skatersJ Sports Sci201129995996621574098
- KnechtleBKnechtlePRüstCARosemannTLepersRAge, training, and previous experience predict race performance in longdistance inline skaters, not anthropometryPercept Mot Skills2012114114115622582684
- Georgia International Road SkatingAthens to Atlanta Road Skate [homepage on the Internet]Atlanta, GAGeorgia International Road Skating Available from: http://www.a2a.netAccessed March 9, 2013
- KnothCKnechtleBRüstCARosemannTLepersRParticipation and performance trends in multistage ultramarathons – the ‘Marathon des Sables’ 2003–2012Extreme Physiology and Medicine2012113
- DaFonseca-Engelhardt KKnechtleBRüstCAKnechtlePLepersRRosemannTParticipation and performance trends in ultra-endurance running races under extreme conditions – ‘Spartathlon’ versus ‘Badwater’Extreme Physiology and Medicine
- RüstCAKnechtleBRosemannTLepersRAnalysis of performance and age of the fastest 100-miles ultra-marathoners worldwideClinics (Sao Paulo)In press
- KnechtleBRüstCARosemannTLepersRAge-related changes in 100-km ultra-marathon running performanceAge (Dordr)20123441033104521796378
- LepersRStapleyPJKnechtleBGender differences in wheelchair marathon performance – Oita International Wheelchair Marathon from 1983 to 2011Open Access Journal of Sports Medicine201220123169174
- LepersRStapleyPJKnechtleBAnalysis of marathon performances of disabled athletesMovement and Sport Sciences
- RüstCAKnechtleBKnechtlePGender difference and age-related changes in performance at the long distance duathlonJ Strength Cond Res201327229330122450258
- KnechtleBRüstCARosemannTLepersRAge and gender differences in half-Ironman triathlon performances – the Ironman 70.3 Switzerland from 2007 to 2010Open Access Journal of Sports Medicine201235966
- LepersRMaffiulettiNAAge and gender interactions in ultraendurance performance: insight from the triathlonMed Sci Sports Exerc201143113413921169751
- For the sport of rollerblading, it’s inline and in decline [webpage on the Internet]Newark, DEThe Review, University of Delaware2011 Available from: http://www.udreview.com/editorial/for-the-sport-of-rollerblading-it-s-inline-and-in-decline-1.1972265#.UTr4jjdWKVoAccessed March 9, 2013
- Iguana Marketing AGSwiss Inline Cup [webpage on the Internet]DübendorfIguana Marketing AG2010 Available from: http://www.swiss-inline-cup.ch/Accessed March 9, 2013
- Inline Planet [homepage on the Internet]Inline Planet Available from: http://www.inlineplanet.comAccessed March 12, 2013
- WilliamsCNorth American inline skating marathons: find a marathon that is just right for you [webpage on the Internet]New York, NYAbout.com Available from: http://inlineskating.about.com/od/competitiveinlineskating/tp/northam_marathons.htmAccessed March 12, 2013
- HunterSKStevensAAMagennisKSkeltonKWFauthMIs there a sex difference in the age of elite marathon runners?Med Sci Sports Exerc201143465666420881885
- ZaryskiCSmithDJTraining principles and issues for ultra-endurance athletesCurr Sports Med Rep20054316517015907270
- KnechtleBKnechtlePRüstCARosemannTLepersRFinishers and nonfinishers in the ‘Swiss Cycling Marathon’ to qualify for the ‘Race Across America’J Strength Cond Res201125123257326322080313