Abstract
Aim
The aim of the study was to examine finisher and performance trends of ultrarunners in the Marathon des Sables, the world’s largest multistage ultramarathon.
Methods
The age and running speed was analyzed for 6945 finishes of 909 women and 6036 men between 2003 and 2012 at the Marathon des Sables covering about 240 km in the Moroccan desert.
Results
The number of finishes increased significantly for both women and men from 2003–2012. The annual number of finishes increased in age groups: 30–34 years (r2 = 0.50; P = 0.021), 45–49 years (r2 = 0.81; P = 0.0004), and 50–54 years (r2 = 0.46; P = 0.029) for women and in all age groups older than 35 years for men (35–39 years: r2 = 0.64, P = 0.0054; 40–44 years: r2 = 0.67, P = 0.0036; 45–49 years: r2 = 0.77, P = 0.0007; 50–54 years: r2 = 0.72, P = 0.0018; 55–59 years: r2 = 0.42, P = 0.041; and 60–64 years: r2 = 0.67, P = 0.0038). The fastest running speed was achieved by runners in the age group of 35–39 years for both sexes. The mean age of overall finishers was 41.0 ± 9.1 years for women and 41.3 ± 9.5 years for men. For men, running speed improved for athletes in the age group of 35–39 years (r2 = 0.44; P = 0.036) and of 40–44 years (r2 = 0.51; P = 0.019), while it decreased for athletes in the age group of 30–34 years (r2 = 0.66, P = 0.0039). For women, running speed remained stable during the study period for athletes in all age groups.
Conclusion
These data suggest that the number of finishers of masters runners older than 40 years increased for both sexes at the Marathon des Sables, as has been previously observed for single-stage ultramarathons. In contrast to women, men aged 35 to 44 years improved running speed during the study period. Future studies are needed to investigate the reasons for the growing numbers of masters athletes in endurance sports and their improvement in performance.
Introduction
Any running event over a distance longer than the classic marathon distance of 42.195 kilometers is defined as an ultramarathon.Citation1 Ultramarathon running has become increasingly popular with a growing number of participants since the late 1980s.Citation2–Citation4 Several studies investigated the influence on the performance of ultramarathon runners of different aspects, such as anthropometry,Citation5–Citation7 training characteristics,Citation8,Citation9 sex,Citation10 and age.Citation4 Regarding age as a limiting variable for endurance performance, an increased number of participating masters athletes (age >40 years) in marathonsCitation11,Citation12 and ultramarathonsCitation2–Citation4 has been reported. In the Western States 100-Mile Endurance Run, the participation of masters runners increased between 1974 and 2007, and the mean age of male finishers increased from 41 to 45–47 years over this period.Citation2
Considering performance and age, a slow decline in senior athletes’ performance from the age of 50 years and older was detected, and from the age of 75 years, a dramatic decline was demonstrated for track and field events in the National Senior Olympic Games held in 2001.Citation13 The age-related decline in running performance correlated with changes of physiological and morphological characteristics with increasing age.Citation14,Citation15 Nevertheless, regarding endurance events, in general Masters athletes improved both their endurance and their ultraendurance performance over time in the New York City MarathonCitation12 and in the Hawaiian Ironman Triathlon.Citation16 Individual athletes improved their performance and the cohort of the Masters athletes’ section recorded faster times. This could be due to individual performance improvements, or more likely, to the increasing popularity of running and the events in question, raising the quality of the field where faster individuals are substituting the slower individuals.
An influence of age on running times has also been demonstrated for both sexes in ultramarathons.Citation4 Due to the increased number of participating masters athletes in the Western States 100-Mile Endurance Run, the age of the top performers increased for both sexes over time.Citation2 Men achieved their fastest running times at the age of 30–49 years.Citation2 In the Swiss Alpine Marathon, a 78 km mountain ultramarathon held in Davos, Switzerland, an increased age for the fastest running times for both sexes was found.Citation17 From 1998 to 2011, the age for the fastest running times increased for men from 34 to 38 years and for women from 32 to 39 years.Citation17
The reported data about finisher rates and performance trends of masters athletes refer predominantly to single-stage endurance and ultraendurance events with a nonstop racing time.Citation11,Citation12,Citation16,Citation17 The requirements of the athletes in multistage races are different, particularly regarding the total length of the race and that the time available for recovery is only overnight. A few studies investigated the age-related finisher rates and performance trends in multistage races, such as the Marathon des Sables, a multistage ultramarathon over a distance of about 240 km through the Moroccan desert.Citation18 Abou Shoak et al investigated finisher rates and performance trends in multistage ultramarathons held between 1992 and 2010 around the world.Citation19 They found that the Marathon des Sables attracted the most multistage ultramarathoners worldwide. There has been one study investigating the finisher rates and performance trends at the Marathon des Sables focusing on nationality and sex.Citation20 Knoth et al reported that the number of finishes increased for both sexes over time and that most participants originated from Europe.Citation20 Men were faster than women with a higher sex difference compared to results from single-stage endurance races.Citation20 It is of interest whether the different requirements of multistage compared with single-stage endurance races affect not only the sex-related, but also the age-related performance trends.
The aim of the present study is to investigate finisher rates and performance trends of runners in different age groups in the multistage ultramarathon Marathon des Sables between 2003 and 2012. Regarding existing literature about single-stage ultramarathons, we hypothesized an increase in the number of finishes and an improvement in the performance of masters runners, also in the world’s largest multistage ultramarathon.
Materials and methods
All finishes in the Marathon des Sables between 2003 and 2012 were included in an analysis of age, sex, and running speed. The data set for this study was obtained from the website of the race.Citation18 Data before 2003 were not available. All procedures used in the study met the ethical standards of the Swiss Academy of Medical SciencesCitation21 and were approved by the Institutional Review Board of Kanton St Gallen, Switzerland, with a waiver of the requirement for informed consent of the participants, given the fact that the study involved the analysis of publicly available data.
The race
The Marathon des Sables is an annually held multistage ultramarathon over a distance of about 240 km through the Moroccan desert.Citation18 The number, lengths, and route of the stages have changed every year since the first event in 1986. During the whole competition, the participants have to carry their own equipment, including food and sleeping gear except for water, which is restricted by the organization dependent on the stage distance.Citation18 The minimum weight for the equipment is 6.5 kg, and the maximum weight is 15 kg, not including water. The athletes have to carry food containing a minimum of 2000 calories per day. During the race, the mean daytime temperature is 30°C, and at night, it is 14°C.Citation18 The minimum age for participation is 18 years. To participate, the competitors must hold a medical certificate including a resting electrocardiogram, obtained not more than 30 days before the start of the race.Citation18
Data analysis
Due to the changing number of stages and the changes in stage length, running speed was calculated over the whole competition to determine the performance of the athletes. For the analysis of the change in running speed in both sexes and the change in sex difference across years, the results of the annual top 25 female and male finishers were pooled and analyzed. The top 25 finishers were chosen to have study groups that are large enough to find reliable results. For the analysis of the age-related finisher and performance trends, the annual performance of the top five female and male finishers were pooled and analyzed. An additional inclusion criterion was at least five finishes in at least 9 out of the 10 years. The age group had to have at least five representatives in at least 9 out of 10 years with possibly different individuals. The analysis was not following individuals through time, but following trends in the cohorts potentially with different individuals each year. For women, all age groups between 25–29 years and 50–54 years and for men all age groups between 18–24 years and 60–64 years fulfilled the inclusion criteria. To examine the age-related trends, the finishes were categorized in age groups 18–24, 25–29, 30–34, 35–39, 40–44, 45–49, 50–54, 55–59, 60–64, 65–69, 70–74, and 75–79 years.
Statistical analysis
To increase the reliability of data analysis, each data set was tested for normal distribution as well as for homogeneity of variances in advance of statistical analyses. Normal distribution was tested using a D’Agostino–Pearson omnibus normality test and homogeneity of variances was tested using a Levene’s test in the case of two groups and with a Bartlett’s test in the case of more than two groups. To test for significant changes in the development of a variable across the years, linear regression was used. A Student’s t-test was performed in the case of two groups, to test for differences between the numbers of women and men, the age of all female and male participants, and between the age of the top 25 women and men, per year. A one-way analysis of variance with subsequent Tukey–Kramer post hoc analysis was performed in the case of more than two groups to test for differences between the numbers of participants and the performance in age groups. Statistical analyses were performed using IBM Statistical Package for the Social Sciences Statistics (Version 19, IBM SPSS, Chicago, IL, USA) and GraphPad Prism (Version 5, GraphPad Software, Inc, La Jolla, CA, USA). Significance was accepted at P < 0.05 (two-sided for t-tests). Data in the text are given as mean ± standard deviation.
Results
Overall finisher trends
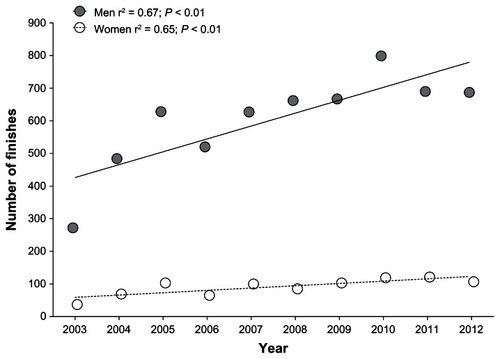
Data from 6945 finishes, including 909 women and 6036 men, have been analyzed from the Marathon des Sables between 2003 and 2012. The number of finishes increased from 37 (2003) to 107 (2012) for women and from 272 (2003) to 687 (2012) for men. Men showed, with a mean number of 603.6 ± 146.2 finishes, a higher number of finishes than women, with a mean number of 90.9 ± 26.7 finishes (P < 0.0001). During the study period, the mean percentage of female finishers was 13.0% ± 1.2%. Both women and men showed an increase in the number of finishes ().
Figure 1 Changes in the number of male and female finishers across the years.
Finisher trends of the different age groups
For both sexes, the age group 40–44 years showed the greatest number of finishes during the study period (). Regarding the number of finishes per age group, an increased number of finishers of masters runners was recorded for both sexes (). The annual number of female finishers increased in age groups 30–34, 45–49, and 50–54 years (). In men, the annual number of finishers increased in age groups 35–39, 40–44, 45–49, 50–54, 55–59, and 60–64 years ().
Figure 2 Total numbers of male and female finishers per age group during the investigated 10-year period.
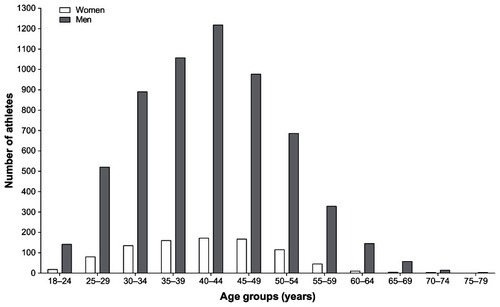
Figure 3 Change in the number of finishes per age group during the study period for women (A) and men (B).
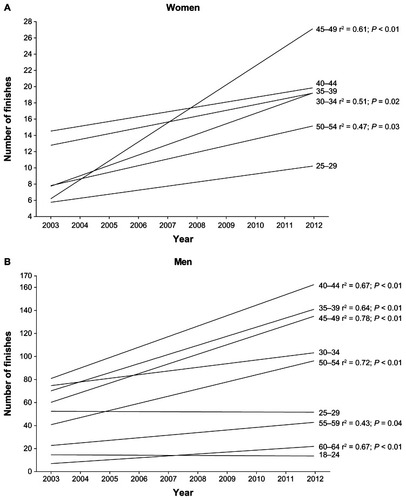
Table 1 Change in the number of female and male finishers per age group
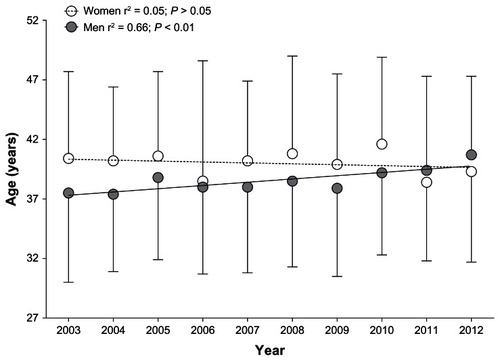
Age trends of the finishers
Over time, the mean age remained unchanged in both sexes (). The mean age of overall finishers was 41.0 ± 9.1 years for women and 41.3 ± 9.5 years for men. There was no difference in the overall mean age between women and men (P > 0.05). Regarding the annual overall finishers, men (38.5 ± 7.1 years) were significantly younger than women (39.9 ± 7.5 years; P = 0.005). The annual top 25 men showed an increase in age (r2 = 0.66; P = 0.0042), whereas the mean age of the annual top 25 women remained unchanged ().
Figure 4 Changes in the mean age of all male and female finishers during the study period.
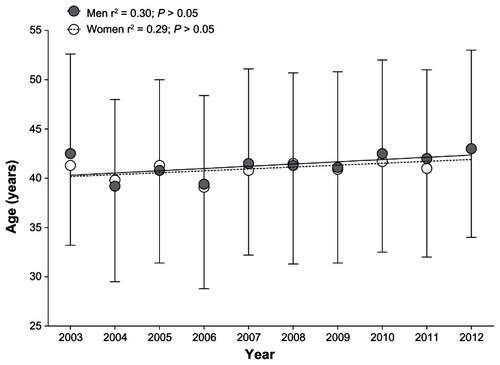
Figure 5 Changes in the mean age of the annual top 25 male and female finishers during the study period.
Changes in running speed for different age groups
presents the changes in running speed for female and male runners over the years from 2003–2012. An increase in running speed could not be observed in any age group for females (). Regarding the annual top five female finishers in each age group, runners in the 25–29 years age group had a mean speed of 5.3 ± 0.7 km per hour slower (P < 0.05) than runners in all other age groups, except for the top five female finishers in the 50–54 year old age group with a mean running speed of 5.9 ± 0.6 km per hour. The runners in the 35–39 years age group with a mean speed of 7.3 ± 0.8 km per hour were significantly faster (P < 0.05) than runners in the 45–49 years and 50–54 years age groups. In women, the top five finishers in each age group did not reach a significantly faster running speed than the other age groups. There was no improvement in the running speed within the different female age groups over the observed time period.
Figure 6 Changes in running speed of the top five athletes per age group for women (A) and for men (B).
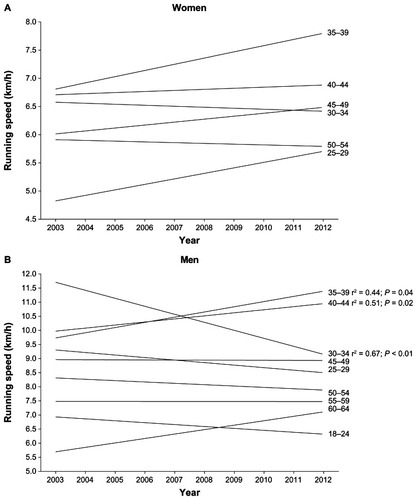
Table 2 Change in running speed of female and male finishers per age group
Regarding the annual top five male finishers in each age group, runners in the age group of 18–24 years had a mean speed of 6.6 ± 0.7 km per hour significantly slower (P < 0.05) than runners in the other age groups, except for the top five male finishers in the age groups of 55–59 and 60–64 years. Finishers in the age group of 30–34 years became slower during the study period and those in the age group of 35–39 and 40–44 years became faster during the observed 10-year period (). Again, no single age group of the annual top five male finishers reached a significantly faster running speed than the others.
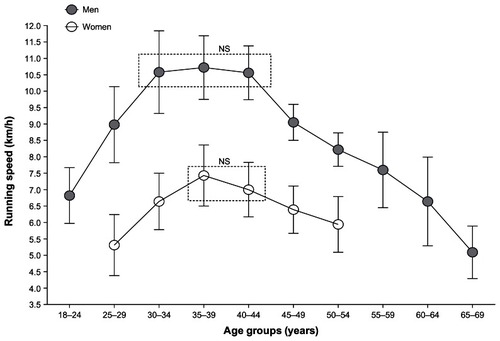
Age of fastest running speed
Regarding the top 25 male and female finishers, for both sexes, the fastest running speed was reached by athletes in age group 35–39 years for women with a mean running speed of 7.4 ± 0.9 km per hour and for men with a mean running speed of 10.7 ± 1.0 km per hour. In women, the age group with the fastest running speed was not significantly different from that of the 40–44 year old age group with a mean running speed of 7.0 ± 0.8 km per hour. In men, the fastest running speed was not significantly different from that of the 30–34 year old age group with a mean running speed of 10.6 ± 1.3 km per hour, or from that of the 40–44 year-old-age group with a mean running speed of 10.6 ± 0.8 km per hour ().
Figure 7 Mean (±SD) performance of the best 25 male and female finishers per age group during the 2003–2012 period.
Abbreviations: SD, standard deviation; NS, not significant.
Discussion
The aim of this study was to investigate finisher rates and performance trends of runners in different age groups competing in the multistage ultramarathon Marathon des Sables between 2003 and 2012. Based upon existing literature we hypothesized that there would be an increase in finishers and an improvement in the performance of masters runners over this time period. The main findings were: (1) an increase in finishers over the studied period for both sexes; (2) an increase in the number of finishers for masters runners (≥40 years) for both sexes during the study period; (3) an improvement in running speed for men in age group 35–44 years; and (4) the fastest running speed was achieved at the age of 35–44 years for women and 30–44 years for men.
Growing number of participants and masters runners
The first important finding was an increased number of finishers for both women and men. Within the investigated 10-year period the number of finishers increased by 289% for women and by 252% for men, whereas the mean number of male finishers was higher than that of the females. A growing number of participants in ultramarathon running over the years has been previously described for single-stage endurance events in the Western States 100-Mile Endurance Run in the USACitation2 and in the 100 km Lauf Biel in Switzerland.Citation4 Apart from these trends reported for single races, the number of participants increased in longer ultramarathons, such as the Badwater Ultramarathon and the Spartathlon Ultra Race,Citation22,Citation23 and in time-limited races, such as 24-hour ultramarathons.Citation24
The increase in participants in the Marathon des Sables might also be due the showcase of the race in the media. The Marathon des Sables is ranked by the Discovery Channel as the “toughest footrace on earth.”Citation25 Another website ranks the Marathon des Sables at fourth position behind the Yukon Arctic Ultra, Badwater Ultramarathon, and Antarctica Marathon.Citation26 Several websites that report up to date information on ultramarathon running and race reports.Citation27–Citation29 Another potential explanation for the increase in participants could be due to the increase in the general population over time. Knoth et al showed that most of the participants in the Marathon des Sables originated from European countries, such as France and the UK.Citation20 The general population increase was important to the results, as was the economic background of the Marathon des Sables’ participants; the entry fee is very high.Citation20
The race seemed to have enjoyed an above-trend participation rate in 2005 and 2010. These milestone years could explain an increase in participation most probably due to an increased presence in mass media, such as EurosportCitation30 or YouTube.Citation31 The below-trend decline in 2006 and 2011 – and to some extent also in 2012 – might be explained by the fact that potential racers were looking for new challenges. These athletes may compete in other races or other challenges, such as the Yukon Arctic Ultra,Citation32 the Jungle Ultra Marathon,Citation33 the Badwater Ultramarathon,Citation22,Citation23 the Iditarod Trail International,Citation34 or The Barkley Marathons.Citation35
The male/female ratio of the number of finishers in endurance running events with a lower number of female finishers has been previously reported for the New York City Marathon.Citation12 This phenomenon might be caused by the fact that women started participating in ultramarathons later than men did, showing an increase in the number of finishers in recent years.Citation2 Evolutionary psychology could be another explanation for the male dominance in sports.Citation36 A sex difference in enduring competitiveness has already been investigated, in which it was postulated that men have a greater training motivation.Citation37
Women significantly increased their number of finishers in the Marathon des Sables in age groups 30–34 and 45–54 years over the investigated time period. Men increased the number of finishers in all age groups from 35 to 64 years. For women, similar results were reported in a short distance triathlon, the Zürich Triathlon, with an increased number of finishers of female triathletes aged from 40 to 54 years.Citation38 Our findings regarding this increased number of finishers for masters runners and the increased age of the top 25 male finishers during the study period corresponds to previous findings for single-stage events. At the Western States 100-Mile Endurance Run, an increased number of finishers of masters runners over the years and increasing ages of the top performers for both sexes has been shown.Citation2 Similar results were reported for the New York City Marathon.Citation12 This increased number of masters finishers in ultramarathons could be explained by the increasing life expectancyCitation39 and the growing proportion of elderly people in our society,Citation40 but further studies are needed.
Improved running speed of male masters runners
Male masters runners in the age group 40–44 years improved running speed over the study period in the Marathon des Sables. This improvement of masters athletes’ performance is in accordance with reported data for single-stage endurance events. Masters athletes also improved performance over the years in the New York City MarathonCitation12 and in the Hawaiian Ironman Triathlon.Citation16 A possible reason for this improved performance of masters runners could be their greater competition experience with ultraendurance events.Citation9 Similarly, for long-distance inline skaters, it has been shown that previous experience can be used as an important predictor for race performance.Citation41 Masters athletes may have better opportunities to recover from races since they compete less than younger athletes. In addition, the higher participation of masters athletes over the years increases the opportunity for improved performance. Further studies are needed to investigate the reasons for the improved performance of masters athletes over the years.
In the Marathon des Sables, only male masters athletes in the age group of 40–44 years improved their performance, while the performance of the older masters athletes in the age groups between 45 and 64 years remained stable. Changes of body composition with aging have been previously described, such as a decreased skeletal muscle mass,Citation42 a decreased fat-free mass, a decreased appendicular skeletal muscle mass, a decreased body cell mass, and a decreased total body potassium with increasing age.Citation43 These age-related changes are described to be associated with decreased performance where a positive correlation between body fat and race times in masters half-marathonersCitation44 and between body mass and race performance in ultraendurance runners have been shown.Citation6 In addition, Tanaka and Seals reported on the decreased VO2 max with aging and on the association with a decline in endurance running performance.Citation45 The impact of these age-related physiological changes on masters athletes’ performance might be greater in the multistage Marathon des Sables when compared with other single-stage ultramarathons, due to the higher requirements on the athletes. Accordingly, a correlation between marathon running performance and air temperature has been shown where running speed decreased with increasing ambient temperature.Citation46 Reasons why athletes aged older than 45 years were unable to improve their performance could include the greater total length of the race and the reduced opportunities for recovery time during the race. In addition, an association between training volume and performance in ultramarathons was described by Knechtle et al.Citation8 Another explanation for our finding could be the lower training volumes of masters endurance athletes compared to their younger colleagues.Citation14
Only male masters athletes in the Marathon des Sables could improve their performance, while the performance of female masters athletes remained stable. This phenomenon could be explained by sex differences, for example, women having a smaller VO2 maxCitation47 and numerous other sex differences regarding the anatomy, physiology, biomechanics, and psychology, as described by Lynch and Hoch.Citation48 In the Marathon des Sables with its multiple stages, the impact of these sex differences on performance could be potentially greater, resulting in only male athletes being able to improve their performance over the study period.
Age of peak performance
The age range of athletes with the fastest running speed in the Marathon des Sables was 35–44 years for women and 30–44 years for men, similar to those found in other single-stage ultramarathons, such as the 100 km Lauf Biel, with an age spread of 30–49 years.Citation4 In slight contrast, Hoffman and Fogard reported that the mean age of peak performance for 161 km ultramarathoners was about 45 years.Citation49 Due to the higher requirements of the multistage Marathon des Sables, being younger than 45 years could be beneficial for achieving the fastest running times. Accordingly, Graham et al found an increased fatigue and reduced vigor for athletes during a desert ultramarathon.Citation50 Due to the age-related decline of VO2 max, which is described to be strongly associated with decreased performance,Citation45 being younger than 45 years could also be beneficial for reaching peak performance in the Marathon des Sables. Furthermore, an increase in the body mass index with aging in the general population has been reported.Citation51 Another possible explanation for the superiority of the younger athletes regarding the fastest running speed could be the lower body mass index when compared with masters athletes, which has been described to be associated with a faster performance time in ultramarathoners.Citation5 An explanation for the finding that athletes older than 30 years reached the fastest running times could be their greater experience with competing in ultraendurance events.Citation9 Accordingly, a high training volume is described as being more important for a faster performance than anthropometric variables.Citation8
Limitations and implications for future research
This study is limited due to the inability to include some factors such as anthropometric parameters,Citation5,Citation6,Citation52 training characteristics,Citation8,Citation9 origin of the athletes,Citation19,Citation20,Citation53,Citation54 nutrition,Citation55–Citation57 overuse injuries,Citation58,Citation59 motivation,Citation60 heat,Citation46,Citation61 and previous experience in ultraendurance events.Citation9,Citation41 Also, the effect of meteorological conditions on the running speed could be of interest.Citation46,Citation52,Citation62 To increase the validity of the comparison between sex differences, higher numbers of female athletes are needed. More data for further statistical analyses are needed to investigate the influence of environmental conditions on the running speed.
Conclusion
In the multistage Marathon des Sables, an increase in the annual number of finishes in age groups 30–34 and 45–54 years for women and in all age groups older than 35 years for men was shown. As reported in the current literature for single-stage ultramarathons, the number of finishers of masters runners older than 40 years increased for both sexes and male masters runners improved their running speed. In contrast to women, men aged 35–44 years had improved running speed. Further studies are needed to investigate finisher and performance trends of masters athletes in other multistage ultraendurance sports and to investigate the reasons for the growing number of masters athletes and their improvement in performance.
Disclosure
The authors declare no conflicts of interest in this work.
References
- GoddenKUltramarathon running resource [homepage on the Internet]Buckinghamshire, UKULTRAmarathonRunning.com2013 Available from: http://www.ultramarathonrunning.com/Accessed October 22, 2012
- HoffmanMDWegelinJAThe Western States 100-Mile Endurance Run: participation and performance trendsMed Sci Sports Exerc200941122191219819915499
- HoffmanMDOngJCWangGHistorical analysis of participation in 161 km ultramarathons in North AmericaInt J Hist Sport201027101877189120684085
- KnechtleBRüstCARosemannTLepersRAge-related changes in 100 km ultramarathon running performanceAge (Dordr)20123441033104521796378
- HoffmanMDAnthropometric characteristics of ultramarathonersInt J Sports Med2008291080881118401807
- KnechtleBDuffBWelzelUKohlerGBody mass and circumference of upper arm are associated with race performance in ultraendurance runners in a multistage race – the Isar Run 2006Res Q Exerc Sport200980226226819650392
- RüstCAKnechtleBKnechtlePRosemannTSimilarities and differences in anthropometry and training between recreational male 100 km ultramarathoners and marathonersJ Sports Sci201230121249125722724447
- KnechtleBWirthAKnechtlePRosemannTTraining volume and personal best time in marathon, not anthropometric parameters, are associated with performance in male 100 km ultrarunnersJ Strength Cond Res201024360460920145568
- KnechtleBKnechtlePRosemannTLepersRPersonal best marathon time and longest training run, not anthropometry, predict performance in recreational 24-hour ultrarunnersJ Strength Cond Res20112582212221821642857
- CheuvrontSNCarterRDeruisseauKCMoffattRJRunning performance differences between men and women: an updateSports Med200535121017102416336006
- JoklPSethiPMCooperAJMasters’ performance in the New York City Marathon 1983–1999Br J Sports Med200438440841215273172
- LepersRCattagniTDo older athletes reach limits in their performance during marathon running?Age (Dordr)201234377378121617894
- WrightVJPericelliBCAge-related rates of decline in performance among elite senior athletesAm J Sports Med200836344345018055922
- PollockMLMengelkochKJGravesJETwenty-year follow-up of aerobic power and body composition of older track athletesJ Appl Physiol1997825150815169134900
- KorhonenMTMeroAAAlénMBiomechanical and skeletal muscle determinants of maximum running speed with agingMed Sci Sports Exerc200941484485619276848
- LepersRRüstCAStapleyPJKnechtleBRelative improvements in endurance performance with age: evidence from 25 years of Hawaii Ironman racingAge (Dordr) Epub February 26, 2012
- EichenbergerEKnechtleBRüstCARosemannTLepersRAge and sex interactions in mountain ultramarathon running – the Swiss Alpine MarathonOpen Access J Sports Med201237380
- Sultan Marathon des Sables [homepage on the Internet]Troyes Cedex, FranceSultan Marathon des Sables Available from: http://www.darbaround.com/Accessed March 4, 2012
- Abou ShoakMKnechtleBRüstCALepersRRosemannTEuropean dominance in multistage ultramarathons: an analysis of finisher rate and performance trends from 1992 to 2010Open Access J Sports Med20134918
- KnothCKnechtleBRüstCARosemannTLepersRParticipation and performance trends in multistage ultramarathons – the Marathon des Sables 2003–2012Extreme Physiology and Medicine2012113
- The Swiss Academy of Medical Sciences (SAMS) Available from: http://www.samw.ch/en/Ethics/Guidelines/Currently-valid-guidelines.htmlAccessed April 7, 2013
- Da Fonseca-EngelhardtKKnechtleBRüstCAKnechtlePLepersRRosemannTParticipation and performance trends in ultraendurance running races under extreme conditions – Spartathlon versus BadwaterExtreme Physiology and Medicine
- ZinggMRüstCAKnechtleBRosemannTLepersRAnalysis of participation and performance in age group athletes in ultramarathons of more than 200 km in lengthInt J Gen Med2013620922023589700
- ZinggMRüstCARosemannTLepersRKnechtleBMaster runners dominate the 24-hour ultramarathons worldwide – a retrospective data analysis from 1998 to 2011Extreme Physiology and Medicine
- The 6 Hardest Races in the World http://news.discovery.com/adventure/the-six-hardest-races-in-the-world.htmAccessed April 7, 2013
- Marathon des Sables. [homepage on the Internet]München, GermanyCHIP Communications GmbH2012Marathon des Sables Available from: http://www.zehn.de/marathon-des-sables-3261601-4Accessed April 7, 2013
- Adventure runner, making every run an adventure http://www.adventurerunner.co.uk/running-the-marathon-des-sables/Accessed April 7, 2013
- Mencap [homepage on the Internet]London, England2014 Marathon des Sables2012 Available from: http://www.mencap.org.uk/get-involved/events/2014-marathon-des-sablesAccessed April 7, 2013
- Ultrarun http://ultrarun.com/marathon-des-sables-2014/Accessed April 7, 2013
- Marathon des Sables on EurosportEurosport.com [homepage on the Internet]FranceMarathon des Sables on Eurosport 2012. Available from: video.eurosport.fr/marathon/marathon-des-sables_vid101226/video.shtml2013Accessed April 7, 2013
- Dicu P/EuroSportMarathon des Sable2012 Available from: http://www.youtube.com/watch?v=bQ-b4ZkLxIoAccessed April 7, 2013
- RobertPollhammerYukon Arctic Ultra [homepage on the Internet]GermanyArcticUltra.de2012 Available from: http://www.arcticultra.de/Accessed April 7, 2013
- Jungle Marathon Ltd [homepage on the Internet]London, UKJungle Ultra Marathon Ltd2012 Available from: http://www.junglemarathon.comAccessed April 7, 2013
- BillMerchantWhat this race is all about [homepage on the Internet]Anchorage, AKAlaska Ultra Sport LLC2013 Available from: http://www.alaskaultrasport.com/alaska_ultra_home_page.htmlAccessed April 7, 2013
- MattMahoneyThe Barkley Marathons – 100 Mile Run [homepage on the Internet] Available from: http://www.mattmahoney.net/barkley/Accessed April 7, 2013
- LombardoMPOn the evolution of sportEvol Psychol201210112822833842
- DeanerRODistance running as an ideal domain for showing a sex difference in competitivenessArch Sex Behav201342341342822700008
- EtterFKnechtleBBukowskiARüstCARosemannTLepersRAge and gender interactions in short distance triathlon performanceJ Sports Sci Epub January 28, 2013
- FaberJFLife Tables for the United States: 1900–2050Actuarial study number 87Baltimore, MDSocial Security Administration1982
- United NationsWorld Population Prospects: The 2004 RevisionNew YorkUnited Nations2004United Nations Department of Economic and Social Affairs Available from: http://www.un.org/esa/population/publications/WPP2004/2004Highlights_finalrevised.pdfAccessed March 12, 2013
- KnechtleBKnechtlePRüstCARosemannTLepersRAge, training, and previous experience predict race performance in long-distance inline skaters, not anthropometryPercept Mot Skills2012114114115622582684
- ShephardRJAge and physical work capacityExp Aging Res199925433134310553515
- KyleUGGentonLHansDKarsegardLSlosmanDOPichardCAge-related differences in fat-free mass, skeletal muscle, body cell mass, and fat mass between 18 and 94 yearsEur J Clin Nutr2001558663672
- KnechtleBRüstCAKnechtlePRosemannTDoes muscle mass affect running times in male long-distance master runners?Asian J Sports Med20123424725623342223
- TanakaHSealsDRInvited review: dynamic exercise performance in master athletes: insight into the effects of primary human aging on physiological functional capacityJ Appl Physiol20039552152216214555676
- El HelouNTaffletMBerthelotGImpact of environmental parameters on marathon running performancePLoS One201275e3740722649525
- SandbakkOEttemaGHolmbergHCGender differences in endurance performance by elite cross-country skiers are influenced by the contribution from polingScand J Med Sci Sports Epub May 24, 2012
- LynchSLHochAZThe female runner: Gender specificsClin Sports Med20102947749820610034
- HoffmanMDFogardKDemographic characteristics of 161 km ultramarathon runnersRes Sports Med20122015969
- GrahamSMMcKinleyMChrisCCInjury occurrence and mood states during a desert ultramarathonClin J Sport Med201222646246623047728
- GuoSSZellerChChumleaWCSiervogelRMAging, body composition, and lifestyle: the Fels Longitudinal StudyAm J Clin Nutr199970340541110479203
- AbbissCRBurnettANosakaKGreenJPFosterJKLaursenPBEffect of hot versus cold climates on power output, muscle activation, and perceived fatigue during a dynamic 100 km cycling trialJ Sports Sci201028211712520391088
- EichenbergerEKnechtleBRüstCALepersRRosemannTOnyweraVOThe aspect of nationality and performance in a mountain ultramarathon – the Swiss Alpine MarathonJournal of Human Sport and Exercise201274748762
- KnechtleBRüstCARosemannTThe aspect of nationality in participation and performance in ultramarathon running – a comparison between Badwater and SpartathlonOpen Access Sports Medicine2012111
- BürgeJKnechtleBKnechtlePGnädingerMRüstCARosemannTMaintained serum sodium in male ultramarathoners – the role of fluid intake, vasopressin, and aldosterone in fluid and electrolyte regulationHorm Metab Res201143964665221823061
- CostaRJTeixeiraARamaLWater and sodium intake habits and status of ultraendurance runners during a multistage ultramarathon conducted in a hot ambient environment: an observational field based studyNutr J2013121323320854
- KnechtleBKnechtlePRüstCARegulation of electrolyte and fluid metabolism in multistage ultramarathonersHorm Metab Res2012441291992622638835
- FreundWWeberFBillichCSchuetzUHThe foot in multistage ultramarathon runners: experience in a cohort study of 22 participants of the Trans Europe Footrace Project with mobile MRIBMJ Open201223e001118
- LopesADHespanholLCJúniorYeungSSCostaLOWhat are the main running-related musculoskeletal injuries? A systematic reviewSports Med2012421089190522827721
- KrouseRZRansdellLBLucasSMPritchardMEMotivation, goal orientation, coaching, and training habits of women ultrarunnersJ Strength Cond Res201125102835284221946910
- RothHJLeithäuserRMDoppelmayrHCardiospecificity of the 3rd generation cardiac troponin T assay during and after a 216 km ultraendurance marathon run in Death ValleyClin Res Cardiol200796635936417453141
- PariseCAHoffmanMDInfluence of temperature and performance level on pacing a 161 km trail ultramarathonInt J Sports Physiol Perform20116224325121725109