
Abstract
Purpose
Mannose receptor C-type 1 (MRC1) is an endocytic lectin receptor primarily expressed in macrophages, dendritic cells, and some endothelial cells. However, the role of MRC1 in cancers remains unclear.
Methods
We analyzed MRC1 expression using The Cancer Genome Atlas (TCGA), Genotype-Tissue Expression (GTEx), Cancer Cell Line Encyclopedia (CCLE), and single-cell datasets. We systematically explored the prognostic implications and diagnostic value of MRC1. Immune-related indicators, including immune cells, immune scores, and immune checkpoint molecules, were used to estimate their correlation with MRC1 expression. Finally, we explored its potential ties to immunotherapy success markers such as tumor mutation burden and DNA repair genes.
Results
MRC1 showed both pro- and anti-tumor leanings depending on the cancer types. High levels correlated with poorer outcomes in six cancers but improved prognosis in some cancers like glioblastoma multiforme. This trend extended to the immune arena, where MRC1 intertwined with diverse immune parameters, suggesting its influence on affecting the tumor’s immunological landscape. Intriguingly, its expression positively associated with factors favoring immunotherapy efficacy while negatively correlating with some potential barriers. Single-cell analysis pinpointed a specific link between MRC1 and DNA damage/repair pathways in breast cancer.
Conclusion
Our study provides a comprehensive landscape of MRC1 levels and diverse regulatory patterns in different cancers, deepening the understanding of MRC1’s roles in tumorigenesis and immunity.
Introduction
Immune checkpoint inhibitor (ICI) treatment, including monoclonal antibodies targeting programmed death-ligand 1, programmed death 1, and CTL-associated protein 4, is widely used to treat advanced cancer. However, many cancers do not respond to existing ICIs. Some patients with cancers considered to respond well to ICIs may not benefit from immunotherapy. In recent years, predictive biomarkers have been proposed to distinguish whether tumors are responsive to ICI treatment. Some of these markers, such as tumor mutation burden (TMB) and tumor-infiltrating lymphocytes (TILs), have been successfully applied in some tumor immunotherapy responsiveness predictions.Citation1–3 Nevertheless, due to the heterogeneity of tumors, these biomarkers can only be used in limited cancer types. The identification of more precise biomarkers of ICI treatment through pan-cancer analysis will promote the progression of immunotherapy research.
Antigen presentation is a crucial process in cellular immunity. The macrophage mannose receptor (mannose receptor C-type 1, MRC1, or CD206) plays an important role in antigen presentation and the induction of immune response.Citation4 MRC1 is an endocytic lectin receptor expressed primarily in macrophages, dendritic cells, and some endothelial cells. A previous study demonstrated that MRC1 promotes the activation of tumor antigen-specific CD4+ and CD8+ T cell.Citation5 Another study revealed that using a peptide conjugated to an antibody against MRC1 could reduce cross-presentation.Citation6 Tumor-related macrophages have been found to polarize to a subset of cells with M2-like properties, compromising antitumor immunity—a phenomenon that is associated with poor prognosis in animal models and human patients. Notably, MRC1 is a significant marker protein expressed in macrophages following M2 polarization, underscoring its role as an essential signature within this pro-tumorigenic environment.Citation7–9 These findings suggest that MRC1 is deeply involved in immune system activation and may have potential predictive value. However, there is no pan-cancer analysis available that delineates the value of MRC1 across a spectrum of diverse tumors in detail.
In this study, we analyzed the expression of MRC1 in various cancer types and its relationship to prognosis using online datasets. Then, we explored the relationship between MRC1 expression and immune cell infiltration, immune scores, and immune checkpoint molecules. Finally, we estimated the potential predictive value of MRC1 immunotherapy by analyzing the relationship between MRC1 expression and current predictive biomarkers.
Methods
Gene Expression Datasets
Normal tissue datasets were obtained from the Genotype-Tissue Expression (GTEx) database, tumor cell line datasets were extracted from the Cancer Cell Line Encyclopedia (CCLE), and tumor tissue and para-cancerous tissue datasets were downloaded from The Cancer Genome Atlas (TCGA).
Cell Culture
All human epithelial cells (BEAS-2B, FHC, MFC10A) and human cancer cell lines (A549, HCC827, HCT116, DLD1, MDA-MB-231, MCF7) were purchased from the American Type Culture Collection (ATCC). The cells were cultured in BEGM, DMEM/F12, DMEM, RPMI-1640, McCoy’s 5A, Leibovitz’s L-15 or MEM (Gibco BRL, United States) supplemented with 10% fetal bovine serum (Gibco BRL, United States) at 37°C, 95% humidity, and 5% CO2 in a cell incubator.1% Penicillin/streptomycin (NCM Biotech, China) was added to all media.
RNA Extraction, cDNA Synthesis, Quantitative Real-Time Polymerase Chain Reaction (qRT–PCR)
Total cellular RNA was extracted using Total RNA Extraction Reagent (10606ES60, Yeasen) based on previous study.Citation10 The isolated RNAs were subjected to first-strand cDNA synthesis using the Yeasen cDNA synthesis kit (11139ES10). The process commenced with genomic DNA digestion, subsequently assembling a 20 µL reverse transcription reaction. The protocol stages for reverse transcription reaction included a 5-minute incubation at 25°C to initiate, a 15-minute elongation at 55°C for cDNA synthesis, and a final 5-minute termination step at 85°C.
Subsequently, gene expression was quantified by Roche LightCycler 480 using SYBR Green Master Mix (11201ES03, Yeasen), and the expression levels were calculated with the comparative CT method (2−ΔΔCT): we normalized the CT number of target gene copies against a reference gene to obtain the ΔCT value. Then it calculates the ΔΔCT by comparing the ΔCT of the sample of interest against the ΔCT of the control. The result is expressed as 2−ΔΔCT. All primers used for qRT–PCR were synthesized by Tsingke Biotech (Tsingke, China). The primer sequences:
MRC1-F:GGGTTGCTATCACTCTCTATGC;
MRC1-R:TTTCTTGTCTGTTGCCGTAGTT;
GAPDH-F:GGAGCGAGATCCCTCCAAAAT;
GAPDH-R:GGCTGTTGTCATACTTCTCATGG.
Survival Analysis
Survival analysis using gene expression profile data was conducted to analyze the relationship between expression in 33 tumors from TCGA and prognosis (overall survival time in days). A univariate survival analysis was performed and visualized with forest plots. Then, Kaplan‒Meier curves of the most significant tumors were generated.
Tumor Immune Infiltration Analysis
Tumor Immunity Estimation Resources (TIMER; https://timer.cistrome.org/) can be used to comprehensively investigate the molecular characteristics of tumor-immune interactions. The TIMER web interface allows the dynamic analysis and visualization of the associations between immune infiltrates and a wide spectrum of factors, including gene expression, clinical outcomes, somatic mutations, and somatic copy number alterations.Citation10,Citation11, Scores for six immune-infiltrating cells in 33 cancers from the TIMER database were downloaded, and the correlation between gene expression and the scores of these immune cells was analyzed. Then, the three most significant tumors were displayed in the form of a scatter plot.
Immune Score Analysis
We used the R software package ESTIMATE to analyze the immune score and stromal score of each cancer type. Then, we investigated the relationship between gene expression and the immune, stromal, and ESTIMATE scores in 33 cancer types. The top three tumors most significantly related to these scores were visualized with scatter plots.
Immune Checkpoint Gene Correlation Analysis
The relationship between the level of MRC1 expression and the expression of 47 common immune checkpoint genes were analyzed. Then, the correlation between MRC1 and the expression of our target genes were calculated.
TNB and TMB Calculations
Neoantigens are new abnormal proteins differing from those expressed by normal cells and arise from gene point mutations, deletion mutations, and gene fusions. We separately determined the tumor neoantigen burden (TNB) for each cancer type and analyzed the relationship between MRC1 expression and the number of neoantigens. TMB is usually measured by the number of somatic mutations that occur in an average of 1 Mb bases in the coding region of the tumor cell genome and is a quantifiable biomarker. Here, we separately determined the TMB of each tumor sample and analyzed the relationship between gene expression and the TMB using Spearman’s rank correlation coefficient.Citation12
MSI/MMR and DNA Methylation Analysis
Microsatellite instability (MSI) refers to any change in the length of a microsatellite caused by the insertion or deletion of a repeat unit in a tumor compared with that in normal tissues. The correlation between gene expression and MSI was analyzed using Spearman’s rank correlation coefficient. Mismatch repair (MMR) is a mechanism for DNA self-repair. The loss of the hub gene of this mechanism results in irreparable DNA replication errors. Here, we used TCGA expression profile data to evaluate the relationship between mutations in five MMR genes (MLH1, MSH2, MSH6, PMS2, and EPCAM) and MRC1 expression. DNA methylation via DNA methyltransferase alters gene performance without changing the DNA sequence. Hypermethylation of the MLH1 promoter leads to a lack of MMR gene expression, affecting the response to immunotherapy. Here, we analyzed the correlation between MRC1 expression and the expression of four methyltransferases (DNMT1: red, DNMT2: blue, DNMT3A: green, and DNMT3B: purple).
Singe-Cell Analysis of MRC1 Expression and Function Enrichment
Gene expression levels of MRC1 were obtained from the Cancer Single-cell Expression Map (CancerSCEM, https://ngdc.cncb.ac.cn/cancerscem). The correlation between MRC1 and 14 functional states (including stemness, invasion, metastasis, proliferation, EMT, angiogenesis, apoptosis, cell cycle, differentiation, DNA damage, DNA repair, hypoxia, inflammation and quiescence) in single-cells were obtained from the Cancer Single-cell States Atlas (CancerSEA, http://biocc.hrbmu.edu.cn/CancerSEA)
Statistical Analysis
The results of the Kaplan‒Meier plots are presented as hazard ratios (HRs) and P values obtained from a Log rank test. The correlation between gene expression and other items was evaluated using Spearman correlation and statistical significance. Unless otherwise specified, P values < 0.05 were considered to indicate significance.
Results
MRC1 Expression in Tumor and Normal Tissues
We first analyzed MRC1 expression in 31 normal tissue types in the GTEx database. MRC1 expression was the highest in the lung tissue and the lowest in the bone marrow (). Data from cancer cell lines from the CCLE database were downloaded, and the MRC1 expression levels in 21 types of cancer were analyzed (). The levels of MRC1 showed high heterogeneity in most cancers.
Figure 1 MRC1 expression in normal and tumor tissues. (A) Boxplot showing the normalized expression levels of MRC1 across 31 tissue types from the GTEx database. Higher box plots indicate higher average expression levels. (B) Violin plot depicting the distribution of MRC1 expression across 21 different cancer types from the CCLE database. Each violin plot represents the distribution of expression levels for a specific cancer type. (C) Violin plot comparing the mRNA expression levels of MRC1 in tumor and paracancerous tissues from the TCGA database. (D) Violin plot illustrating the differential expression of MRC1 between matched tumor and normal tissue samples from the GTEx and TCGA databases. *P<0.05;**P<0.01;***P<0.001;-:not significant.
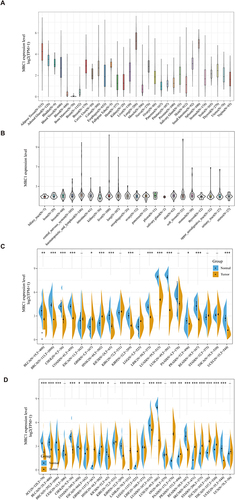
We also analyzed the differential expression of tumor and paracancerous tissues in the TCGA database (). For further analysis, normal tissue data from the GTEx database and tumor tissue data from the TCGA were integrated to study the expression differences of 27 tumors (). MRC1 expression was significantly elevated in various tumor tissues compared to that in normal tissues, including ESCA, GBM, HNSC, LAML, LGG, PAAD, PRAD, SKCM, STAD, TGCT, and THCA. Conversely, MCR1 expression was significantly decreased in ACC, BLCA, BRCA, CHOL, COAD, KICH, KIRP, LUAD, LUSC, READ, and UCEC.
Diagnostic Value and Pan-Cancer Prognostic Analysis of MRC1
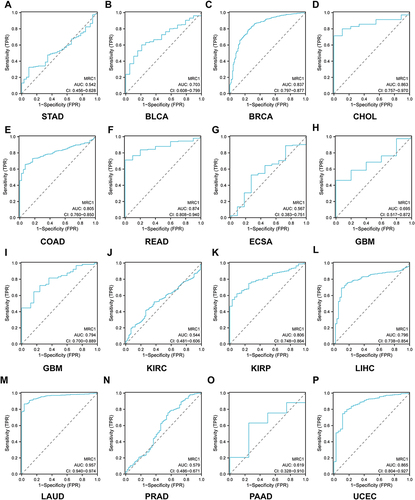
A univariate Cox analysis was used to evaluate the association between MRC1 expression and overall survival rates in patients with 33 types of cancer. As shown in the forest plot, the levels of MRC1 were significantly correlated with prognosis in GBM, KICH, LAML, LUSC, SKCM, THCA, and THYM (). Higher levels of MRC1 were correlated with a better prognosis in SKCM but a poorer prognosis in the other tumors. The Kaplan‒Meier curves are shown in . We further determined the characteristics of MRC1 as a tumor diagnostic marker through the ROC curve. The results demonstrated that MRC1 exhibits excellent single gene diagnostic value in LUAD (AUC=0.957), READ (AUC=0.874), UECE (AUC=0.865), CHOL (AUC=0.863), and BRCA (AUC=0.837). Conversely, the diagnostic value of MRC1 in STAD (AUC=0.542) and KIRC (AUC=0.544) was relatively suboptimal ().
Figure 2 Diagnostic value and prognostic significance of MRC1. (A) Forest plot summarizing the results of a univariate Cox proportional hazards regression analysis examining the association between MRC1 expression and overall survival in patients with 33 cancer types. Each row represents a cancer type, with the hazard ratio (HR) and its 95% confidence interval shown for each. Bold values represent those cancer types with a P value < 0.05. (B–H) Kaplan-Meier survival curves for MRC1 high and low expression groups in GBM, KICH, LAML, LUSC, SKCM, THCA, and THYM, demonstrating the relationship between MRC1 expression and overall survival in these specific cancer types.
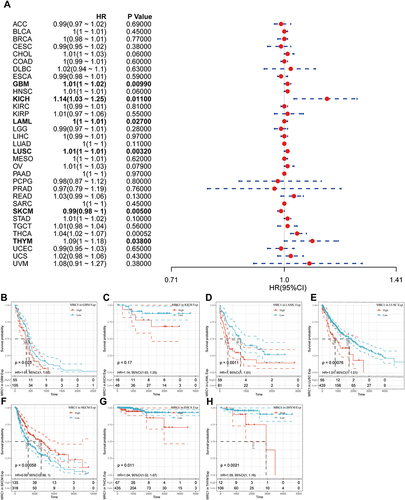
Figure 3 ROC curves for MRC1 as a diagnostic marker. (A–P) Receiver Operating Characteristic curves evaluating the diagnostic performance of MRC1 in distinguishing tumor from normal tissues for 16 different cancer types. Each curve represents a specific cancer type, with the area under the curve (AUC) shown as a measure of diagnostic accuracy. Higher AUC values indicate better diagnostic performance.
Relationship Between MRC1 Expression and Immune Infiltration
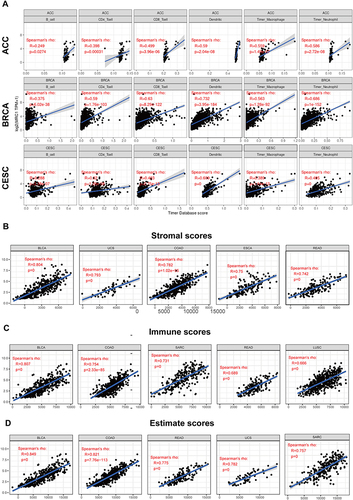
The association between MRC1 expression and six immune infiltrative cells (B cells, CD4+ T cells, CD8+ T cells, dendritic cells, macrophages, and neutrophils) in various cancer types was analyzed. The results suggests that the levels of MRC1 were positively correlated with the six immune infiltrates in most cancer types, with ACC, BRCA, and CESC showing the most significant correlation (). And the relationship between MRC1 expression and immune infiltration in other cancer types are shown in Figure S1.
Figure 4 Relationship between MRC1 expression and immune infiltration. (A) Scatter plots depicting the correlation coefficients between MRC1 expression and the infiltration levels of six immune cell types (B cells, CD4+ T cells, CD8+ T cells, dendritic cells, macrophages, and neutrophils) in ACC, BRCA and CESC. (B–D) Scatter plots showing the correlations between MRC1 expression and the stromal score, immune score, and ESTIMATE score, respectively, in representative cancer types. And the correlation coefficient (R) and p-value are indicated.
Relationship Between MRC1 Expression and Immune Scores
MRC1 expression was generally positively correlated with the stromal, immune, and ESTIMATE scores. The five cancers most significantly positively correlated with stromal scores were BLCA (r = 0.804, P < 0.001), UCS (r = 0.793, P < 0.001), COAD (r = 0.782, P < 0.001), ESCA (r = 0.75, P < 0.001) and READ (r = 0.742, P < 0.001) (). Similarly, the five cancers most significantly positively correlated with the immune scores were BLCA (r = 0.807, P < 0.001), COAD (r = 0.754, P < 0.001), SARC (r = 0.731, P < 0.001), READ (r = 0.689, P < 0.001) and LUSC (r = 0.666, P < 0.001) (). The five cancers most significantly positively correlated with the ESTIMATE score were BLCA (r = 0.804, P < 0.001), COAD (r = 0.821, P < 0.001), READ (r = 0.775, P < 0.001), UCS (r = 0.782, P < 0.001) and SARC (r = 0.757, P < 0.001) ().
Relationship Between MRC1 Expression and Immune Checkpoint Molecules
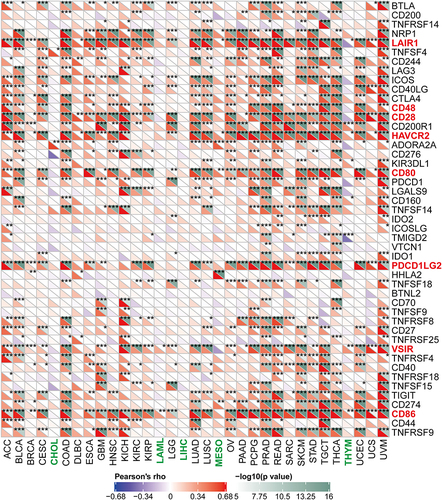
MRC1 expression was positively correlated with most of the 47 immune checkpoint genes in most cancer types, with varying degrees of association. MRC1 expression was positively correlated with LAIR1, CD28, CD48, HAVCR2, CD80, PDCD1LG2, VSIR, and CD 86 in multiple cancer types and negatively correlated with most immune checkpoint genes in CHOL, LAML, LIHC, MESO, and THYM ().
Figure 5 Relationship between MRC1 expression and immune checkpoint molecules. Heatmap illustrating the correlation coefficients between MRC1 expression and the expression levels of 47 immune checkpoint genes across various cancer types. Red color indicates the checkpoints that positively correlated with MRC1 expression, Green color indicates the certain cancer types that negatively correlated with most checkpoints. *:P<0.05; **:P<0.01; ***:P<0.001.
Relationship Between MRC1 Expression and TNB
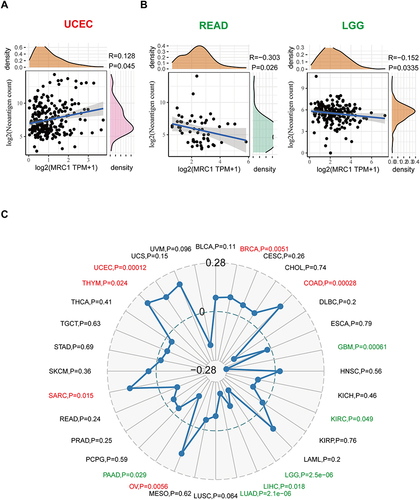
Our analyses suggest that MRC1 expression and TMB were positively correlated in UCEC (P =0.045) (). and negatively correlated in READ (P = 0.026), and LGG (P = 0.034) (). No significant correlation was found in other cancers.
Figure 6 Relationship between MRC1 expression and TNB and TMB. (A and B) Scatter plots depicting the correlations between MRC1 expression and tumor neoantigen burden in UCEC, READ and LGG. Each data point represents a patient sample from a specific cancer type, and the correlation coefficient (R) and p-value are indicated. C: Radar plot showing the correlation between MRC1 expression and tumor mutational burden in 32 different cancer types.
Relationship Between MRC1 Expression and TMB
MRC1 expression was negatively correlated with the TMB in GBM, KIRC, LGG, LIHC, LUAD, PAAD and was positively correlated with the TMB in UCEC, BRCA, COAD, OV, SARC, THYM. No significant correlation was found between MRC1 expression and TMB in other cancers ().
Relationship Between MRC1 Expression and MSI
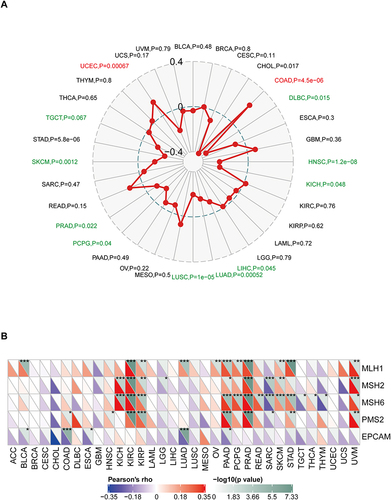
MRC1 expression was negatively correlated with MSI in KICH (P =0.048) and LUSC (P < 0.01). In SKCM, MRC1 expression was negatively correlated with MSI (P < 0.01). MRC1 expression and MSI were also negatively correlated in CHOL (P <0.05), DLBC (P < 0.055), HNSC (P < 0.01), LIHC (P< 0.05), LUAD (P < 0.01), PCPG (P < 0.05), PRAD (P< 0.05), and STAD (P < 0.01) and positively correlated in COAD (P < 0.01) and UCEC (P < 0.01) ().
Figure 7 Relationship between MRC1 expression and MSI and MMR genes. (A) Radar plot showing the correlation between MRC1 expression and MSI statues in 32 different cancer types. Red indicates positive correlations, Green indicates negative correlations. (B) Heatmap demonstrating the correlation coefficients between MRC1 expression and the expression levels of four mismatch repair (MMR) genes (MLH1, MSH2, MSH6, and PMS2) and EPCAM across various cancer types. *P<0.05; **P<0.01; ***P<0.001.
Relationship Between MRC1 Expression and MMR Genes
MMR proteins are often used to detect DNA mismatch repair, a confirmed predictive biomarker indicating a better immunotherapy prognosis in solid tumors.Citation13,Citation14 Epithelial cell adhesion molecule (EPCAM) is highly expressed in tumors and has become an attractive target for immunotherapy due to its role in signal transduction.Citation15 MRC1 was positively associated with MLH1, MSH2, MSH6, and PMS2 in KIRC, KIRP, PAAD, PRAD, and UVM. The MRC1 level was negatively correlated with EPCAM in almost all cancer types ().
Relationship Between MRC1 Expression and DNA Methyltransferases
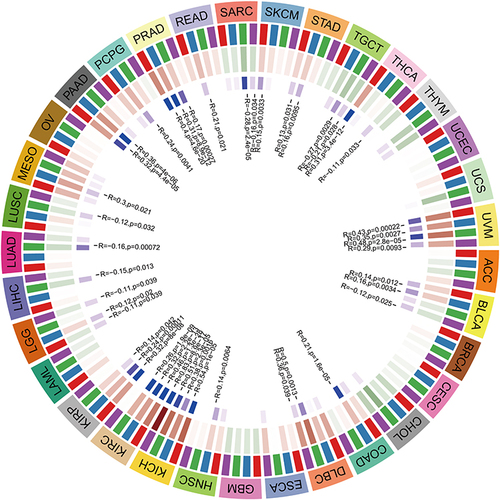
DNA methylation is a form of DNA modification that can change the performance of selective transmission without changing the DNA sequence. DNA methylation can cause changes in chromatin structure, DNA conformation, DNA stability, and how DNA interacts with proteins, thereby controlling gene expression. There were positive correlations between the levels of MRC1 and four methyltransferases in SKCM, UVM, DLBC, HNSC, KICH, MESO, PAAD, PRAD, and READ and negative correlations between MRC1 and methyltransferase expression in SARC, TGCT, GBM, and CHOL ().
Figure 8 Relationship between MRC1 expression and DNA methyltransferases. Heatmap showing the correlation coefficients between MRC1 expression and the expression levels of four DNA methyltransferases (DNMT1, DNMT3A, DNMT3B, and DNMT1) across various cancer types. And the correlation coefficient (R) and p-value are indicated. (DNMT1: red, DNMT2: blue, DNMT3A: green, and DNMT3B: purple).
Single-Cell Analysis of MRC1 Expression Level and Potential Function in Cancers
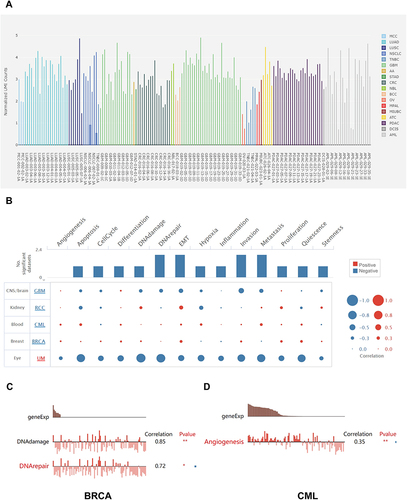
Single-cell sequencing revealed that MRC1 expression was relatively high in LUAD, GBM, and PDAC, but relatively low in OV and TNBC (). In functional enrichment analysis, MRC1 expression was negatively correlated with common tumor phenotypes in uveal tract melanoma(UM) and GBM, but positively correlated with common tumor phenotypes in chronic myelogenous leukemia(CML) and BRCA (). In BRCA, MRC1 expression was positively correlated with DNA damage (r=0.85, p<0.01) and DNA repair (r=0.72, p<0.05). In CML, MRC1 expression was positively correlated with angiogenesis (r=0.35, p<0.01) ( and ).
Figure 9 Single-cell analysis of MRC1 expression and potential function in cancers. (A) Boxplot depicting the relative expression levels of MRC1 in 18 different tumor cell types obtained from single-cell sequencing data. Higher boxes indicate higher average expression levels. (B) The functional enrichment analysis of genes significantly correlated with MRC1 expression in 5 different cancer types. (C and D) Bar plots showing the detail functional enrichment in BRCA and CML.*P<0.05; **P<0.01.
Validation the MRC1 Expression in Cancer Cells and Cancer Tissues
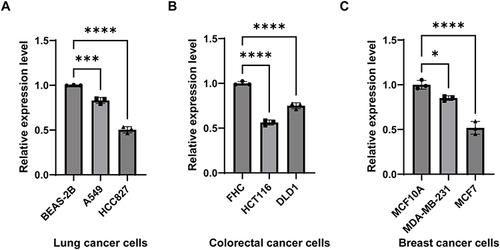
We further validated the expression levels of MRC1 in lung, breast, and colorectal cancer cell lines by qRT-PCR. The results showed that MRC1 expression was significantly lower in colorectal cancer cell lines (HCT116, SW480) than in normal colon epithelial cell line (FHC) (). In lung and breast cancer, MRC1 expression was also lower in malignant tumor cell lines ( and ).
Figure 10 Validation of MRC1 expression in cancer cells. (A) qRT-PCR results showing the relative expression levels of MRC1 in Lung cancer cell lines (A549, HCC827) compared to a normal lung epithelial cell line (BEAS-2B). (B) qRT-PCR results showing the relative expression levels of MRC1 in Colorectal cancer cell lines (HCT116, DLD1) compared to a normal colon epithelial cell line (FHC). (C): qRT-PCR results showing the relative expression levels of MRC1 in Breast cancer cell lines (MDA-MB-231, MCF7) compared to a normal mammary epithelial cell line (MCF10A). *P<0.05;***P<0.001;****P<0.0001.
Discussion
The immune system distinguishes nonself particles by binding to T-cell receptors (TCRs) and major histocompatibility complex (MHC) class I molecules. This mechanism alone is insufficient for T-cell activation. Co-stimulatory and co-inhibitory signals also participate in the regulation of TCR-MHC signaling. Tumor cells activate co-inhibitory pathways to facilitate immune escape. Targeting receptors or ligands of these pathways to prevent T cells from dysfunction is the principle of ICI treatment.Citation16
The efficacy of ICI treatment varies substantially across different cancer types. In the early era of ICI therapy application, the level of PD-L1 was used as a biomarker for selecting suitable patients. Nevertheless, several factors limit the use of this biomarker in wider applications in clinical practice.Citation17,Citation18 The TMB has recently attracted researchers’ attention. The TMB is the total number of somatic mutations, base substitutions, gene insertions, and gene deletions per million bases. More mutations usually result in more tumor neoantigens, which can activate the immune system. Since the TMB was first reported as a predictive biomarker in the ICI treatment of melanoma, successive studies have shown that the TMB level in various tumors is related to ICI efficacy.Citation19–22 Similarly, Tumour Neoantigen Burden (TNB) has shown promise as a potential predictive marker for response to immunotherapy. TNB refers to the load of new antigens produced by gene mutations in tumour cells, which can be specifically recognised by the immune system. It has been observed that higher TNB corresponds to better clinical responses to immunotherapy, and it could be a valuable addition to current methods of patient stratification for ICI treatment.
TIL levels and immune scoring according to the location and density of T-cell subsets infiltrating the tumor microenvironment are also biomarkers for ICI efficacy prediction.Citation23,Citation24 In addition, some immune-related molecules have been confirmed to be related to the response to immunotherapy. For example, the APOBEC signature correlates with responses to immunotherapy.Citation25 ARID1A alterations function as a biomarker for longer progression-free survival durations after anti-PD-1/PD-L1 immunotherapy.Citation26 Serpin mutations are associated with a higher objective response rate and longer survival in melanoma patients treated with anti-CTLA-4 therapy.Citation27
MRC1 is a member of the MR family, which includes ENDO180 (CD280), DEC 205 (CD205), and M-type PLA2R. All members of this family are endocytic receptors that share a similar structure consisting of an N-terminal cysteine-rich (CR) domain, followed by a fibronectin type-II domain (FNII) and several contiguous C-type lectin domains (CTLDs). The functions of MRC1 include the clearance of endogenous molecules, promotion of antigen presentation, and modulation of cellular activation and trafficking.Citation4 MRC1 was previously thought to play a central role in antigen internalization in immature DCs and was later found to participate in improving antigen immunogenicity.Citation28,Citation29 Several studies have demonstrated that MRC1 plays an important role in promoting cross-presentation in an endotoxin-dependent manner.Citation28–30
In this study, we analyzed the relationship between MRC1 expression and prognosis in 33 cancer types. We found that MRC1 is an unfavorable factor regarding overall survival in GBM, KICH, LAML, LUSC, THCA, and THYM patients. Using ROC curves, we found that MRC1 could function as an ideal diagnostic marker in LUAD, READ, UECE, CHOL and BRCA. We then analyzed the relationship between MRC1 and immune infiltrative cells to clarify whether such prognostic differences involve immune factors. Our results reveal that immune infiltration is positively correlated with MRC1 expression in almost every cancer type. The ESTIMATE score data confirmed this finding. This suggests that MRC1 may be integral in shaping immunologically active tumor environments, which could be pivotal in enhancing patient responses to ICI therapy. Thus, assessing MRC1 levels may assist in identifying patients who would benefit most from immunotherapy, providing a targeted approach in clinical treatments.
Next, we analyzed the relationship between MRC1 expression and immune checkpoint molecules. MRC1 positively correlates with co-inhibitory and co-stimulatory immune checkpoint molecules in most cancer types; however, the correlation is considerably weaker in CHOL, LAML, LIHC, MESO, and THYM than in other cancer types, indicating that the role of MRC1 in the immune system differs across cancers. This relationship could potentially influence the effectiveness of ICIs and suggests that a one-size-fits-all approach to immunotherapy may not be optimal. Therefore, a more personalized therapeutic strategy, factoring in MRC1 expression and the cancer-specific immune landscape, may yield better patient outcomes.
To further investigate the predictive value of MRC1 for ICI treatment, we analyzed the relationship between MRC1 and the TMB value. Among the 33 cancer types, MCR1 expression and TMB levels were positively correlated in THYM, BRCA, COAD, OV, SARC, and UCEC but negatively correlated in the rest. This finding indicates that MRC1 expression has a disease-specific association with the TMB. We also analyzed whether MRC1 correlated with TNB, MSI, MMR, and DNA methyltransferases and obtained similar results, indicating that the predictive value of MRC1 differs across the 33 cancer types. The predictive value of MRC1 is likely the highest in tumors such as COAD, UCEC, and READ. This suggests that patients with these types of cancer might benefit more from immunotherapy if they exhibit higher levels of MRC1. Therefore, evaluating MRC1 expression could become a crucial step in the treatment planning process, ensuring that therapies are more effectively matched to the patient’s unique tumor characteristics, potentially leading to improved treatment outcomes.
More importantly, given the high expression of MRC1 in macrophages and dendritic cells, bulk sequencing data may not accurately reflect the expression of MRC1 in tumors. Therefore, we also analyzed the expression level of MRC1 in 18 cancer types at single-cell level. We noticed that MRC1 relatively up-regulated in GBM, PDAC, LUAD and relatively lowly expressed in OV and TNBC. Our results also demonstrated that MRC1 may be related to DNA damage and DNA repair in BRCA. And MRC1 may be positively correlated with Angiogenesis in CML.
Notably, our research focused on the potential significance of MRC1 in LUAD, given its notable downregulation in lung cancer. This marked reduction is likely induced by an array of transcriptional regulatory mechanisms. Further methylation analysis have revealed a negative correlation between MRC1 and DNMT3A, DNMT3B, suggesting that DNA methylation might affect the expression of MRC1 in LUAD. However, further experimental verification is required. Additional analysis through the ROC curve indicates that the diminished expression of MRC1 is a significant diagnostic marker for the malignancy of lung cancer. Moreover, the positive correlation between MRC1 and immune checkpoints (CD86, CD274) in LUAD raises the possibility that MRC1 might directly or indirectly facilitate immune escape in lung cancer. Further experiments showing a negative correlation between MRC1 with TNB and TMB reinforce the idea that MRC1 may promote immune escape in LUAD. These findings suggest that MRC1 holds considerable value in the diagnosis of LUAD and in the assessment of the efficacy of immune therapy treatments.
In conclusion, our study identifies the prognostic value of MRC1 in multiple cancer types. In addition, the expression of MRC1 may have potential predictive value for the efficacy of ICIs. More importantly, MRC1’s correlation with immune infiltration, particularly in ACC, BRCA, and CESC, alongside its association with immune checkpoint molecules, underscores its role in the tumor immune environment. This could be the points informing clinicians about the tumor’s immunogenicity and responsiveness to ICI therapy, making MRC1 a useful therapeutic biomarker in cancers like ACC, BRCA, and CESC. However, in practical applications, the use of MRC1 as a biomarker must be adjusted and validated in further clinical experiments.
Abbreviations
ACC, adrenocortical carcinoma; BRCA, breast invasive carcinoma; COAD, colon adenocarcinoma; DLBC, lymphoid neoplasm diffuse large B-cell lymphoma; ESCA, esophageal carcinoma; KICH, kidney chromophobe; KIRC, kidney renal clear cell carcinoma; KIRP, kidney renal papillary cell carcinoma; LAML, acute myeloid leukemia; LGG, brain lower grade glioma; LIHC, liver hepatocellular carcinoma; LUAD, lung adenocarcinoma; LUSC, lung squamous cell carcinoma; MESO, mesothelioma; OV, ovarian serous cystadenocarcinoma; PAAD, pancreatic adenocarcinoma; PCPG, pheochromocytoma and paraganglioma; READ, rectum adenocarcinoma; SKCM, skin cutaneous melanoma; STAD, stomach adenocarcinoma; TGCT, testicular germ cell tumors; THCA, thyroid carcinoma; THYM, thymoma; UCS, uterine carcinosarcoma; UVM, uveal melanoma; TNB, tumor neoantigen burden; TMB, tumor mutational burden; MSI, microsatellite instability; MMRs, DNA mismatch repair system.
Ethics Statement
The studies involving human data were reviewed and approved by Medical Ethics Committee of the Xiangya hospital, Central South University (No.2023030274).
Consent for Publication
All authors approved to publish the study in this journal.
Author Contributions
All authors made a significant contribution to the work reported, whether that is in the conception, study design, execution, acquisition of data, analysis and interpretation, or in all these areas; took part in drafting, revising or critically reviewing the article; gave final approval of the version to be published; have agreed on the journal to which the article has been submitted; and agree to be accountable for all aspects of the work.
Disclosure
The authors declare that they have no competing interests in this work.
Data Sharing Statement
All data created or analyzed during this study are enrolled in this published article or are available from the corresponding author on reasonable request.
Additional information
Funding
References
- Snyder A, Makarov V, Merghoub T, et al. Genetic basis for clinical response to CTLA-4 blockade in melanoma. N Engl J Med. 2014;371:2189–2199. doi:10.1056/NEJMoa1406498
- Rizvi NA, Hellmann MD, Snyder A, et al. Cancer immunology. Mutational landscape determines sensitivity to PD-1 blockade in non-small cell lung cancer. Science. 2015;348:124–128. doi:10.1126/science.aaa1348
- Gibney GT, Weiner LM, Atkins MB. Predictive biomarkers for checkpoint inhibitor-based immunotherapy. Lancet Oncol. 2016;17:e542–e551. doi:10.1016/S1470-2045(16)30406-5
- Martinez-Pomares L. The mannose receptor. J Leukoc Biol. 2012;92:1177–1186. doi:10.1189/jlb.0512231
- Tsuji T, Matsuzaki J, Kelly MP, et al. Antibody-targeted NY-ESO-1 to mannose receptor or DEC-205 in vitro elicits dual human CD8+ and CD4+ T cell responses with broad antigen specificity. J Immunol. 2011;186:1218–1227. doi:10.4049/jimmunol.1000808
- Chatterjee B, Smed-Sörensen A, Cohn L, et al. Internalization and endosomal degradation of receptor-bound antigens regulate the efficiency of cross presentation by human dendritic cells. Blood. 2012;120:2011–2020. doi:10.1182/blood-2012-01-402370
- Chanmee T, Ontong P, Konno K, Itano N. Tumor-associated macrophages as major players in the tumor microenvironment. Cancers. 2014;6:1670–1690. doi:10.3390/cancers6031670
- Sica A, Schioppa T, Mantovani A, Allavena P. Tumour-associated macrophages are a distinct M2 polarised population promoting tumour progression: potential targets of anti-cancer therapy. Eur J Cancer. 2006;42:717–727. doi:10.1016/j.ejca.2006.01.003
- Wu P, Wu D, Zhao L, et al. Inverse role of distinct subsets and distribution of macrophage in lung cancer prognosis: a meta-analysis. Oncotarget. 2016;7:40451–40460. doi:10.18632/oncotarget.9625
- Wu Z, Lu Z, Li L, et al. Identification and validation of ferroptosis-related LncRNA signatures as a novel prognostic model for colon cancer. Front Immunol. 2021;12:783362. doi:10.3389/fimmu.2021.783362
- Li T. TIMER: a web server for comprehensive analysis of tumor-infiltrating immune cells. Cancer Res. 2017;77:e108–e110. doi:10.1158/0008-5472.CAN-17-0307
- Jardim DL, Goodman A, De Melo Gagliato D, Kurzrock R. The challenges of tumor mutational burden as an immunotherapy biomarker. Cancer Cell. 2021;39:154–173. doi:10.1016/j.ccell.2020.10.001
- Le DT, Durham JN, Smith KN, et al. Mismatch repair deficiency predicts response of solid tumors to PD-1 blockade. Science. 2017;357:409–413. doi:10.1126/science.aan6733
- Le DT PD-1 blockade in tumors with mismatch-repair deficiency. N Engl J Med. 2015;372:2509–2520. doi:10.1056/NEJMoa1500596
- Balzar M, Winter MJ, de Boer CJ, Litvinov SV. The biology of the 17-1A antigen (Ep-CAM). J Mol Med. 1999;77:699–712. doi:10.1007/s001099900038
- Wei SC, Duffy CR, Allison JP. Fundamental mechanisms of immune checkpoint blockade therapy. Cancer Discov. 2018;8:1069–1086. doi:10.1158/2159-8290.CD-18-0367
- Topalian SL, Taube JM, Anders RA, Pardoll DM. Mechanism-driven biomarkers to guide immune checkpoint blockade in cancer therapy. Nat Rev Cancer. 2016;16:275–287. doi:10.1038/nrc.2016.36
- Patel SP, Kurzrock R. PD-L1 expression as a predictive biomarker in cancer immunotherapy. Mol Cancer Ther. 2015;14:847–856. doi:10.1158/1535-7163.MCT-14-0983
- Chalmers ZR, Connelly CF, Fabrizio D, et al. Analysis of 100,000 human cancer genomes reveals the landscape of tumor mutational burden. Genome Med. 2017;9:34. doi:10.1186/s13073-017-0424-2
- Turajlic S, Litchfield K, Xu H, et al. Insertion-and-deletion-derived tumour-specific neoantigens and the immunogenic phenotype: a pan-cancer analysis. Lancet Oncol. 2017;18:1009–1021. doi:10.1016/S1470-2045(17)30516-8
- Buttner R, Longshore JW, López-Ríos F, et al. Implementing TMB measurement in clinical practice: considerations on assay requirements. ESMO Open. 2019;4:e000442. doi:10.1136/esmoopen-2018-000442
- Goodman AM, Kato S, Bazhenova L, et al. Tumor mutational burden as an independent predictor of response to immunotherapy in diverse cancers. Mol Cancer Ther. 2017;16:2598–2608. doi:10.1158/1535-7163.MCT-17-0386
- Buisseret L, Garaud S, de Wind A, et al. Tumor-infiltrating lymphocyte composition, organization and PD-1/ PD-L1 expression are linked in breast cancer. Oncoimmunology. 2017;6:e1257452. doi:10.1080/2162402X.2016.1257452
- Robbins PF. Tumor-infiltrating lymphocyte therapy and neoantigens. Cancer J. 2017;23:138–143. doi:10.1097/PPO.0000000000000267
- Boichard A, Pham TV, Yeerna H, et al. APOBEC-related mutagenesis and neo-peptide hydrophobicity: implications for response to immunotherapy. Oncoimmunology. 2019;8:1550341. doi:10.1080/2162402X.2018.1550341
- Okamura R, Kato S, Lee S, et al. ARID1A alterations function as a biomarker for longer progression-free survival after anti-PD-1/PD-L1 immunotherapy. J Immunother Cancer. 2020;8:e000438. doi:10.1136/jitc-2019-000438
- Riaz N, Havel JJ, Kendall SM, et al. Recurrent SERPINB3 and SERPINB4 mutations in patients who respond to anti-CTLA4 immunotherapy. Nat Genet. 2016;48:1327–1329. doi:10.1038/ng.3677
- Burgdorf S, Kautz A, Bohnert V, Knolle PA, Kurts C. Distinct pathways of antigen uptake and intracellular routing in CD4 and CD8 T cell activation. Science. 2007;316:612–616. doi:10.1126/science.1137971
- Burgdorf S, Scholz C, Kautz A, Tampe R, Kurts C. Spatial and mechanistic separation of cross-presentation and endogenous antigen presentation. Nat Immunol. 2008;9:558–566. doi:10.1038/ni.1601
- Burgdorf S, Lukacs-Kornek V, Kurts C. The mannose receptor mediates uptake of soluble but not of cell-associated antigen for cross-presentation. J Immunol. 2006;176:6770–6776. doi:10.4049/jimmunol.176.11.6770