
Abstract
Background
Macrophages play a crucial role in the progression of AF, closely linked to atrial inflammation and myocardial fibrosis. However, the functions and molecular mechanisms of different phenotypic macrophages in AF are not well understood. This study aims to analyze the infiltration characteristics of atrial immune cells in AF patients and further explore the role and molecular expression patterns of M2 macrophage-related genes in AF.
Methods
This study integrates single-cell and large-scale sequencing data to analyze immune cell infiltration and molecular characterization of the LAA in patients with AF, using SR as a control group. CIBERSORT assesses immune cell types in LAA tissues; WGCNA identifies signature genes; cell clustering analyzes cell types and subpopulations; cell communication explores macrophage interactions; hdWGCNA identifies M2 macrophage gene modules in AF. AF biomarkers are identified using LASSO and Random Forest, validated with ROC curves and RT-qPCR. Potential molecular mechanisms are inferred through TF-miRNA-mRNA networks and single-gene enrichment analyses.
Results
Myeloid cell subsets varied considerably between the AF and SR groups, with a significant increase in M2 macrophages in the AF group. Signals of inflammation and matrix remodeling were observed in AF. M2 macrophage-related genes IGF1, PDK4, RAB13, and TMEM176B were identified as AF biomarkers, with RAB13 and TMEM176B being novel markers. A TF-miRNA-mRNA network was constructed using target genes, which are enriched in the PPAR signaling pathway and fatty acid metabolism.
Conclusion
Over infiltration of M2 macrophages may be an important factor in the progression of AF. The M2 macrophage-related genes IGF1, RAB13, TMEM176B and PDK4 may regulate the progression of AF through the PPAR signaling pathway and fatty acid metabolism.
Introduction
Atrial fibrillation (AF) is a common arrhythmia worldwide, and its epidemiological characteristics and clinical manifestations have been extensively researched.Citation1,Citation2 However, the treatment of AF still has some limitations, such as the potential adverse effects of antiarrhythmic drugs, the risk of bleeding associated with anticoagulation therapy, and the long-term efficacy of catheter ablation.Citation3 These limitations are due to an incomplete understanding of the mechanisms of AF. Previous studies have indicated that electrical and structural remodeling of the atria underlies AF.Citation4 Factors like ion channel abnormalities, cardiomyocyte remodeling, and cardiac neuromodulation disordersCitation5,Citation6 contribute to reduced atrial contractile function and blood pooling, increasing the risk of thrombosis and stroke.Citation7 The function of immune cells in atrial tissue is closely related to the progression of AF.Citation8 To better comprehend the development of AF, further clarification of the remodeling mechanisms in AF is necessary at the cellular and molecular levels.Citation9,Citation10
Chronic inflammation is considered a pathological pathway in several cardiac diseases, including AF.Citation11 Fibrosis, another consequence of inflammation, is closely linked to the structural remodeling of the atria.Citation12,Citation13 Studies have shown that AF patients have higher levels of inflammatory markers compared to those in sinus rhythm (SR),Citation14,Citation15 and the differentially expressed genes (DEGs) between AF and SR are primarily associated with inflammatory responses.Citation16,Citation17 However, the molecular mechanisms driving fibrosis through inflammation are not fully understood. Increasing evidence suggests that immune cells play a crucial role in AF development,Citation8 and the heterogeneity of monocytes and macrophages is closely linked to myocardial fibrosis and cardiac remodeling.Citation18,Citation19 Macrophages, the most abundant leukocytes in the heart, are a major source of cytokines involved in various immune, infectious, endo-environmental, homeostatic, and metabolic processes. They also play a role in stimulating angiogenesis and fibrosis progression.Citation8,Citation20–22 Macrophages are classified into two main phenotypes based on their polarization state: classical M1 (pro-inflammatory) and M2 (anti-inflammatory, tissue repair). M2-type macrophages contain multiple functionally distinct subpopulations, some of which exhibit featuresCitation23 that overlap with the M1 subset. M2-type macrophages have been suggested to be beneficial for AF due to their anti-inflammatory, apoptosis-promoting, and tissue-repairing properties.Citation24 However, their atypical pro-inflammatory,Citation25 pro-fibroticCitation26,Citation27 roles are often overlooked. A recent study using single-cell RNA sequencing (scRNA-seq) analysis found a higher infiltration of pro-fibrotic M2-like macrophages and CD8+ T cells in left atrial appendage (LAA) tissue of patients with AF compared to SR.Citation28 These results highlight the central role of inflammation and fibrosis in AF and suggest that macrophages recruited during atrial remodeling may serve as an immunotherapeutic target in patients with AF.
The main challenges in macrophage research involve identifying different populations and exploring the functions of marker genes in various phenotypes.Citation29 Studies at the Bulk RNA sequencing (Bulk RNA-seq) level have struggled to characterize intra- and inter-tissue heterogeneity, but recent advancements in ScRNA-seq have offered an unprecedented opportunity to systematically characterize specific subpopulations of macrophages and patterns of gene expression in the AF.Citation30 Macrophage localization and function in the heart are distinct, as demonstrated by Dick et al’s single-cell RNA sequencing, which identified four functionally distinct cardiac macrophage clusters.Citation31 Maarten et al also identified five macrophage clusters through single-cell sequencing of left atrial tissue from patients with heart valve disease, and found that pro-inflammatory and pro-fibrotic SPP1+Citation32 macrophage clusters were significantly expanded in atrial tissue from AF mice.Citation33 Integration of bulk RNA-seq and scRNA-seq analyses improved the accuracy of identifying diagnostic biomarkers and revealed the important role of macrophage subpopulations in the pathophysiologic process of AF at the cellular and molecular transcriptional levels.
Materials and Methods
Data Collection and Processing
AF and SR gene expression profiling data were downloaded from the Gene Expression Omnibus (GEO) platform (https://www.ncbi.nlm.nih.gov/geo/). Five bulk RNA-seq datasets containing RNA content of human LAA tissue (GSE14975, GSE31821, GSE79768, GSE41177, and GSE115574) were included for further evaluation. All of the above five datasets were based on the GPL570 platform and in total contained LAA tissue samples from 31 patients in SR and 44 patients with AF (Table S1). Using R (version 4.3.1) software, we merged the above five datasets, normalized them, performed batch effect removal using the “combat” function of the “sva” R package, and visualized them by Principal Component Analysis (PCA) plots. The scRNA-seq dataset was obtained from GSE224959 and contains LAA samples from 5 AF and 5 SR patients. The flow of data analysis in our study is shown in .
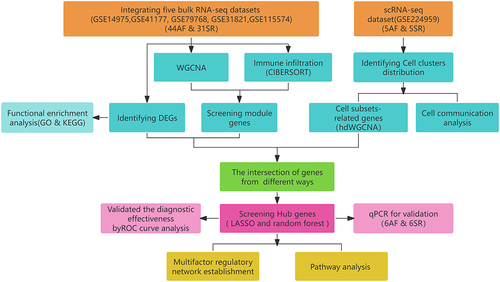
Figure 1 Flowchart of the study.
Identification of DEGs and the Functional Enrichment Analysis
The “limma” R package was used to perform differential gene expression analysis on the bulk RNA-seq data of the AF and SR groups, with a threshold of P < 0.05 and |log2 Fold change (FC)|> 1. The expression of DEGs was visualized using the “pheatmap” R package. The “ClusterProfiler” R package was employed for Gene Ontology (GO) and Kyoto Encyclopedia of Genes and Genomes (KEGG) enrichment analysis of the DEGs, with a threshold set at <0.05.
Evaluation of Immune Cell Infiltration
The abundance of immune cell infiltration in AF patients in the bulk RNA-seq dataset was quantified in R using the cell-type identification by estimating relative subsets of RNA transcript (CIBERSORT) algorithm.Citation34 We filtered the samples using P<0.05 to obtain infiltration ratios and correlations for 22 immune cell subtypes. The percentage of each immune cell type in the samples was quantified using the “ggplot2” R package, and the “brewpub” R packages are shown in the bar graphs. “Corrplot” package was used to generate heatmaps related to 22 infiltrating immune cells. The “vioplot” package was used to visualize the infiltration level of 22 immune cells between AF and SR groups, and P<0.05 was considered to be different.
Constructing the Gene Co-Expression Network
Using the “WGCNA” R package to identify gene modules associated with M2 macrophages. The top 10,000 genes with the highest absolute median difference in the merged bulk RNA-seq data were chosen, converted into a neighbor-joining matrix, and clustered. Outlier samples were removed to ensure the reliability of the network construction results. The “pickSoftThreshold” function was utilized to select and validate the best soft threshold (β) value. Hierarchical clustering dendrograms were then constructed (with a minimum number of genes per module set to 30 and a mergeCutHeight of 0.25), and similar modules in the clustering tree were merged using module eigengene (ME) values. For regulators associated with immune infiltrating cells, module membership (MM) and gene significance (GS) were recalculated and marked with different colors. The module with the smallest P-value and highest relevance was chosen as the key module, and the genes within the key modules were further analyzed.
Cell Clustering Analysis
The “Seurat” R package was used for downstream analysis of scRNA-seq data, with quality control (QC) requirements of >200 total unique molecular identifiers (UMIs) in a single cell, 250 < nfeatureRNA < 2500, and mitochondrial genes < 10%. Data were normalized using LogNormalize, the first 2000 highly variable genes were screened using the vst method, data were downscaled using PCA combined with highly variable genes with Principal Components (PCs) of 20, and batch effects were removed using harmony. The Louvain algorithm in FindNeighbors and FindClusters was used for intercellular clustering of cells, with a resolution of 0.8 for large classes of cells and 0.4 after subclustering, and visualized by the Uniform Manifold Approximation and Projection (UMAP) method. The selection criteria for DEGs were that the logFC was greater than 0.25 after subfamily clustering of medullary-like cells, and only positive values were selected. Subsequently, we used the CellMarker database (http://bio-bigdata.hrbmu.edu.cn/CellMarker/index.html), the “SingleR” R package, and manual hand annotation to identify cell types. The “ggplot2” package was used to show the compositional ratio of different cell types between the AF and SR groups.
Analysis of Cell-Cell Communication
To further explore the interaction and function of macrophage subtypes with other immune cells in AF, we conducted cell communication analysis. We loaded Seurat objects into the Cell Chat program and utilized the “aggregateNet” function to analyze the interaction counts and weights among cell clusters. The “netAnalysis_signalingRole_heatmap” function was employed to identify the outgoing or incoming communication signals of the aggregated cell-cell communication network. Significant cell-cell interactions mediating cell-cell communication (ligand-receptor pairs in the bubble diagram) were identified by assessing the cell-cell communication networks. Identify cell-specific signaling interactions using “network centrality analysis”.
hdWGCNA Analysis of Macrophages in AF
hdWGNCA can construct co-expression networks across spatial hierarchies and is more suitable for scRNA-seq data.Citation35 To further identify the characteristic gene modules of M2 macrophages in the AF group, the “hdWGCNA” R software package was utilized to conduct weighted gene co-expression network analysis of the scRNA-seq dataset. The gene expression data were first normalized, and then Pearson correlation coefficients were calculated to capture the co-expression relationship between each pair of genes. Parameters were scanned for various soft power thresholds (from 1 to 30) using the “TestSoftPowers” function. The “PlotSoftPowers” function was then used to visualize the optimal soft threshold for the scale-free network. Based on these thresholds, an adjacency matrix and a topological overlap matrix (TOM) were generated. The “dynamicTreeCut” algorithm was employed to identify co-expression modules from the TOM and assign a unique color to each module. The connectivity values (kME) of the feature genes were calculated using the “ModuleConnectivity” function to assess their core gene connectivity within the respective modules. The top 25 feature gene scores in each module were obtained using Seurat’s Ucell function, and a feature plot was constructed for each module using the “ModuleFeaturePlot” function. The “GetModuleTraitCorrelation” function was used to determine the importance of the modules, and the “corrplot” R package was used to visualize the correlation between each module. The average expression of module-specific core genes in different macrophage clusters was visualized by Seurat’s “DotPlot” function. Finally, the top 50 genes in each module were extracted as core genes for further analysis.
Identify Key Genes as AF Biomarkers and Evaluate Their Diagnostic Value
To identify genes highly correlated with M2 macrophage infiltration in AF, the Venn diagram was used to take intersecting genes, including DEGs in the AF and SR groups of the bulk RNA-seq dataset, genes highly associated with M2 macrophages in WGCNA, differentially expressed genes in M2 macrophages in scRNA-seq, and hdWGCNA Genes. Two machine learning algorithms, LASSO and random forest, based on the “glmnet” and “randomForest” R packages, were used to screen the genes that could identify AF. Binary logistic regression models were constructed based on the characterized genes using the “glm” R package and the “caret” R package. Validation of model stability using external dataset GSE2240. Additionally, to more accurately assess the diagnostic validity, an automated search for the optimal parameter settings was performed based on the best predicted results using a five-fold cross-validation method. The `pROC` R package was used to plot ROC curves to assess the diagnostic effectiveness of the model by calculating AUC values.
Clinical Sample Collection and Reverse Transcription Quantitative Polymerase Chain Reaction (RT-qPCR) Analyses
To further validate the reliability of the Hub genes, we recruited 6 AF and 6 SR patients between 01 November 2023 and 15 November 2023 Information on the basic characteristics of the patients is shown in Table S2. All subjects had their blood collected in the morning on an empty stomach, and venous blood was collected immediately after using EDTA tubes to centrifuged to separate plasma and stored at −80°C for subsequent experiments. The study complied with the Declaration of Helsinki, and this clinical blood collection protocol was approved by the Ethics Committee of Yunnan University Hospital [No. 2022200], and informed consent was provided in writing to the recruited subjects, (Appendix 1).
An online tool (https://www.ncbi.nlm.nih.gov/tools/primer-blast/index.cgi?link_loc=blasthome) was used to design primers and assess primer specificity. Primer lengths were set between 20bp and 25bp and β-actin was selected as the internal reference gene. Total RNA was extracted from fresh plasma obtained from the AF (n=6) and SR (n=6) groups using TRIzol (ambion) according to the manufacturer’s protocols. The Hifair® III Ist Strand cDNA Synthesis SuperMix for qPCR (gDNA digester plus) kit was then used to The RNA was reverse transcribed into cDNA. The total volume of fluorescent quantitative PCR amplification was 20 ul. The experimental rows were replicated three times in parallel, and the relative quantitative levels of mRNA for each subgroup were calculated using the 2-∆∆CT method. β-actin was used as an internal control. The primers used in this study are shown in Table S3.
Construction of a Multifactor Regulatory Network Based on Key Signatures
To further explore the expression patterns of hub genes, experimentally supported databases of functional target regulators, miRTarBase (https://mirtarbase.cuhk.edu.cn/~miRTarBase/miRTarBase_2022/php/index.php) and Regnetwork (http://www.regnetworkweb.org), were used to predict microRNAs (miRNAs) and transcription factors (TFs) targeting hub genes. Results with a p-value ≤ 0.05 were chosen as critical values. After obtaining the TF-miRNA-mRNA regulatory relationships, Cytoscape was used to visualize the regulatory network.
Single-Gene GSEA Enrichment Analysis
To further explore the potential signaling pathways of Hub genes in AF, we conducted single-Gene Set Enrichment Analysis (GSEA) enrichment analysis using the merged BulkRNA-seq dataset, based on the “c2.cp.kegg.v7.0.symbols” gene set from the MSigDB database. In order to obtain the standardized enrichment scores for each analysis, gene set permutations were set to 1000-fold, and a p-value < 0.05 was considered as a significantly enriched pathway.
Statistics
All analyses in this study were conducted using R software 4.3.1 and GraphPad Prism 9.0. Group comparisons were carried out using t-tests. The accuracy of the prediction model was evaluated using ROC curves. Fisher’s exact test was employed to analyze scRNA-seq cell proportions, and correlation analysis was used to examine the correlation coefficients between the two variables. Statistically significant differences were defined as p-values less than 0.05.
Result
DEGs Identification and Functional Enrichment Analysis
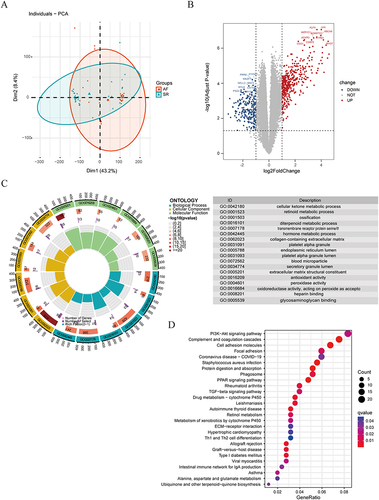
After merging the five bulk RNA-seq datasets, the Results of removing the batch effect are presented by a two-dimensional PCA clustering diagram, as shown in , which shows the samples of the AF and SR groups clustered together separately. We identified a total of 593 DEGs in the AF group, of which 387 were up-regulated and 216 were down-regulated. The volcano plot demonstrated the top 10 genes that were up- or down-regulated (). depicts the results of GO enrichment analysis based on DEGs, this includes processes of cellular ketone metabolic process, transmembrane receptor protein serine/threonine kinase signaling pathway, hormone metabolic process, collagen-containing extracellular matrix, platelet alpha granule, extracellular matrix structural constituent, and heparin binding in relation to metabolism, oxidation, coagulation, matrix related biological functions. KEGG pathway analysis of DEGs showed that DEGs were significantly enriched in AF-related immune, inflammatory and fibrotic pathways, such as PI3K-Akt signaling pathway, TGF-β signaling pathway, rheumatoid arthritis, phagolysosomes, PPAR signaling pathway, ECM-receptor interactions, and Th1 and Th2 cell differentiation (). These biological functions are intricately linked to the primary mechanisms of AF, such as triggered activity and matrix remodeling.
Figure 2 Identification of DEGs between AF and SR samples and enrichment analysis of DEGs using the GO and KEGG databases. (A) Principal component analysis clustering of gene expression in AF and SR tissues. (B) Volcano plots for the genetic differential analysis. The red points represent upregulated DEGs, and the blue points denote downregulated DEGs. (C) The circled graph on the left shows the relationship between key DEGs and the most enriched biological processes, while the graph on the right illustrates the top 6 enriched BPs, CCs, and MFs. (D) Functional enrichment analysis of the KEGG database. The words on the left indicate enriched KEGG, the size of the balls indicates the number of genes enriched, and the color indicates the level of enrichment.
The Difference of Immune Cell Infiltration
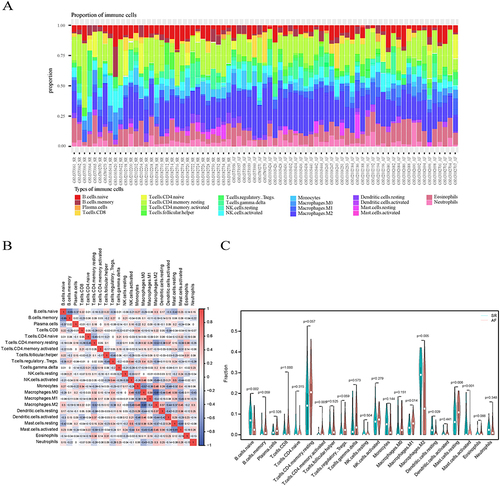
Based on the enrichment analysis results suggesting that DEGs were concentrated in immune-related signaling pathways and responses, we further applied the CIBERSORT algorithm to assess the immune cell infiltration in the two groups of specimens. The bar graphs demonstrated the relative percentages of 22 immune cell subtypes in 31 SR samples and 44 AF samples (), and we found that there was a significant difference in immune cell infiltration between SR samples and AF samples. The correlation heatmap () showed that M2 macrophages showed the strongest positive correlation with monocytes (r=0.51), while M2 macrophages showed a significant negative correlation with M0 macrophages (r=−0.82). shows that the infiltration of activated CD4 memory T cells, M1 macrophages, M2 macrophages, and activated mast cells was higher in the AF group compared with the SR group, while naive B cells, resting dendritic cells, and resting mast cells were relatively lower. Our findings suggest that these 7 immune cells are involved in the progression of AF, in particular, M2 macrophages show a markedly active expression state in AF and the strongest correlation with monocytes and M0 macrophages. This finding is consistent with previous findingsCitation28 that activated M2 macrophages play an important role in the onset and progression of AF. This finding deepens our understanding of proinflammatory, profibrotic M2-type macrophages in AF and provides key clues for future studies.
Figure 3 Visualization and assessment of immune cell infiltration. (A) The relative percentages of the 22 immune cell types in 75 left atrial appendage samples. Each color represents one cell type. (B) Heatmap showing the correlation of the 22 immune cell types. Red signifies a positive correlation, whereas blue indicates a negative correlation. (C) The fraction of infiltrating immune cells in the AF and SR groups. The SR group is denoted by the color blue, while the AF group is denoted by the color red. A significance level of P<0.05 was used to indicate statistical significance.
Identification of Gene Co-Expression Networks and Modules
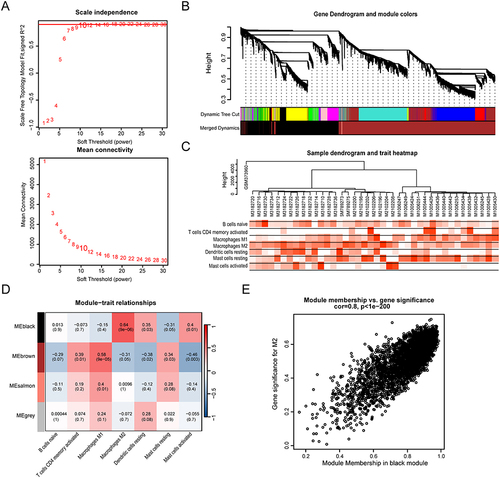
We went to further explore gene modules highly associated with M2 macrophage subtypes by WGCNA methods, The optimal β-value is 10 (), and the resulting scale-free topology fit index was calculated to be 0.81, meeting the criterion for scale-free networks. Using dynamic shear tree analysis, we created co-expression modules, which were then merged to form a total of 4 modules (). The sample trait heatmap displayed the differential distribution of the seven immune infiltrating cell types associated with AF across the samples (). We then ranked the module feature matrices and calculated the correlation between the model feature matrices and the infiltrating immune cells to generate a heat map of the module-trait relationships (). The results showed that the black module was significantly positively correlated with M2 macrophages (r = 0.64, p < 0.001) and contained 3288 genes associated with M2 macrophages ().
Figure 4 WGCNA screening of M2 macrophage-associated gene modules. (A) Evaluation of the scale-free fit index and mean connectivity across different soft-thresholding powers. (B) Associations between consensus modules and samples, each comprising a group of closely connected genes. Each branch represents an individual gene, with each color indicating a co-expression module. (C) Trait heatmap displaying the distribution of the seven immune cell types in each sample. (D) Heatmaps showing the correlations between 4 modules and 7 types of immune cells. (E) Scatter plots describing the relationship between gene significance and gene module membership in the black module. Each dot represents a gene in the black module.
Single-Cell RNA Sequencing Data Preprocessing and Analysis
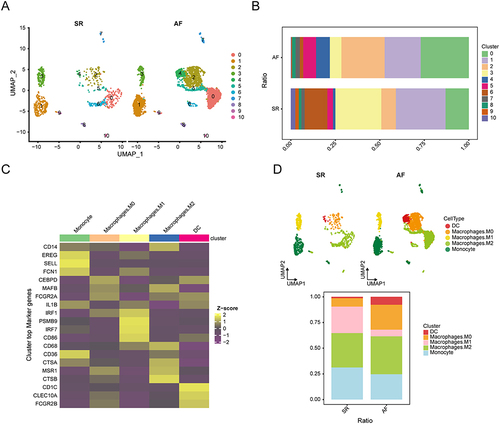
The results of the scRNA-seq raw data QC are shown in Figure S1A, where harmony further integrated and eliminated batch effects (Figure S1B). Based on the Seurat standard steps, we finally identified 21 clusters, which were then embedded into the UMAP graph as shown in . A dataset containing 18,856 cells in 5 AF samples and 5 SR samples was further analyzed. Cell annotation was performed by manual annotation combined with the CellMarker database and the “SingleR” R package, and we identified eight cell types, including Tissue stem cells (SOX2, OCT4), T cells (CD3, CD4), Natural Killer cells (NK cells) (CD56, CD16), Endothelial cells (CD31, CD34), Myeloid cells (CD11b, CD14), Smooth muscle cells (SMA, calponin), Neutrophils (CD15, CD16), and B cells (CD19, CD20). The UMAP plot shows the distribution difference of these cell types between AF and SR groups (), and the results of cell types annotated by classical genes are shown in , which demonstrates that the results of our cellular annotation are clear and accurate. The cell ratio stacking diagram () further illustrates that the number of Myeloid cells was significantly increased in the AF group compared with the SR group, while the number of Smooth muscle cells, Endothelial cells, NK cells, and T cells was significantly decreased. We found that Myeloid cells were the cell type that focused on the changes in the AF group, which is consistent with our previous expected results. We further annotated myeloid cell subsets, generating UMAP plots () and bar graphs (). The differentially expressed genes among myeloid cell subpopulations are shown in , CTSB, MSR1, CTSA, CD36, CD68, FCGR2A, MAFB, and CD14 marker genes were highly expressed in the M2 Macrophage cell population, Up-regulation of these marker genes indicates the polarization status of M2 macrophages and their immunomodulatory role in AF. shows that the AF group had higher proportions of DC cells, macrophage M2, and macrophage M0, and lower proportions of macrophage M1 and monocytes compared with the SR group. Consistent with the findings in our bulk data of the active expression status of M2 macrophages in AF, we hypothesized that the over infiltration of M2 macrophages might be an important factor in the progression of AF.
Figure 5 Heterogeneity of immune cells in the AF and SR groups. (A) UMAP plot showing the cell distribution of the AF and SR groups. (B) UMAP plot showing the results of the cell annotation between the AF and SR groups. (C) Bubble dot graphs showing the expression of the top three different marker genes for each cell type. The colors of the dots represent the average expression, and the sizes of the dots represent the average percentage of cells that expressed the DEGs. (D) Stacked plot of cell proportions between different groups and each sample.
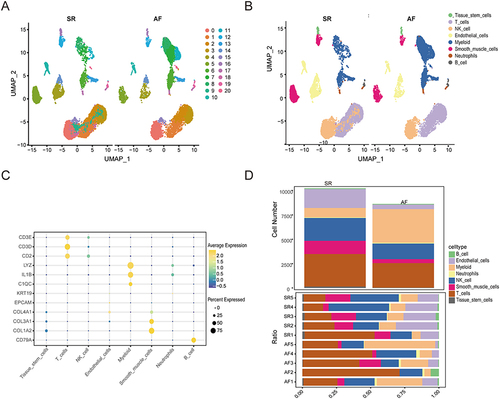
Figure 6 Cell annotation for myeloid cell subsets between groups in the AF and SR cohorts. (A) UMAP plot showing the distribution of myeloid cell subsets in the AF and SR groups. (B) Bar graphs showing the proportions of cell clusters in the different groups. (C) Heatmap showing the DEGs in the myeloid cell subsets. Yellow for high expression, purple for low expression. (D) Distribution of myeloid cell subsets in each group was determined using a UMAP plot and a stacked plot of myeloid cell subset proportions between the different groups.
Cell-Cell Communication Analysis
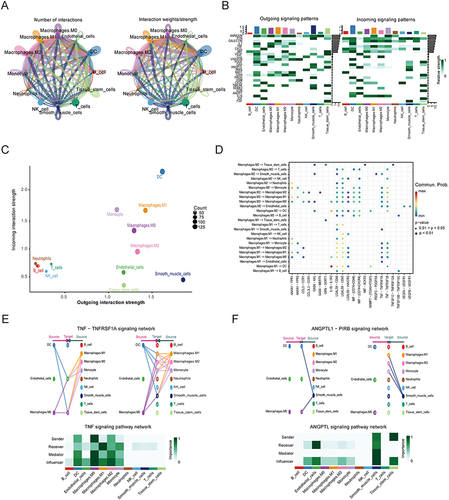
In the AF group, we used the“CellChat”R package to explore intercellular communication and to describe the signaling pathways that interacted in the single-cell data. shows a significant increase in interactions between macrophage M1, macrophageM2 and DC cells in AF. As shown in , macrophage subtypes, DC cells, and smooth muscle cells represented the cell types with the highest number of incoming and outgoing signaling patterns in AF. The strengths of cell output and afferent interactions are plotted in . To further elucidate the potential cell-cell communication between macrophage M1 and macrophage M2 and other cell types of cells, based on the relative expression of ligand-receptor (L-R) pairs, we analyzed the output signaling of macrophage M2 and macrophage M1 (). At the level of cell-cell contact, macrophage M0 and DC was most active in the TNF-TNFRSF1A ligand-receptor pair, affecting macrophage M1, macrophage M2 and monocytes by activating the TNF signaling pathway (). Smooth muscle cells were the only senders and receivers in the ANGPTL signaling pathway network ().
Figure 7 Cell‒cell communications in AF. (A) Integrated cell‒cell communication network plotted by interaction and weight. The circle sizes are proportional to the number of cells in each cell group, and the edge width represents the communication probability. (B) Heatmaps showing the relative strength of the signaling pathways among the 11 cell populations in the outgoing and incoming signaling patterns. A gradual change in color from green to white indicates a change in the relative interaction strength from high to low. (C) Dot plot of outgoing/incoming interaction strength for 11 cell clusters. Dot size is positively correlated with strength. (D) Bubble plot of macrophage subsets outgoing interaction signaling pathways. The dot color reflects the communication probabilities, and the dot size represents the computed p value. (E and F) The relative contribution of TNF-α and ANGPTL signaling to each cell group. The term “sender” refers to a source of signaling, “receiver” refers to the target of signaling, “mediator” refers to the gatekeeper of a cell, and “influencer” refers to the ability to influence the flow of information within a signaling network.
hdWGCNA Analysis of Macrophage Subsets in AF
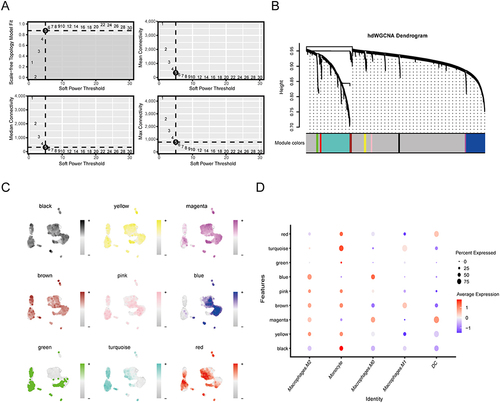
To identify genes characterizing macrophage subpopulations in the LAA tissue of patients with AF, we performed hdWGCNA. The optimal soft threshold for constructing the scale-free network was 5 (). Dynamic shear dendrograms were visualized for hierarchical clustering based on gene expression patterns, and nine gene modules were generated (). Figure S2A and B shows the top 10 hub genes of these 9 modules and illustrates the relationships between the modules. In addition, the expression distribution of the hub genes from these nine modules was mapped onto macrophage subsets (). shows that blue, yellow and pink modules are positively correlated with macrophage M2, macrophage M0 and monocyte cluster.
Figure 8 hdWGCNA identifies the modular signature genes of macrophage subsets in AF. (A) Soft power = 5 was selected to construct the scale-free network. (B) Hypervariable genes were clustered by hdWGCNA into 9 modules. Each leaf in the dendrogram represents an individual gene, while the color assigned at the bottom indicates its membership in a specific co‐expression module. The “gray” module consists of genes that were not grouped into any co‐expression module. (C) t-SNE plot showing the expression distribution of hub genes for each module across the 9 clusters. Darker colors represent higher module gene expression. (D) Dot plot presenting the average expression of module-specific hub genes in different macrophage subsets. The size of the dots represents the percentage of cell subtypes and the color of the dots represents the average expression of the module genes.
Identification of M2 Macrophages Related Biomarkers in AF
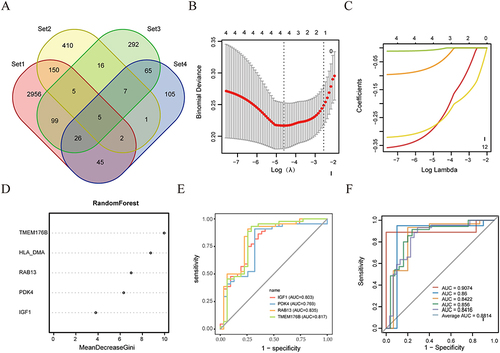
Using the Venn diagram in the multidimensional data, we found five DEGs associated with M2 macrophages in AF (). We further screened for signature genes with the ability to diagnose AF by applying machine learning algorithms. After selecting the best λ, the LASSO algorithm screened four genes (IGF1, PDK4, RAB13 and TMEM176B) ( and ). The relative importance of the five candidate genes in the random forest algorithm is shown in . Eventually, the LASSO and random forest algorithms shared the Four genes, IGF1, PDK4, RAB13, and TMEM176B, were identified as biomarkers of AF. We developed a binary logistic regression model using the four mentioned biomarkers. The AUC curves in showed that the four biomarkers had high predictive validity (AUC > 0.75). We validated the stability of the model using the external dataset GSE2240 from the GPL96 and GPL97 platforms, respectively. As shown in Figure S3A and B, the data validation results (average AUC = 0.654) from the two platforms complement each other. Although the results of the ROC curves did not fully meet our expectations, these data still showed certain trends that supported our initial findings. Additionally, we assessed the reliability of the model’s efficacy using 5-fold cross-validation. The results indicated that the model demonstrated good and reliable predictive efficacy (AUC ≥ 0.8) with a mean value of 0.8814 ().
Figure 9 Machine learning algorithms to identify Hub genes and ROC curve validation. (A) The feature gene selection from different dimensions. Set1 includes the genes highly associated with M2 macrophages in WGCNA; Set2 consists of the DEGs from the bulk RNA-seq dataset; Set3 comprises the differentially expressed genes of M2 macrophages in the scRNA-seq; Set4 contains the genes highly correlated with the subpopulation of M2 macrophages in the hdWGCNA. (B and C) Adjustment for feature selection by LASSO logistic regression analysis. (D) Genes are displayed in descending order of importance by random forests. (E) The diagnostic efficacy of the 2 algorithms for the 4 crossover genes is represented by ROC curves. (F) Model stability was assessed using fivefold cross-validation.
Validation of the Key Genes
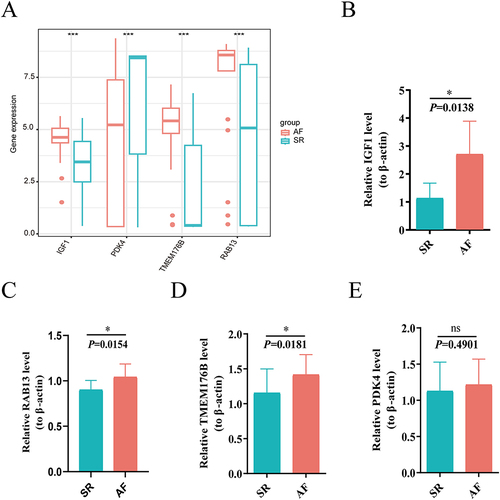
To further validate the reliability of our diagnostic genes, we collected serum samples from 6 pairs of AF-SR patients in the clinic and examined the expression levels of each of the 4 key genes by qRT-PCR to verify their differential expression between AF and SR. Similar to the results of previous analyses (), the expression levels of IGF1, RAB13 and TMEM176B were higher in the AF group than in the SR group (), whereas the expression of PDK4 was not significantly different between the 2 groups ().
Figure 10 Validation of the key genes in AF patients through qPCR (A) Expression levels of the Hub genes in the merged Bulk-seq dataset. (B–E) The relative expression levels of key genes in whole blood between the SR and AF groups. (B) IGF1; (C) RAB13; (D) TMEM176B; (E) PDK4. *P < 0.05, ***P < 0.001.
TF-miRNA-mRNA Regulatory Network Analysis
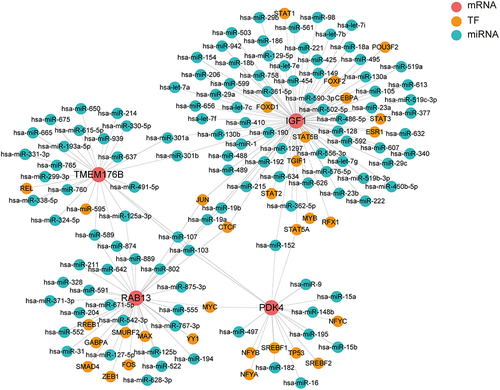
To further explore the potential regulatory mechanisms of Hub genes, 152 TF-miRNA-mRNA regulation were obtained after predicting miRNA-gene pairs and TF-gen pairs gained relationships. Regulatory network (including 117 miRNAs, 41 transcription factors and 4 target mRNAs) visualized by Cytoscape (). In this network, we found that miRNAs and TFs targeting IGF1 were the most abundant, and IGF1 and PDK4 were targeted by activated TF factor (STAT5A) and hsa-miR-152. In addition, RAB13 and IGF1 were targeted by activated TF factors (JUN and CTCF), while hsa-miR-19a and hsa-miR-19b were bridges connecting RAB13 and IGF1.
Figure 11 The TF-miRNA‒mRNA regulatory network. The red balls depict mRNAs, the blue balls represent miRNAs, and the brown balls represent TFs.
Signaling Pathways Analysis of Macrophage-Related Biomarker
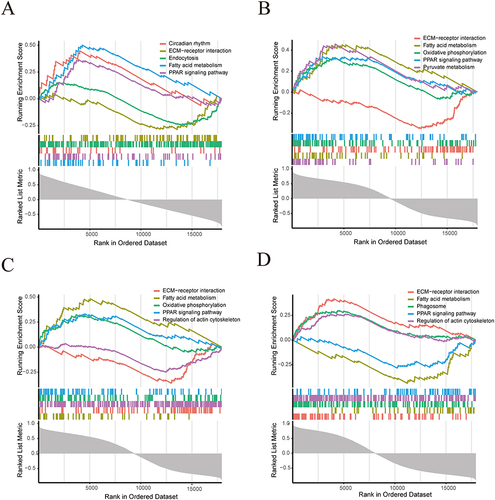
In order to explore the biological pathways of Hub genes in AF pathology, we performed single gene GSEA enrichment analysis. The results showed that IGF1, RAB13, TMEM176B and PDK4 were enriched in Circadian rhythm, Fatty acid metabolism, and PPAR signaling pathway, Phagosome, ECM-receptor interaction, and Endocytosis. ().
Figure 12 Identification of signaling pathways affected by target genes via GSEA. The major signaling pathways were enriched based on the expression of target genes in the merged Bulk RNA-seq dataset. (A) IGF1; (B) RAB13; (C) TMEM176B; (D) PDK4.
Discussion
Trigger and atrial matrix remodeling are thought to be the main causes of initiating and sustaining AF, increasing the likelihood of automaticity and re-entry, and are closely related to immune remodelling.Citation9 Inflammation and fibrosis are considered significant elements in the immune remodeling process of AF.Citation36,Citation37 Monocytes/macrophages are key inflammatory cells in the heart, and their contribution to repair and fibrosis in the early stages of cardiac injury is well documented.Citation38,Citation39 Macrophages are heterogeneous populations of immune cells recruited and activated during different cardiac processes, and exhibit diverse functions.Citation40–42 Recent studies have shown that macrophage heterogeneity is closely associated with myocardial fibrosis, cardiac remodeling, and may serve as a potential therapeutic target for atrial fibrosis.Citation18 However, their specificity in the heart remains controversial. M2 macrophages have been implicated in myocardial fibrosis because of their anti-inflammatory, pro tissue repair, remodeling, angiogenesis, and maintenance of homeostasis, but their deleterious aspects are not fully understood. IL-4 (M2 activator) has been reported to induce M2 macrophages to exhibit a nonclassical proinflammatory phenotype.Citation25 A study by Westermann et al reported an increased number of TGFβ-expressing leukocytes with characteristics of M2 macrophages in patients with heart failure in whom the ejection fraction remained unchanged.Citation43 During ischemia and reperfusion, the transition from M1 to M2 stimulates a pro-fibrotic environment, including maturation of monocyte precursors into fibroblasts.Citation44 These results illustrate the evidence for activation of M2 macrophages in disease pathogenesis. Our study comprehensively analyzed a large amount of RNA-seq and single-cell RNA-seq data to characterize immune cell infiltration in LAA tissue from patients with AF. Using multiple machine learning algorithms and combining them with experimental validation, we identified biomarkers associated with M2 macrophages in AF and speculated on the potential molecular regulatory mechanisms of these biomarkers in the pathophysiological process of AF.
Our enrichment analysis of differential gene lines in AF revealed that these DEGs were significantly enriched in the TGF-β signaling pathway, PPAR signaling pathway, and ECM-receptor interactions.Citation43 It is worth noting that TGF-β is an important pro-fibrotic factor secreted by macrophage M2,Citation44 and that macrophage migration inhibitory factor (MIF) promotes cardiac fibrosis in patients with AF through activation of the TGF-β signaling pathway.Citation45 Excessive M2 macrophage activity may promote TGF-β1 and IL-10 secretion, thereby inhibiting ECM uptake and degradation and cardiac fibrosis in patients with AF.Citation45 Excess M2 macrophage activity may promote the secretion of TGF-β1 and IL-10, which inhibits ECM uptake and degradation and increases susceptibility to myocardial fibrosis and AF.Citation46 PPAR regulates macrophage metabolism, and multiple signaling proteins such as PPARα, PPARc, and SIRT3 have been shown to be Ang II–induced atrial an important target of inflammation and fibrosis.Citation47,Citation48 These results suggest that in AF, an imbalance of M2 macrophages may lead to the activation of multiple inflammatory, fibrotic, and metabolic-related signaling pathways. Understanding pro-inflammatory and pro-fibrotic macrophage subtypes and their gene functions may help further elucidate the complex mechanisms of electrical, structural and neural remodeling in heterogeneous atrial conduction. By the CIBERSORT algorithm, we found that T cells and macrophage subpopulations showed high variability between AF and SR groups. In addition, consistent with previous findings,Citation49 M2 macrophages and T cells were increased in the AF group. The new study demonstrated a higher infiltration abundance of the M2 typical marker CD163 in the LAA of patients with AF by quantitative analysis.Citation28 These results characterize the immune cell infiltration in the LAA tissue of patients with AF. Second, by WGCNA analysis, we found that M2 macrophages correlated most significantly with the black module. From this, we hypothesized that the black module gene is a M2 macrophages-related gene in AF progression.
By scRNA-seq analysis, we found that the number of Myeloid cells was significantly increased in the AF group, while the number of Smooth muscle cells, Endothelial cells, NK cells, and T cells was decreased. To further clarify the heterogeneity of cell types, we performed subclustering analysis of myeloid cells. The results showed that DC cells and M2 macrophages had high variability between AF and SR groups. Similar to the results of the immune infiltration analysis in the bulk data, the proportion of M2 macrophages was increased in the AF group. The results of the study by Chris J. Watson showed that pro-fibrotic CD163+ M2 macrophages, collagen amount, and BNP expression were higher in atrial tissue of AF patients compared with SR patients.Citation50 In addition, a study by Sheng et al found that M2-like macrophages with high pro-inflammatory scores and CD8+ T cells were recruited in the left atrium of the AF left atrium.Citation28 The above results suggest that that the immune function and related molecular features of macrophage M2 in AF progression deserve further exploration. Intercellular communication can not only elucidate the underlying intercellular communication and cellular states, but also uncover the intracellular conduction and amplification of specific signaling pathways.Citation51,Citation52 We found that the pattern of intercellular interactions in LAA tissues of patients with AF was predominantly characterized by cell-substrate interactions. At the level of cellular ligand-receptor-mediated signaling, we found that TNF-TNFRSF1A signaling was most active in macrophage M0 and DC cells, which interacted with macrophage M1, macrophage M2, and monocytes through the TNF signaling pathway. Notably, TNF, an inflammatory, fibrosis-related signaling pathway involved in the progression of AF, was found to be activated to varying degrees in different subtypes of macrophages, and alterations in TNF/TNFRS1A signaling may increase proinflammatory signaling.Citation53,Citation54 In addition, we found that smooth muscle cells are the sole senders and receivers in the ANGPTL signaling network. The TGF-β1/Smad pathway in smooth muscle cells was found to be an important pathway affecting atrial remodeling and fibrosis.Citation55 Animal experiments have shown that ANGPTL4 attenuates Angii-induced atrial fibrillation and fibrosis through the PPAR pathway.Citation48 Our results emphasize the important pathway of M2 macrophage-modulated immune-inflammatory responses in AF.
We identified IGF1, PDK4, RAB13, and TMEM176B as biomarkers associated with M2 macrophages in AF using two machine-learning algorithms, LASSO and Random Forest. These biomarkers were experimentally validated through qPCR. We found that the relative expression levels of IGF1, TMEM176B and RAB13 were consistent with the expression trend of the analyzed results, while PDK4 was not significantly differentially expressed in AF. Upon literature review, we found evidence supporting PDK4 as a valid biomarker for distinguishing AF from SR by analyzing whole blood gene expression before and after electrical cardioversion (ECV) in AF patients.Citation56 IGF-1 is synthesized and secreted primarily in the liver, and it has been reported to be produced by cardiac fibroblasts that are also exposed to pressure overload stimulation in the murine heart The expression of IGF-1R mRNA in cardiac fibroblasts is higher than that in myocardial fine, and the effect of IGF-1 on cardiac fibrosis may vary depending on the duration and dose of treatment.Citation19 PDK4 is a key enzyme in the regulation of glucose homeostasis.Citation57 The activation of NF-kappaB in cardiac cells inhibits PPAR activity, which leads to decreased PDK4 expression and increased glycolysis.Citation58 PDK4 is a regulator of fibrogenesisCitation59 and increased glycolysis induces myocardial fibrotic remodeling.Citation60 RAB13 is a protein involved in organelle-to-organelle communication and plays a key role in intracellular processes such as vesicle transport and phagocytosis.Citation61 The researchers analyzed the mRNA expression dataset in the GEO database to identified 15 biomarkers of septic shock including RAB13.Citation62 These results suggest that RAB13 is closely associated with phagocytosis and inflammation. TMEM176B is a member of the membrane-spanning 4-domain (MS4) family of transmembrane proteins, and TMEM176 and the enzyme-like membrane-bound protein CD39 may be potential targets for unleashing the activation of the inflammasome.Citation63 Marcelo Hill’s study showed that TMEM176B acts as a dual immunomodulator that can inhibit effector immune responses in some settings while promoting immunity through antigen presentation in others.Citation64 However, the roles of RAB13 and TMEM176B in atrial fibrillation have never been investigated. We hypothesize that IGF1, PDK4, RAB13, and TMEM176B may influence the progression of AF through M2 macrophage infiltration, and more in-depth studies are needed to confirm the important roles and pathways of these genes.
The expression of TFs and their regulatory activities are important for resolving complex life activities, and dysregulation of gene expression has been associated with disease.Citation65 Alterations in the expression levels of miRNAs cause adverse effects such as cardiomyocyte damage, cardiac fibrosis, angiogenesis, and inflammatory responses.Citation66 Dysregulation of miRNA and TF expression in early stages underlies the development of AF.Citation67 Among the 4 target genes forming the TF-miRNA-mRNA regulatory network, we found that miRNAs and TFs targeting IGF1 were most abundant, and IGF1 and PDK4 were targeted by activated TF factor (STAT5A) and hsa-miR-152. In addition, RAB13 and IGF1 were targeted by activated TF factors (JUN and CTCF), whereas hsa-miR-19a and hsa-miR-19b were bridges connecting RAB13 and IGF1. Lu et al demonstrated that up-regulated hsa-miR-9, and hsa-miR-152 prevented intracellular Ca(2+) concentration by regulating the concentration of AF.Citation68 Evidence that miR-19a and miR-19b of the miR-19 family regulate cardiomyocyte proliferation and inhibit apoptosis.Citation69 We hypothesized that hsa-miR-152/IGF1 and hsa-miR-152/PDK4 might be potential therapeutic targets for AF; the activated expression of RAB13 and IGF1 might be caused by the activated expression of JUN,Citation70 which mediates the transcription of TGF-β, and CTCF,Citation71 which regulates the state transition of immune cells; and the silencing of hsa-miR-9 and hsa-miR-152 might contribute to the expression of RAB13 and IGF1, whereas blockade of this regulation might delay the progression of AF. Many of experimental studies will be needed in the future to validate the rules and pathways proposed here.
To further illustrate the biological pathways of the core genes in the pathological process of AF, we performed single-gene GSEA enrichment analysis. The results showed that four core genes were enriched in Circadian rhythm, Fatty acid metabolism, PPAR signaling pathway, Phagosome, ECM-receptor interaction, and Endocytosis. The results of the analysis drew our attention to fatty acid metabolism and PPAR. Previous studies have found that plasma free fatty acid may be a potential biomarker for predicting outcome events in stroke patients with AF in conjunction with the CHADS 2 and CHA 2 DS 2 -VASc scoring systems.Citation72 Pericardial fat is a rich source of inflammatory mediators, leading to structural remodeling of the atria and fibrosis by contributing to the onset and persistence of AF.Citation73 In this study, we examined the role of collagen remodeling and fatty acid metabolism in the development and persistence of AF. Correlated biomarkers between collagen remodeling and dysregulation of fatty acid metabolism are involved in structural remodeling in AF.Citation74,Citation75 PPAR is an important signaling pathway that regulates macrophage metabolism and promotes M2-phenotyping.Citation76 PPAR regulates the expression of a variety of genes involved in myocardial energy metabolism to adapt to various pathophysiological conditions in the heart.Citation77 Some studies have revealed that AF is a major cause of cardiovascular disease by means of transcriptomics and proteomic histology analyses revealed that the expression of various genes and proteins in the atrial tissues of patients with AF with VHD was closely related to the PPAR signaling pathway.Citation47 Combined with our results, we hypothesized that IGF1, RAB13, TMEM176B, and PDK4 may regulate the progression of AF through the PPAR signaling pathway and fatty acid metabolism.
Our study comprehensively analyzed the cellular heterogeneity of AF and speculates on the expression patterns of AF gene markers associated with M2 macrophages. However, due to the limited number of human LAA specimens in public databases, increasing the sample size further may enhance the credibility and authenticity of the findings. Additionally, expanding the study into multi-omics fields such as proteomics, metabolomics, and epigenetics could contribute to a more comprehensive understanding of the disease process and uncover the underlying molecular mechanisms of AF. Finally, the putative regulatory networks and signaling pathways based on target genes need to be validated through additional experimental studies.
Conclusion
In Conclusion, our findings suggest that over infiltration of M2 macrophages may be an important factor in the progression of AF, while M2 macrophage-related genes IGF1, RAB13, TMEM176B, and PDK4 may regulate the progression of AF through the PPAR signaling pathway and fatty acid metabolism. Our study reveals the characteristics of immune cell infiltration and the expression pattern of M2-like macrophage-related genes in LAA tissues of AF patients at the cellular and molecular levels, providing new theoretical insights for the early diagnosis and treatment of AF.
Abbreviations
AF, Atrial Fibrillation; DEGs, Differentially Expressed Genes; scRNA-seq, Single-cell RNA Sequencing; LAA, Left Atrial Appendage; Bulk RNA-seq, Bulk RNA Sequencing; VHD, Valvular Heart Disease; hdWGCNA, High-dimensional Weighted Gene Co-expression Network Analysis; LASSO, Least Absolute Shrinkage and Selection Operator; ROC, Receiver Operating Characteristic; qPCR, Quantitative Polymerase Chain Reaction; GEO, Gene Expression Omnibus; PCA, Principal Component Analysis; GO, Gene Ontology; KEGG, Kyoto Encyclopedia of Genes and Genomes; CIBERSORT, Cell-type Identification By Estimating Relative Subsets Of RNA Transcripts; ME, Module Eigengene; MM, Module Membership; GS, Gene Significance; QC, Quality Control; UMIs, Unique Molecular Identifiers; PCs, Principal Components; UMAP, Uniform Manifold Approximation and Projection; TOM, Topological Overlap Matrix; AUC, Area Under the Curve; RT-qPCR, Reverse Transcription quantitative Polymerase Chain Reaction; miRNAs, microRNAs; TFs, Transcription Factors; GSEA, Gene Set Enrichment Analysis; NK cells, Natural Killer cells; DC, Dendritic Cells; ECV, Electrical Cardioversion; MS4, Membrane-spanning 4-domain.
Ethics Statement
All studies involving human specimens were conducted in accordance with the ethical policies and procedures approved by the Human Ethics Committee of Yunnan University Hospital (No. 2022200). Written informed consent was obtained from each patient prior to their inclusion in the study. The study complied with the principles set out in the Declaration of Helsinki.
Author Contributions
All authors have made significant contributions to the work presented, whether in the conception, study design, data acquisition, analysis and interpretation, or across all these domains. They participated in drafting, revising, or critically reviewing the article, gave final approval for the version to be published, selected the journal for submission of the article, and agreed to take responsibility for all aspects of the work.
Disclosure
The authors have no conflicts of interest to declare in this work.
Data Sharing Statement
All data and materials utilized in this study are accessible upon reasonable request from the corresponding author.
Additional information
Funding
References
- Heijman J, Guichard JB, Dobrev D, Nattel S. Translational Challenges in Atrial Fibrillation. Circ Res. 2018;122(5):752–773. doi:10.1161/circresaha.117.311081
- Lippi G, Sanchis-Gomar F, Cervellin G. Global epidemiology of atrial fibrillation: an increasing epidemic and public health challenge. Int J Stroke. 2021;16(2):217–221. doi:10.1177/1747493019897870
- Nattel S, Sager PT, Hüser J, Heijman J, Dobrev D. Why translation from basic discoveries to clinical applications is so difficult for atrial fibrillation and possible approaches to improving it. Cardiovasc Res. 2021;117(7):1616–1631. doi:10.1093/cvr/cvab093
- Dzeshka MS, Lip GY, Snezhitskiy V, Shantsila E. Cardiac fibrosis in patients with atrial fibrillation: mechanisms and clinical implications. J Am Coll Cardiol. 2015;66(8):943–959. doi:10.1016/j.jacc.2015.06.1313
- Nattel S, Harada M. Atrial remodeling and atrial fibrillation: recent advances and translational perspectives. J Am Coll Cardiol. 2014;63(22):2335–2345. doi:10.1016/j.jacc.2014.02.555
- Kowalewski C. Elektrokardiographisches Mapping von Vorhofflimmern: eine Übersicht potenzieller Vorhofflimmermechanismen [Mapping atrial fibrillation: an overview of potential mechanisms underlying atrial fibrillation]. Herz. 2021;46(4):305–311. German. doi:10.1007/s00059-021-05045-y
- Chahine Y, Akoum N. Fibrosis: a nexus between atrial fibrillation and left atrial appendage thrombosis. J Cardiovasc Electrophysiol. 2022;33(4):688–689. doi:10.1111/jce.15382
- Liu Y, Shi Q, Ma Y, Liu Q. The role of immune cells in atrial fibrillation. J Mol Cell Cardiol. 2018;123:198–208. doi:10.1016/j.yjmcc.2018.09.007
- Yao Y, Yang M, Liu D, Zhao Q. Immune remodeling and atrial fibrillation. Front Physiol. 2022;13:927221. doi:10.3389/fphys.2022.927221
- Nattel S. Molecular and cellular mechanisms of atrial fibrosis in atrial fibrillation. JACC Clin Electrophysiol. 2017;3(5):425–435. doi:10.1016/j.jacep.2017.03.002
- Zhou X, Dudley SC. Evidence for inflammation as a driver of atrial fibrillation. Front Cardiovasc Med. 2020;7:62. doi:10.3389/fcvm.2020.00062
- Iwasaki YK, Nishida K, Kato T, Nattel S. Atrial fibrillation pathophysiology: implications for management. Circulation. 2011;124(20):2264–2274. doi:10.1161/CIRCULATIONAHA.111.019893
- Rudolph V, Andrié RP, Rudolph TK, et al. Myeloperoxidase acts as a profibrotic mediator of atrial fibrillation. Nat Med. 2010;16(4):470–474. doi:10.1038/nm.2124
- Tian Y, Liu S, Zhang Y, et al. Immune infiltration and immunophenotyping in atrial fibrillation. Aging. 2023;15(1):213–229. doi:10.18632/aging.204470
- Marcus GM, Smith LM, Glidden DV, et al. Markers of inflammation before and after curative ablation of atrial flutter. Heart Rhythm. 2008;5(2):215–221. doi:10.1016/j.hrthm.2007.10.007
- Zou R, Zhang D, Lv L, et al. Bioinformatic gene analysis for potential biomarkers and therapeutic targets of atrial fibrillation-related stroke. J Transl Med. 2019;17(1):45. doi:10.1186/s12967-019-1790-x
- Liu A, Jia K, Liang H, Jin Q. Comprehensive analysis of autophagy-related genes and patterns of immune cell infiltration in valvular atrial fibrillation. BMC Cardiovasc Disord. 2021;21(1):132. doi:10.1186/s12872-021-01939-1
- Fujiu K, Nagai R. Contributions of cardiomyocyte-cardiac fibroblast-immune cell interactions in heart failure development. Basic Res Cardiol. 2013;108(4):357. doi:10.1007/s00395-013-0357-x
- Ock S, Ham W, Kang CW, Kang H, Lee WS, Kim J. IGF-1 protects against angiotensin II-induced cardiac fibrosis by targeting αSMA. Cell Death Amp Dis. 2021;12(7):688. doi:10.1038/s41419-021-03965-5
- Revelo XS, Parthiban P, Chen C, et al. Cardiac resident macrophages prevent fibrosis and stimulate angiogenesis. Circ Res. 2021;129(12):1086–1101. doi:10.1161/circresaha.121.319737
- Borowiec A, Kontny E, Smolis-Bąk E, et al. Prospective assessment of cytokine IL-15 activity in patients with refractory atrial fibrillation episodes. Cytokine. 2015;74(1):164–170. doi:10.1016/j.cyto.2015.04.002
- Wang CH, Hu DY, Tang CZ, et al. 风湿性心脏瓣膜病慢性心房颤动患者白细胞介素-1β和肿瘤坏死因子-α蛋白表达的研究[Changes of interleukin-1beta and tumor necrosis factor-alpha of right atrial appendages in patients with rheumatic valvular disease complicated with chronic atrial fibrillation]. Zhonghua xin xue guan Bing za zhi. 2005;33(6):522–525. Chinese. doi:10.3760/cma.j.cn112148-20231018-00339
- Bosco MC. Macrophage polarization: reaching across the aisle? 2019/4/1. J Allergy Clin Immunol. 2019;143(4):1348–1350. doi:10.1016/j.jaci.2018.12.995
- Sun Z, Ying X, Zhao W, et al. M2c macrophages prevent atrial fibrillation in association with the inhibition of KCNQ1 in human embryonic stem cell-derived atrial-like cardiomyocytes. Hellenic J Cardiol. 2021;62(6):457–459. doi:10.1016/j.hjc.2021.01.004
- Dang B, Gao Q, Zhang L, et al. The glycolysis/HIF-1α axis defines the inflammatory role of IL-4-primed macrophages. Cell Rep. 2023;42(5):112471. doi:10.1016/j.celrep.2023.112471
- Li B, Wang L, Qi X, et al. NOTCH signaling inhibition after DAPT treatment exacerbates alveolar echinococcosis hepatic fibrosis by blocking M1 and enhancing M2 polarization. FASEB J. 2023;37(5):e22901. doi:10.1096/fj.202202033R
- Li Q, Cheng Y, Zhang Z, et al. Inhibition of ROCK ameliorates pulmonary fibrosis by suppressing M2 macrophage polarisation through phosphorylation of STAT3. Clin Transl Med. 2022;12(10):e1036. doi:10.1002/ctm2.1036
- Sheng Y, Wang YY, Chang Y, et al. Deciphering mechanisms of cardiomyocytes and non-cardiomyocyte transformation in myocardial remodeling of permanent atrial fibrillation. J Adv Res. 2023;16:S2090. doi:10.1016/j.jare.2023.09.012
- Lafuse WP, Wozniak DJ, Rajaram MVS. Role of cardiac macrophages on cardiac inflammation, fibrosis and tissue repair. Cells. 2020;10(1):51. doi:10.3390/cells10010051
- Andrews TS, Kiselev VY, McCarthy D, Hemberg M. Tutorial: guidelines for the computational analysis of single-cell RNA sequencing data. Nat Protocols. 2021;16(1):1–9. doi:10.1038/s41596-020-00409-w
- Dick SA, Macklin JA, Nejat S, et al. Self-renewing resident cardiac macrophages limit adverse remodeling following myocardial infarction. Nat Immunol. 2019;20(1):29–39. doi:10.1038/s41590-018-0272-2
- Frangogiannis NG. Matricellular proteins in cardiac adaptation and disease. Physiol Rev. 2012;92(2):635–688. doi:10.1152/physrev.00008.2011
- Hulsmans M, Schloss MJ, Lee IH, et al. Recruited macrophages elicit atrial fibrillation. Science. 2023;381(6654):231–239. doi:10.1126/science.abq3061
- Newman AM, Liu CL, Green MR, et al. Robust enumeration of cell subsets from tissue expression profiles. Nat Methods. 2015;12(5):453–457. doi:10.1038/nmeth.3337
- Morabito S, Reese F, Rahimzadeh N, Miyoshi E, Swarup V. hdWGCNA identifies co-expression networks in high-dimensional transcriptomics data. Cell Rep Methods. 2023;3(6):100498. doi:10.1016/j.crmeth.2023.100498
- Chen MC, Chang JP, Liu WH, et al. Increased inflammatory cell infiltration in the atrial myocardium of patients with atrial fibrillation. Am J Cardiol. 2008;102(7):861–865. doi:10.1016/j.amjcard.2008.05.038
- Hu YF, Chen YJ, Lin YJ, Chen SA. Inflammation and the pathogenesis of atrial fibrillation. Nat Rev Cardiol. 2015;12(4):230–243. doi:10.1038/nrcardio.2015.2
- Apostolakis S, Lip GY, Shantsila E. Monocytes in heart failure: relationship to a deteriorating immune overreaction or a desperate attempt for tissue repair? Cardiovasc Res. 2010;85(4):649–660. doi:10.1093/cvr/cvp327
- Fujiu K, Wang J, Nagai R. Cardioprotective function of cardiac macrophages. Cardiovasc Res. 2014;102(2):232–239. doi:10.1093/cvr/cvu059
- Kubota A, Frangogiannis NG. Macrophages in myocardial infarction. Am J Physiol Cell Physiol. 2022;323(4):C1304–C1324. doi:10.1152/ajpcell.00230.2022
- Zaman R, Epelman S. Resident cardiac macrophages: heterogeneity and function in health and disease. Immunity. 2022;55(9):1549–1563. doi:10.1016/j.immuni.2022.08.009
- Chen Q, Hu C, Lu W, et al. Characteristics of alveolar macrophages in bronchioalveolar lavage fluids from active tuberculosis patients identified by single-cell RNA sequencing. J Biomed Res. 2022;36(3):167–180. doi:10.7555/jbr.36.20220007
- Westermann D, Lindner D, Kasner M, et al. Cardiac inflammation contributes to changes in the extracellular matrix in patients with heart failure and normal ejection fraction. Circulation. 2011;4(1):44–52. doi:10.1161/CIRCHEARTFAILURE.109.931451
- Trial J, Cieslik KA, Haudek SB, Duerrschmid C, Entman ML. Th1/M1 conversion to th2/m2 responses in models of inflammation lacking cell death stimulates maturation of monocyte precursors to fibroblasts. Front Immunol. 2013;4:287. doi:10.3389/fimmu.2013.00287
- Cheng WL, Kao YH, Chen YC, Lin YK, Chen SA, Chen YJ. Macrophage migration inhibitory factor increases atrial arrhythmogenesis through CD74 signaling. Transl Res. 2020;216:43–56. doi:10.1016/j.trsl.2019.10.002
- Wu Y, Zhan S, Chen L, et al. TNFSF14/LIGHT promotes cardiac fibrosis and atrial fibrillation vulnerability via PI3Kγ/SGK1 pathway-dependent M2 macrophage polarisation. J Transl Med. 2023;21(1):544. doi:10.1186/s12967-023-04381-3
- Chen HX, Li MY, Jiang YY, et al. Role of the PPAR pathway in atrial fibrillation associated with heart valve disease: transcriptomics and proteomics in human atrial tissue. Signal Transduct Target Ther. 2020;5(1):4. doi:10.1038/s41392-019-0093-2
- Zhu X, Zhang X, Cong X, Zhu L, Ning Z, Mone P. ANGPTL4 attenuates ang II-induced atrial fibrillation and fibrosis in mice via PPAR pathway. Cardiol Res Pract. 2021;2021:9935310. doi:10.1155/2021/9935310
- Wei B, Huang X, Lu Y, Xie D, Wei G, Wen W. Screening of atrial fibrillation diagnostic markers based on a GEO database chip and bioinformatics analysis. J Thoracic Dis. 2022;14(12):4773–4784. doi:10.21037/jtd-22-1457
- Watson CJ, Glezeva N, Horgan S, et al. Atrial tissue pro-fibrotic M2 macrophage marker CD163+, gene expression of procollagen and B-type natriuretic peptide. J Am Heart Assoc. 2020;9(11):e013416. doi:10.1161/JAHA.119.013416
- Browaeys R, Saelens W, Saeys Y. NicheNet: modeling intercellular communication by linking ligands to target genes. Nature Methods. 2020;17(2):159–162. doi:10.1038/s41592-019-0667-5
- Zhang Y, Liu T, Hu X, et al. CellCall: integrating paired ligand-receptor and transcription factor activities for cell-cell communication. Nucleic Acids Res. 2021;49(15):8520–8534. doi:10.1093/nar/gkab638
- Teocchi MA, D’Souza-Li L. Apoptosis through death receptors in temporal lobe epilepsy-associated hippocampal sclerosis. Mediators Inflammat. 2016;2016:8290562. doi:10.1155/2016/8290562
- Caminero A, Comabella M, Montalban X. Role of tumour necrosis factor (TNF)-α and TNFRSF1A R92Q mutation in the pathogenesis of TNF receptor-associated periodic syndrome and multiple sclerosis. Clin Exp Immunol. 2011;166(3):338–345. doi:10.1111/j.1365-2249.2011.04484.x
- Wang Y, Cai H, Li H, Gao Z, Song K. Atrial overexpression of microRNA-27b attenuates angiotensin II-induced atrial fibrosis and fibrillation by targeting ALK5. Hum Cell. 2018;31(3):251–260. doi:10.1007/s13577-018-0208-z
- Raman K, Aeschbacher S, Bossard M, et al. Whole blood gene expression differentiates between atrial fibrillation and sinus rhythm after cardioversion. PLoS One. 2016;11(6):e0157550. doi:10.1371/journal.pone.0157550
- Zhang Y, Ma K, Sadana P, et al. Estrogen-related receptors stimulate pyruvate dehydrogenase kinase isoform 4 gene expression. J Biol Chem. 2006;281(52):39897–39906. doi:10.1074/jbc.M608657200
- Palomer X, Alvarez-Guardia D, Rodríguez-Calvo R, et al. TNF-alpha reduces PGC-1alpha expression through NF-kappaB and p38 MAPK leading to increased glucose oxidation in a human cardiac cell model. Cardiovasc Res. 2009;81(4):703–712. doi:10.1093/cvr/cvn327
- Moreira LM, Takawale A, Hulsurkar M, et al. Paracrine signalling by cardiac calcitonin controls atrial fibrogenesis and arrhythmia. Nature. 2020;587(7834):460–465. doi:10.1038/s41586-020-2890-8
- Hu HJ, Zhang C, Tang ZH, Qu SL, Jiang ZS. Regulating the Warburg effect on metabolic stress and myocardial fibrosis remodeling and atrial intracardiac waveform activity induced by atrial fibrillation. Biochem Biophys Res Commun. 2019;516(3):653–660. doi:10.1016/j.bbrc.2019.06.055
- Yeo JC, Wall AA, Luo L, Stow JL. Sequential recruitment of Rab GTPases during early stages of phagocytosis. Cellular Logistics. 2016;6(1):e1140615. doi:10.1080/21592799.2016.1140615
- Fan Y, Han Q, Li J, et al. Revealing potential diagnostic gene biomarkers of septic shock based on machine learning analysis. BMC Infect Dis. 2022;22(1):65. doi:10.1186/s12879-022-07056-4
- Taams LS, de Gruijl TD. Immune checkpoint inhibition: from molecules to clinical application. Clin Exp Immunol. 2020;200(2):105–107. doi:10.1111/cei.13434
- Hill M, Russo S, Olivera D, Malcuori M, Galliussi G, Segovia M. The intracellular cation channel TMEM176B as a dual immunoregulator. Front Cell Develop Biol. 2022;10:1038429. doi:10.3389/fcell.2022.1038429
- Herrer I, Roselló-Lletí E, Ortega A, et al. Gene expression network analysis reveals new transcriptional regulators as novel factors in human ischemic cardiomyopathy. BMC Med Genomics. 2015;8(1):14. doi:10.1186/s12920-015-0088-y
- Chen C, Ponnusamy M, Liu C, Gao J, Wang K, Li P. MicroRNA as a Therapeutic Target in Cardiac Remodeling. Biomed Res Int. 2017;2017:1278436. doi:10.1155/2017/1278436
- Torrado M, Franco D, Lozano-Velasco E, et al. A MicroRNA-transcription factor blueprint for early atrial arrhythmogenic remodeling. Biomed Res Int. 2015;2015:263151. doi:10.1155/2015/263151
- Lu Y, Hou S, Huang D, et al. Expression profile analysis of circulating microRNAs and their effects on ion channels in Chinese atrial fibrillation patients. Int J Clin Exp Med. 2015;8(1):845–853.
- Li X, Teng C, Ma J, et al. miR-19 family: a promising biomarker and therapeutic target in heart, vessels and neurons. Life Sci. 2019;232:116651. doi:10.1016/j.lfs.2019.116651
- Zhang Y, Feng XH, Derynck R. Smad3 and Smad4 cooperate with c-Jun/c-Fos to mediate TGF-beta-induced transcription. Nature. 1998;394(6696):909–913. doi:10.1038/29814
- Stik G, Vidal E, Barrero M, et al. CTCF is dispensable for immune cell transdifferentiation but facilitates an acute inflammatory response. Nat Genet. 2020;52(7):655–661. doi:10.1038/s41588-020-0643-0
- Choi JY, Jung JM, Kwon DY, et al. Free fatty acid as an outcome predictor of atrial fibrillation-associated stroke. Ann Neurol. 2016;79(2):317–325. doi:10.1002/ana.24568
- Scridon A, Dobreanu D, Chevalier P, Şerban RC. Inflammation, a link between obesity and atrial fibrillation. Inflammation Res. 2015;64(6):383–393. doi:10.1007/s00011-015-0827-8
- Odeh A, Dungan GD, Darki A, et al. Collagen remodeling and fatty acid regulation biomarkers in understanding the molecular pathogenesis of atrial fibrillation. Clin App Thrombosis Hemostasis. 2022;28:10760296221145181. doi:10.1177/10760296221145181
- Li ZZ, D X, Guo XY, et al. Association between blood lipid profiles and atrial fibrillation: a case-control study. Med Sci Monit. 2018;24:3903–3908. doi:10.12659/MSM.907580
- Mouton AJ, Li X, Hall ME, Hall JE. Obesity, hypertension, and cardiac dysfunction: novel roles of immunometabolism in macrophage activation and inflammation. Circ Res. 2020;126(6):789–806. doi:10.1161/CIRCRESAHA.119.312321
- Finck BN, Kelly DP. Peroxisome proliferator-activated receptor gamma coactivator-1 (PGC-1) regulatory cascade in cardiac physiology and disease. Circulation. 2007;115(19):2540–2548. doi:10.1161/circulationaha.107.670588