
Abstract
Background
This study addresses the predictive modeling of Enlarged Perivascular Spaces (EPVS) in neuroradiology and neurology, focusing on their impact on Cerebral Small Vessel Disease (CSVD) and neurodegenerative disorders.
Methods
A retrospective analysis was conducted on 587 neurology inpatients, utilizing LASSO regression for variable selection and logistic regression for model development. The study included comprehensive demographic, medical history, and laboratory data analyses.
Results
The model identified key predictors of EPVS, including Age, Hypertension, Stroke, Lipoprotein a, Platelet Large Cell Ratio, Uric Acid, and Albumin to Globulin Ratio. The predictive nomogram demonstrated strong efficacy in EPVS risk assessment, validated through ROC curve analysis, calibration plots, and Decision Curve Analysis.
Conclusion
The study presents a novel, robust EPVS predictive model, providing deeper insights into EPVS mechanisms and risk factors. It underscores the potential for early diagnosis and improved management strategies in neuro-radiology and neurology, highlighting the need for future research in diverse populations and longitudinal settings.
Introduction
In the interdisciplinary domain of neuro-radiology and neurology, the significance of Enlarged Perivascular Spaces (EPVS) is increasingly recognized,Citation1,Citation2 especially in relation to their impact on Cerebral Small Vessel Disease (CSVD)Citation2,Citation3 and other neurodegenerative disorders. EPVS, commonly observed phenomena in brain MRI, traditionally considered benign manifestations of cerebral aging and small vessel changes, are now understood to be linked with complex conditions such as stroke,Citation4 cognitive impairment, Alzheimer’s, and Parkinson’s disease.Citation5–9
The unique morphology and distribution of EPVS in neuroimaging offer a distinct perspective for exploring cerebral microenvironments. Despite this growing recognition of their neuropathological importance, the clinical implications and mechanisms of EPVS remain elusive.Citation10,Citation11 Notably, in clinical neurology, the absence of quantitative assessments and robust diagnostic predictive models for EPVS limits their utility in disease management and therapeutic decision-making.
This study, through a retrospective analysis of 587 neurology inpatients, including CSVD patients and a control group, aims to bridge this gap. Incorporating a comprehensive array of 88 variables, including head MRI images, demographics, medical histories, and a spectrum of laboratory markers, we employ LASSO regression for key variable selection, followed by logistic regression modeling. The model is visualized using Nomograms and further validated through ROC, Calibration, and DCA curves to ensure accuracy and applicability.
Our objective is to develop an accurate and practical diagnostic model for EPVS, utilizing a comprehensive statistical approach. As EPVS are increasingly recognized as indicators of underlying cerebral pathologies that may affect the progression and treatment of various neurodegenerative and vascular conditions, a robust predictive model is essential. Such a model would allow clinicians to identify patients at high risk of adverse outcomes earlier, enabling more targeted interventions. This advancement is expected to improve patient management significantly, highlighting the need for advanced diagnostic tools to address the complex presentations of EPVS. We anticipate that this model will enhance the diagnosis and treatment of CSVD and related conditions, offering novel insights and substantial contributions to neuroscience and geriatric medicine.
Materials and Methods
Study Population and Design
This retrospective study, undertaken at a major hospital in Baoding, China, between January 2020 and June 2022, was dedicated to discovering imaging markers indicative of cerebral small vessel disease (CSVD). Comprehensive analysis of existing patient records was methodically conducted to ensure thorough data evaluation. Participants aged 55 older above who underwent complete cranial magnetic resonance imaging (MRI) scans were included. These scans encompassed T1-weighted axial, T2-weighted axial, FLAIR, and axial susceptibility-weighted imaging techniques. The inclusion criteria for CSVD were based on radiological criteria, including evidence of lacunar infarcts, white matter hyperintensities, and microbleeds characteristic of small vessel disease. The selection criteria were carefully developed to accurately represent this patient cohort, with specific emphasis on the integrity and precision of the MRI sequences used to diagnose CSVD. Criteria for exclusion were established to filter out any instances potentially skewing the results. This encompassed patients with subpar MRI scans, notable histories of stroke, or severe concurrent medical conditions likely to affect the study outcomes. These conditions included, but were not limited to, significant cardiac ailments (like acute myocardial infarction or severe heart failure), major infections, pronounced respiratory failure, advanced renal or hepatic disorders, tumors, or any other ailments that could lead to irregular laboratory findings. Additionally, cases indicative of non-vascular causes of CSVD, such as multiple sclerosis, brain tumors, or demyelinating diseases of the central nervous system, were excluded, along with records lacking ample clinical or lab data. In strict compliance with data privacy norms, all patient records were anonymized, ensuring the removal of personal identifiers before analysis. This procedure adhered closely to data protection regulations.
Owing to the retrospective nature of the study, the need for individual informed consent was waived by the Institutional Review Board (IRB). This waiver was granted under the premise that the study involved minimal risk to participants, focusing on the analysis of anonymized, pre-existing patient records. The ethics of this study, including the consent waiver, was thoroughly reviewed and approved by the Institutional Ethics Committee of the Affiliated Hospital of Hebei University, Baoding, China (Approval Number HDFYLL-KY-2023-060). This committee’s comprehensive evaluation ensured that the study adhered to the highest ethical standards, as set forth in the 1964 Declaration of Helsinki and its later amendments, particularly concerning patient privacy, data confidentiality, and ethical research practices.
MRI Acquisition and Assessment for EPVS
In this study, participants underwent brain MRI examinations using a 1.5T MRI scanner (Siemens, Munich, Germany) to assess the presence of Enlarged Perivascular Spaces (EPVS). The MRI protocol was specifically tailored to enhance the detection of EPVS and included axial T1-weighted, T2-weighted fluid-attenuated inversion recovery (FLAIR), and particularly, axial T2*-weighted gradient-recalled echo (GRE) sequences. Imaging parameters were precisely calibrated to optimize the visualization of EPVS: a slice thickness of 5 mm with a 1-mm interslice gap was uniformly applied across all sequences. The T2*-weighted GRE sequence, pivotal for EPVS identification, had repetition time (TR)/echo time (TE) parameters set at 560/23 ms. EPVS are recognized in neuroimaging as cerebrospinal fluid-filled spaces that follow the course of penetrating arteries and veins within the brain. They are typically observed in T2-weighted and FLAIR sequences. On these sequences, EPVS appear as hyperintense (bright) structures, reflecting their fluid content and distinguishing them from the surrounding brain parenchyma.Citation1,Citation2 It is essential to differentiate EPVS from other similar appearing structures such as lacunar infarcts or dilated Virchow-Robin spaces. Special attention is needed for lesions located in regions prone to artifacts, like near air-filled cavities. The identification and accurate mapping of EPVS were independently carried out by two experienced neuroimaging specialists, Yan Hou and Huan Zhou, who were blinded to the clinical information of the participants to minimize assessment bias. The interrater reliability of their evaluations was measured using the intraclass correlation coefficient (ICC). An ICC value of 0.87 was achieved, indicating a high level of agreement, thus reflecting the consistency between the raters in identifying EPVS.
Clinical Blood Biochemistry Analysis
In this retrospective patient cohort study, we amassed an extensive dataset, encapsulating 81 distinct laboratory parameters. This dataset incorporated comprehensive blood biochemistry markers, including complete blood count, renal and liver function tests, electrolyte levels, coagulation profiles, glucose levels (random and fasting), lipid profiles, cardiac enzymes, thyroid functions, and homocysteine levels. These markers collectively painted a detailed clinical portrait of each participant’s health.
Clinical Evaluation
Additionally, a detailed clinical evaluation was conducted for each participant, encompassing demographic data collection and a comprehensive medical history review. Special attention was given to hypertension, diabetes, hypercholesterolemia, carotid artery atherosclerosis, and stroke history. Hypertension was diagnosed based on blood pressure readings or antihypertensive medication use, diabetes through fasting glucose levels, OGTT2h readings, or hypoglycemic treatment, and hypercholesterolemia was identified by elevated total or LDL cholesterol levels. Carotid atherosclerosis was determined through historical data or ultrasound findings. This comprehensive approach ensured an in-depth assessment of each patient’s health status, contributing significantly to the study’s findings.
Statistical Analysis
In the statistical component of our study for developing a EPVS prediction model, we scrutinized a cohort comprising 587 individuals. This cohort was bifurcated into two distinct groups: a primary training group consisting of 412 participants and a validation group with 175 participants, adhering to a ratio of 7:3. This strategic segmentation was essential for the thorough training of the model and its subsequent validation phase. We transformed continuous variables into categories for the EPVS prediction model. This practice, widely recognized in risk prediction research, enhances the model’s interpretability and general applicability. The process of categorization, pivotal in clinical data handling, simplifies interpretation and enhances clinical relevance.Citation12,Citation13 The cutoffs for these categories were determined using R software. Variables without predetermined cutoffs were pragmatically segregated into binary or trinary categories. These categorical variables were represented as frequencies and percentages. To examine the baseline characteristics across EPVS-positive and EPVS-negative groups, we applied suitable statistical tests based on the data type. The χ2 tests or Fisher’s exact tests were utilized for categorical data analysis. The training group underwent a variable selection process via the Least Absolute Shrinkage and Selection Operator (LASSO) regression technique. LASSO regression, renowned for minimizing overfitting and honing in on pertinent predictors, is reinforced by cross-validation. The ideal lambda value was ascertained using the lambda.1se criterion, which selects the most regularized model within one standard error of the minimal cross-validation error. Significant predictors identified from LASSO regression were integrated into a binary logistic regression framework to pinpoint independent predictors for EPVS. We constructed a nomogram from these predictors to visually depict the risk factors and their relative significance in predicting EPVS. The nomogram’s performance was evaluated through Receiver Operating Characteristic Curve (ROC) analysis by computing the Area Under the Curve (AUC). Calibration plots, which juxtapose predicted probabilities against actual outcomes, were generated to assess the model’s precision. Additionally, we conducted Decision Curve Analysis (DCA) to ascertain the clinical utility of our model, evaluating net benefits across various probability thresholds. All statistical procedures were executed using R software (version 4.3.0). We deemed a p-value below 0.05 as indicative of statistical significance. This comprehensive statistical approach guarantees a robust and reliable framework for our EPVS prediction model, contributing to the nuanced understanding of EPVS in our study population.
Results
Baseline Characteristics
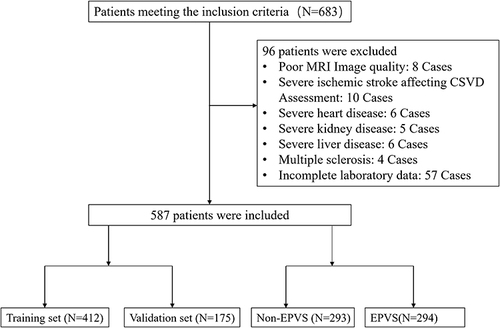
From January 2020 through June 2022, our preliminary assessment for the EPVS predictive model encompassed 683 candidates. Careful screening led to the exclusion of 96 individuals who met one or more exclusion criteria, culminating in a focused cohort of 587 patients. This cohort was systematically categorized into a training group of 412 individuals and a validation group comprising 175 individuals. The delineation of these groups, alongside the comprehensive process of inclusion and exclusion, is depicted in . Comprehensive baseline characteristics of the participants are systematically compiled in . This analysis highlights the presence of statistically significant disparities (P < 0.05) across 29 of the 88 variables examined, between groups identified with EPVS and those without. These findings cover a spectrum of biomarkers, underscoring the multifaceted nature of EPVS. Conversely, the remaining 59 variables demonstrated no significant differences, suggesting a uniformity in certain aspects of the study population. The 29 biomarkers with significant differences included: Hypertension, Gender, Stroke, Carotid Atherosclerosis, Age, Creatinine, Lipoprotein a, Homocysteine, Mean Corpuscular Hemoglobin Concentration, Mean Platelet Volume, Monocyte Count, Platelet Large Cell Ratio, Uric Acid, Chloride, International Normalized Ratio, Fibrinogen, Apolipoprotein A1, Apolipoprotein B100, Apolipoprotein E, Alanine Aminotransferase, Albumin, Thyroxine, Systemic Inflammation Response Index, Urea, Carbon Dioxide Content in Plasma, Low-Density Lipoprotein, Lymphocyte-to-Monocyte Ratio, Monocyte-to-HDL Ratio, Albumin to Globulin Ratio. Among the 88 variables analyzed, 59 biomarkers did not exhibit significant differences when comparing the EPVS and non-EPVS groups. These biomarkers include: Diabetes, Hyperlipidemia, White Blood Cell Count, Red Blood Cell Count, Hemoglobin, Hematocrit, Mean Corpuscular Volume, Mean Corpuscular Hemoglobin, Platelet Count, Platelet Distribution Width, Plateletcrit, Neutrophil Percentage, Lymphocyte Percentage, Monocyte Percentage, Eosinophil Percentage, Basophil Percentage, Neutrophil Count, Lymphocyte Count, Eosinophil Count, Basophil Count, Random Glucose, Potassium, Sodium, Calcium, Magnesium, Serum Phosphate, Prothrombin Time, Prothrombin Time Ratio, Activated Partial Thromboplastin Time, Thrombin Time, Fasting Glucose, Hemoglobin A1c, Total Cholesterol, Triglycerides, High-Density Lipoprotein, Very Low-Density Lipoprotein, ApoA1 to ApoB100 Ratio, Creatine Kinase, Creatine Kinase-MB, Alpha-Hydroxybutyrate Dehydrogenase, Aspartate Aminotransferase, Lactate Dehydrogenase, Alkaline Phosphatase, Gamma-Glutamyl Transferase, Total Protein, Globulin, Total Bilirubin, Direct Bilirubin, Unconjugated Bilirubin, Bile Acid, Triiodothyronine, Free Triiodothyronine, Free Thyroxine, Thyroid-Stimulating Hormone, Systemic Immune-Inflammatory Index, Neutrophil-to-Lymphocyte Ratio, Neutrophil-to-Monocyte Ratio, Neutrophil-to-HDL Ratio, Lymphocyte-to-HDL Ratio.
Table 1 Baseline Characteristics: Comparing EPVS Patients with Non-EPVS Patients
Figure 1 Flow diagram of the selection of eligible patients.
Variable Selection
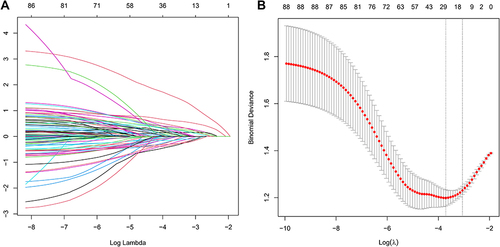
In our study to develop a predictive model for Enlarged Perivascular Spaces (EPVS), we initially focused on a dataset of 88 variables, including demographic details and a wide range of medical and laboratory data. Confronted with the challenge of multicollinearity and overfitting due to the high number of explanatory variables, we adopted the Least Absolute Shrinkage and Selection Operator (LASSO) regression. This method, implemented using R’s “glmnet package”, was particularly advantageous in handling numerous predictors, effectively minimizing the risk of overfitting while addressing multicollinearity. We further refined the model through a ten-fold cross-validation process, applying the 1SE criterion to optimize the regularization parameter λ ( and ). This systematic approach led us to identify thirteen key indicators significantly associated with EPVS, namely Stroke, Age, Creatinine, Lipoprotein a, Homocysteine, Platelet Large Cell Ratio, Uric Acid, Chloride, Alanine Aminotransferase, Urea, Lymphocyte-to-Monocyte Ratio, Albumin to Globulin Ratio, and Hypertension (). These variables, which retained non-zero coefficients in the LASSO model, not only enhance the model’s robustness and accuracy but also provide valuable insights into the pathophysiological mechanisms underpinning EPVS.
Table 2 Coefficients and lambda.1SE Value of the LASSO Regression
Figure 2 (A and B) Screening of variables based on LASSO regression model in the Training Group (412 patients). (A) This figure provides a visual representation of the LASSO model’s coefficient profiles for 88 features utilized in predicting EPVS risk. It graphically illustrates the variation of each feature’s coefficient with the logarithm of lambda (log(λ)), showcasing the LASSO method’s characteristic effect of coefficient shrinkage. (B) LASSO Regression Cross-Validation Results. This figure demonstrates the performance assessment of our model under varying λ parameters in LASSO regression, employing cross-validation. It features a vertical dashed line on the left, signifying λmin, indicative of the model’s optimal performance. To its right, another dashed line marks λ1SE, denoting a model that’s marginally more parsimonious. Annotations above each line display the count of variables chosen at these specific λ values.
Multivariable Analyses
In the multivariable analysis segment of our study, we incorporated thirteen variables selected through LASSO regression into a binary logistic regression analysis. This process elucidated that seven factors—Age, Hypertension, Stroke, Lipoprotein a, Platelet Large Cell Ratio, Uric Acid, and Albumin to Globulin Ratio—had a significant association with the likelihood of EPVS (P<0.05), as elaborated in . These results underscore their importance as independent predictors in the context of EPVS. Other variables, such as Creatinine, Homocysteine, Chloride, Alanine Aminotransferase, Urea, and Lymphocyte-to-Monocyte Ratio, were part of the analysis but did not show significant statistical relevance in this context.
Table 3 Binary Logistic Regression Analysis
Predictive Model Development
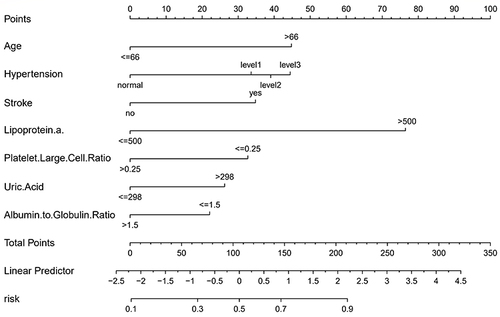
In our EPVS risk assessment study, we constructed a predictive model using binary logistic regression. This model, outlined in a nomogram (), incorporates significant variables like Age, Hypertension, Stroke, Lipoprotein a, Platelet Large Cell Ratio, Uric Acid, and Albumin to Globulin Ratio. The nomogram assigns individual scores to these variables, reflecting their relative importance in predicting EPVS risk. By summing these scores, it provides an overall risk estimation. The model’s integration of varied factors, spanning clinical and biochemical markers, offers a comprehensive tool for evaluating EPVS risk, thus supporting more nuanced clinical decision-making.
Figure 3 The figure presents a nomogram for estimating the likelihood of EPVS in patients. This nomogram calculates risk scores based on six specific indicators. Each indicator is aligned with a corresponding scale to determine its point value. The total score, summed from these individual points, is then located on the “Total Points“ axis. The probability of EPVS, as indicated by the nomogram, corresponds to this total score on the ”EPVS” probability scale.
Predictive Model Validation
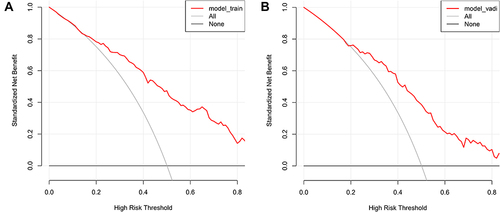
Our EPVS risk prediction nomogram underwent extensive validation, incorporating ROC curve analysis, calibration plots, and Decision Curve Analysis (DCA) across both training and validation cohorts. The ROC analysis indicated significant discriminative ability, with AUC values of 0.815 (95% CI: 0.774–0.856) for the training cohort and 0.770 (95% CI: 0.701–0.839) for the validation cohort, suggesting strong predictive accuracy ( and ). Sensitivity and specificity were 69.5% and 77.8% in the training set, and 57.0% and 85.4% in the validation set, respectively ( and ). Additionally, the Positive Predictive Value (PPV) was 0.732 and the Negative Predictive Value (NPV) was 0.725 in the training set, while in the validation set, the PPV was 0.713 and the NPV was 0.744, providing further insight into the model’s performance. Calibration plots for both sets ( and ) demonstrated close alignment between predicted and observed EPVS risks, underscoring the nomogram’s precision. The DCA ( and ) emphasized the nomogram’s practical utility in clinical decision-making, showing a significant improvement over standard care protocols. These collective validation techniques affirm the nomogram’s robustness and applicability as a valuable tool for EPVS risk assessment in clinical environments.
Figure 4 (A and B) Receiver Operating Characteristic (ROC) Curves for EPVS Predictive Model in Training Set (A) and Validation Set (B). The ROC curves plot the sensitivity against the specificity for various threshold levels.
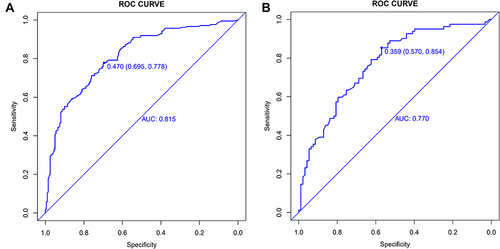
Figure 5 (A and B) showcase the calibration plots for our EPVS predictive model, utilizing data from the training and testing sets, respectively. These plots are instrumental in comparing the probabilities of EPVS predicted by our nomogram with the actual observed frequencies, thereby evaluating the model’s accuracy in predicting real-world outcomes.
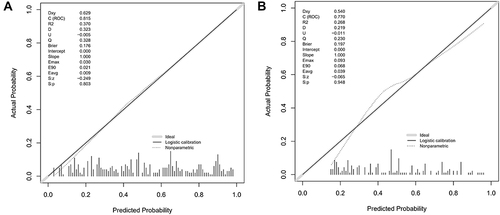
Figure 6 (A and B) These figures illustrate the Decision Curve Analysis (DCA) for the EPVS predictive model in both training (A) and validation (B) sets. The DCA plots show the model’s net benefit at various decision thresholds, compared to two extremes: treating every patient or none. The horizontal line in each plot indicates no treatment benefit, while the diagonal line suggests universal treatment. The model’s curves, deviating from these lines, demonstrate its practical value, balancing the advantages and drawbacks of model-based treatment decisions.
Discussion
In our study, we established a comprehensive predictive model for Enlarged Perivascular Spaces (EPVS) by analyzing a wide range of variables. Key findings indicate that Age, Hypertension, Stroke, Lipoprotein a, Platelet Large Cell Ratio, Uric Acid, and Albumin to Globulin Ratio are significant predictors of EPVS. This model enhances our understanding of EPVS, providing a nuanced approach to predicting its occurrence. Our findings highlight the importance of these variables in EPVS risk assessment, offering valuable insights for early detection and management in clinical settings. This research contributes significantly to the current literature on cerebral small vessel diseases, particularly in the context of neuro-radiology and neurology.
These findings not only align with existing literature but also offer new insights into the pathophysiological mechanisms underlying EPVS. Age emerged as a significant predictor of EPVS, potentially reflecting changes in cerebral vascular structure and function with advancing years. This observation is consistent with theories of cerebrovascular aging, which posit vascular aging as a critical factor in various neurodegenerative diseases.Citation14,Citation15 The significant associations of hypertension and stroke with EPVS underscore the importance of vascular health in the cerebral microenvironment. These factors may contribute to the development of EPVS by affecting vascular integrity and hemodynamics. The studies by Klarenbeek et al and Gao et al support this notion.Citation16,Citation17 The significant correlation with lipoprotein a suggests a role for lipid metabolism abnormalities in the development of EPVS. This may relate to atherosclerosis and vascular inflammation,Citation18,Citation19 known risk factors for cerebrovascular disease. The significant relationships of platelet large cell ratio and uric acid with EPVS may indicate the influence of blood components and metabolic status in the development of EPVS. Yang et al also found an independent association between serum uric acid levels and EPVS.Citation20 The significance of the albumin to globulin ratio may reflect the impact of protein metabolic status on cerebrovascular health. Studies by Deveci and Gazi (2021) and Chen et al suggest a potential link between this ratio and cardiovascular diseases and stroke.Citation21,Citation22 In summary, our study contributes to the existing literature by not only corroborating previous findings on traditional risk factors like hypertension but also by introducing and substantiating the role of additional biochemical markers in the pathogenesis of EPVS. The integration of these diverse predictors offers a more comprehensive understanding of EPVS, paving the way for future research and potential therapeutic interventions.
Our study is distinguished by its thorough data collection and advanced statistical methods, such as LASSO regression, which enhance the predictive precision of our EPVS model. This comprehensive and analytical approach significantly contributes to our understanding of EPVS’s multifaceted nature and sets a benchmark for future clinical and policy-related research in this field. However, the retrospective design of our study introduces certain limitations, including potential selection and information biases. These limitations restrict our ability to establish causality and may affect the generalizability of our findings. The specific patient population and healthcare setting of our study further constrain the broader application of our results. To overcome these limitations, future research should consider prospective studies with a more diverse patient cohort, which would help in validating and expanding upon our findings. This would enable a more balanced and extensive understanding of EPVS and its implications in diverse clinical settings.
Our study presents a pivotal advancement in understanding EPVS, marked by the development of a robust predictive model. Incorporating a comprehensive array of clinical and laboratory variables, our model demonstrates significant predictive power for EPVS, validated through extensive statistical analysis. However, it’s crucial to recognize the inherent limitations due to its retrospective nature, the specific patient population involved, and the absence of data on different stroke subtypes, which could influence the interpretations of EPVS associations. The absence of certain clinical outcomes such as hospital mortality rates also limits broader outcome assessments. While our focus was on identifying predictors of EPVS rather than post-hospitalization outcomes, future research could benefit from including these outcomes and detailed stroke subtype data to provide a more comprehensive view of the clinical trajectory of patients with EPVS. Future research should focus on prospective studies, expanding validation across diverse populations to enhance the model’s universal applicability. Investigating additional variables and conducting longitudinal studies would offer deeper insights into EPVS progression and impact. Moreover, exploring the effectiveness of various interventions on EPVS could lead to novel treatment strategies, significantly improving patient care in neurology and geriatric medicine. This comprehensive approach paves the way for groundbreaking contributions to the field, with the potential to transform clinical practices and patient outcomes globally.
This study represents a significant stride in understanding and predicting EPVS, a crucial aspect of cerebral small vessel diseases. Our comprehensive predictive model, informed by a diverse array of clinical and laboratory variables, has demonstrated notable efficacy in assessing EPVS risk. This model’s integration of key factors like age, hypertension, and specific biochemical markers offers a refined tool for early detection, potentially guiding more effective management strategies in neuro-radiology and neurology. However, the inclusion of stroke subtype data could further refine the predictive capabilities by distinguishing between the effects of different stroke mechanisms on EPVS formation. While our findings enrich the current understanding of EPVS, they also spotlight the necessity for future research. Future investigations could examine the integration of genetic markers and detailed lifestyle data, aiming to enhance personalized predictions and interventions. Additionally, longitudinal studies would provide valuable insights into the progression and long-term impact of EPVS across different populations. Prospective studies, broader population validations, and exploration of additional variables are essential to deepen our understanding and enhance the model’s applicability.
Conclusions
This study developed a predictive model for EPVS that incorporates clinical and biochemical markers, demonstrating significant predictive accuracy for CSVD. Key predictors identified include age, hypertension, stroke history, lipoprotein a, platelet large cell ratio, uric acid, and albumin to globulin ratio. These findings enrich our understanding of the risk factors for EPVS and underscore the potential for early intervention and targeted treatment strategies.
Our results underscore the value of using advanced statistical techniques such as LASSO regression for effective predictor selection in complex datasets. Future research should aim to validate these findings in broader populations and investigate the longitudinal impact of EPVS, thus enhancing the model’s clinical applicability and supporting personalized medicine approaches in neurology and geriatric care.
Ethics Approval and Informed Consent
This study involving human participants was reviewed and approved by the Institutional Review Board (IRB) of the Affiliated Hospital of Hebei University, Baoding, China. The study was conducted in accordance with the ethical standards as laid down in the 1964 Declaration of Helsinki and its later amendments or comparable ethical standards. The IRB approval number for this study is HDFYLL-KY-2023-060. Given the retrospective nature of the study, utilizing anonymized patient records, the requirement for individual informed consent was waived by the Institutional Review Board. All patient data were handled with strict confidentiality and in compliance with data protection regulations.
Disclosure
The authors declare no conflicts of interest in this work.
Acknowledgments
We extend our heartfelt gratitude to neuroimaging experts Yan Hou and Huan Zhou for their invaluable expertise and contributions to this study. Their insights and assistance were instrumental in the advancement of our research.
Additional information
Funding
References
- Wardlaw JM, Smith EE, Biessels GJ, et al. Neuroimaging standards for research into small vessel disease and its contribution to ageing and neurodegeneration. Lancet Neurol. 2013;12(8):822–838. doi:10.1016/S1474-4422(13)70124-8
- Duering M, Biessels GJ, Brodtmann A, et al. Neuroimaging standards for research into small vessel disease-advances since 2013. Lancet Neurol. 2023;22(7):602–618. doi:10.1016/S1474-4422(23)00131-X
- Mestre H, Kostrikov S, Mehta RI, Nedergaard M. Perivascular spaces, glymphatic dysfunction, and small vessel disease. Clin Sci. 2017;131(17):2257–2274. doi:10.1042/CS20160381
- Raposo N, Viswanathan A. MRI-visible enlarged perivascular spaces: beyond microbleeds to predict intracerebral hemorrhage. Neurology. 2020;95(16):709–710. doi:10.1212/WNL.0000000000010790
- Delgado-Alvarado M, Gutiérrez-González A, Marques-Llano S, Riancho J. Parkinsonism associated with striatal enlarged perivascular spaces. Neurology. 2022;98(21):892–893. doi:10.1212/WNL.0000000000200547
- Lin F, Yang B, Chen Y, Zhao W, Li B, Jia W. Enlarged perivascular spaces are linked to freezing of gait in Parkinson’s disease. Front Neurol. 2022;13:985294. doi:10.3389/fneur.2022.985294
- Lynch M, Pham W, Sinclair B, O’Brien TJ, Law M, Vivash L. Perivascular spaces as a potential biomarker of Alzheimer’s disease. Front Neurosci. 2022;16:1021131. doi:10.3389/fnins.2022.1021131
- Ramaswamy S, Khasiyev F, Gutierrez J. Brain enlarged perivascular spaces as imaging biomarkers of cerebrovascular disease: a clinical narrative review. J Am Heart Assoc. 2022;11(24):e026601. doi:10.1161/JAHA.122.026601
- Wang ML, Sun Z, Li WB, et al. Enlarged perivascular spaces and white matter hyperintensities in patients with frontotemporal lobar degeneration syndromes. Front Aging Neurosci. 2022;14:923193. doi:10.3389/fnagi.2022.923193
- Hicks AJ, Sinclair B, Shultz SR, et al. Associations of enlarged perivascular spaces with brain lesions, brain age, and clinical outcomes in chronic traumatic brain injury. Neurology. 2023;101(1):e63–e73. doi:10.1212/WNL.0000000000207370
- Wardlaw JM, Benveniste H, Nedergaard M, et al. Perivascular spaces in the brain: anatomy, physiology and pathology. Nat Rev Neurol. 2020;16(3):137–153. doi:10.1038/s41582-020-0312-z
- Bennette C, Vickers A. Against quantiles: categorization of continuous variables in epidemiologic research, and its discontents. BMC Med Res Methodol. 2012;12:21. doi:10.1186/1471-2288-12-21
- Barrio I, Arostegui I, Rodríguez-álvarez M-X, Quintana J-M. A new approach to categorising continuous variables in prediction models: proposal and validation. Stat Methods Med Res. 2017;26(6):2586–2602. doi:10.1177/0962280215601873
- Li T, Huang Y, Cai W, et al. Age-related cerebral small vessel disease and inflammaging. Cell Death Dis. 2020;11(10):932. doi:10.1038/s41419-020-03137-x
- Markus HS, Erik de Leeuw F. Cerebral small vessel disease: recent advances and future directions. Int J Stroke. 2023;18(1). doi:10.1177/17474930221144911
- Klarenbeek P, van Oostenbrugge RJ, Lodder J, Rouhl RPW, Knottnerus ILH, Staals J. Higher ambulatory blood pressure relates to enlarged Virchow-Robin spaces in first-ever lacunar stroke patients. J Neurol. 2013;260(1):115–121. doi:10.1007/s00415-012-6598-z
- Gao Y, Deng WP, Sun JL, et al. The association of nocturnal blood pressure patterns and other influencing factors with lacunes and enlarged perivascular spaces in hypertensive patients. Front Neurol. 2022;2022:13.
- Di Fusco SA, Arca M, Scicchitano P, et al. Lipoprotein(a): a risk factor for atherosclerosis and an emerging therapeutic target. Heart. 2022;109(1):18–25. doi:10.1136/heartjnl-2021-320708
- Lampsas S, Xenou M, Oikonomou E, et al. Lipoprotein(a) in atherosclerotic diseases: from pathophysiology to diagnosis and treatment. Molecules. 2023;28(3). doi:10.3390/molecules28030969
- Yang SN, Zhang XY, Yuan JL, Yin JM, Hu WL. Serum uric acid is independently associated with enlarged perivascular spaces. Sci Rep. 2017;7:1.
- Deveci B, Gazi E. Relation between globulin, fibrinogen, and albumin with the presence and severity of coronary artery disease. Angiology. 2021;72(2):174–180. doi:10.1177/0003319720959985
- Chen L, Xu M, Huang Q, Liu Y, Ren W. Clinical significance of albumin to globulin ratio among patients with stroke-associated pneumonia. Front Nutrit. 2022;9:970573. doi:10.3389/fnut.2022.970573