
Abstract
Background
Myocardial infarction (MI) is a chronic cardiovascular disease. This study aims to discern potentially angiogenesis- and epithelial mesenchymal transition (EMT)-related genes as biomarkers for MI diagnosis through bioinformatics.
Methods
All datasets and angiogenesis- and EMT-related genes were collected from the public database. The differentially expressed genes (DEGs) of MI and MI-related genes were acquired. DEGs, MI-related genes, and angiogenesis- and EMT-related genes were intersected to obtain hub genes. Functional enrichment, immune microenvironment, and transcription factors (TFs)-hub genes regulatory network analysis were performed. The diagnostic markers and models were developed and validated. Drug prediction and molecular docking were performed. Finally, diagnostic markers expressions were validated using RT-qPCR.
Results
A total of 224 angiogenesis- and EMT-related genes, 2,897 DEGs, 1,217 MI-related genes, and 9 hub genes were acquired. The immune infiltration levels of plasma cells, T cells CD4 memory activated, monocytes, macrophages M0, mast cells resting, and neutrophils were higher in patients with MI. LRPAP1, COLGALT1, QSOX1, THBD, VCAN, PLOD1, and PLAUR as the diagnostic markers were identified and used to construct diagnostic models, which can distinguish MI from controls well. Then, 9 drugs were screened, and the binding energies ranged from −7.08 to −5.21 kcal/mol. RT-qPCR results showed that the expression of LRPAP1, PLAUR, and PLOD1 was significantly increased in the MI group.
Conclusion
The 7 diagnostic markers may play potential roles in MI and could contribute to improved future diagnostics.
Introduction
Myocardial infarction (MI) represents the most severe form of coronary artery disease, characterized by ischemic necrosis of the myocardium due to the sudden interruption of blood flow.Citation1,Citation2 MI remains a predominant global cause of mortality and disability, posing a significant threat to human health.Citation3 In China, the mortality rate of MI in 2020 was 78.65/100,000 in rural areas and 60.29/100,000 in urban areas.Citation4 According to the atherosclerosis risk in communities’ study, the annual incidence of MI is approximately 805,000.Citation5 The gold standard of MI diagnosis is elevated serum cardiac troponin.Citation6 Additionally, lactate dehydrogenase, creatine kinase (CK)-MB, myoglobin, and myosin-binding protein C can be considered biomarkers of MI.Citation6 The prognosis of MI patients has significantly improved with advancements in percutaneous coronary intervention and antithrombotic therapy.Citation7 However, the incidence of MI has not declined but increased in older individuals.Citation8 Timely and effective revascularization of patients with MI reduces mortality and improves prognosis.Citation9
MI induces substantial damage to coronary microcirculation, resulting in vascular disintegration and capillary thinning within the infarcted area.Citation10 Cardiac repair consists of two phases: an inflammatory phase and a repair phase. Starting with sterile inflammation and immune cell infiltration, it is followed by inflammatory regression, fibroblast proliferation, scar formation, and angiogenic response.Citation11 These responses coordinate to achieve efficient microvascular perfusion in cardiac remodeling, ensuring subsequent repair and function recovery.Citation12 Angiogenesis is mainly accomplished by endothelial cells (ECs).Citation13 Additionally, cardiomyocytes, macrophages, fibroblasts, and monocytes are also involved in the process of angiogenesis.Citation13 In mice after MI, the capillary network was markedly expanded on day 7.Citation14 Furthermore, epicardium participates in cardiac remodeling and angiogenesis after MI through epithelial mesenchymal transition (EMT), converting endocardial cells to fibroblasts.Citation15,Citation16 In the heart failure model, cardiomyocytes exhibited an EMT-like regenerative response that promotes cardiac regeneration.Citation17 Single-cell RNA sequencing demonstrated that ECs transiently displayed a mesenchymal gene expression state from days 3 to 7, returning to baseline levels at day 14.Citation18 Although both EMT and angiogenesis play important roles in MI, the pathophysiology among MI, EMT, and angiogenesis remains unknown.
In this study, the differentially expressed genes (DEGs), angiogenesis- and EMT-related genes, and MI-related genes were acquired, followed by overlapping to acquire hub genes. Then, functional enrichment, immune infiltrated analysis, and regulatory network construction were performed. Additionally, the diagnostic markers and models were obtained, and the performance of models was evaluated. Furthermore, potential target drugs were predicted. Finally, the blood samples were collected to validate the expression of diagnostic markers. This work may provide new directions in the diagnosis and treatment of MI.
Materials and Methods
Data Collection and Processing
MI is defined as the death of myocardial cells due to prolonged ischemia.Citation19 In clinical settings, elevated levels of cardiac troponin or CK-MB are diagnostic indicators of MI.Citation20 The keywords “myocardial infarction” and “homo sapiens” were searched in the Gene Expression Omnibus (GEO) database (https://www.ncbi.nlm.nih.gov/GEO/), and four datasets, GSE59867, GSE62646, GSE123342, and GSE28454, were included in this study. Among these, GSE59867 (46 controls and 111 MI samples) and GSE62646 (14 controls and 28 MI samples) datasets were utilized as the training set, while GSE123342 (22 controls and 67 MI samples) and GSE28454 (76 MI samples) datasets were employed as the validation set. The samples in the training set were peripheral blood mononuclear cells (PBMC), whereas the GSE123342 and GSE28454 datasets comprised whole blood samples and monocytes, respectively. Then, the GSE59867 and GSE62646 datasets were merged, and the batch effects were removed using the “combat” function from the “sva” package in R software (version 3.5.3). Additionally, angiogenesis- and EMT-related genes were obtained from the MSigDB (https://www.gsea-msigdb.org/gsea/msigdb/).
DEGs Analysis
The “limma” package in R was used to acquire the DEGs between controls and MI patients. The DEGs with false discovery rate (FDR) <0.01 were considered statistically significant. The volcano plot and heatmap were generated to visualize the results through the “ggplot” and “pheatmap” packages in R, respectively.
Weighted Gene Co-Expression Network Analysis (WGCNA)
To construct a scale-free gene co-expression network, the top 25% of genes were selected for subsequent analysis using the “WGCNA” package in R. First, the “hclust” function was employed to cluster samples to remove abnormal samples. Subsequently, the “pickSoftThreshold” function was utilized to select an optimal soft thresholding power to construct a scale-free topology. The degree was set as 0.90. Then, the adjacency matrix was generated based on the eigengene and followed by its transformation into a topological overlap matrix (TOM) and its corresponding 1-TOM. Genes were clustered according to their expression patterns. Next, modules were divided using the default “cutreeDynamic” function. The modules with a dissimilarity degree of less than 0.25 were combined. Subsequently, the module eigengene (ME) was calculated using the “moduleEigengenes” function, and the correlation between modules and MI was analyzed using the Pearson analysis. Finally, modules related to MI were identified as hub modules, and MI-related genes were selected based on the following criteria: |gene significance (GS)| >0.4 and |module membership (MM)| >0.6.
Identification of Hub Genes and Functional Enrichment Analysis
The DEGs in patients with MI, MI-related genes in WGCNA analysis, and angiogenesis- and EMT-related genes were intersected to obtain the intersection genes. Subsequently, Gene Ontology (GO) and Kyoto Encyclopedia of Genes and Genomes (KEGG) enrichment analysis were conducted for intersection genes using the David database (https://david.ncifcrf.gov/).Citation21,Citation22 The terms with p-value <0.05 were considered statistically significant. The distribution of intersection genes on chromosomes was explored using the “Rcircos” package in R. Following this, the regulatory relationships among intersection genes were explored using the STRING database (https://cn.string-db.org/), and the hub genes were identified based on their expression levels in both training sets and the GSE123342 dataset.Citation23
Immune Microenvironment Analysis
The immune infiltration levels of 22 immune cells were calculated based on their gene expression matrix using the “CIBERSORT” algorithm.Citation24 The difference in 22 immune cells between controls and MI patients was assessed using the Wilcoxon test, and the results were visualized through the bar plot. Then, the correlation between hub genes and differential immune cells was investigated through the Pearson analysis.
Construction of Transcription Factors (TFs)-Hub Genes Regulatory Network
The TFs associated with hub genes were predicted using the Cistrome DataBase (Cistrome DB, http://genemania.org).Citation25,Citation26 The top 20 TFs were selected based on their regulatory potential scores. Then, the MI-related TFs were determined after intersecting between the top 20 TFs and DEGs. Finally, the TFs-hub genes network was constructed using Cytoscape software.
Construction of Diagnostic Models Using Machine Learning
Firstly, the least absolute shrinkage and selection operator (LASSO) regression analysis was used to select feature genes from hub genes through the “glmnet” package in R in the training set. Secondly, feature genes were ranked according to their mean decrease accuracy using the “randomForest” package in R. Using the random forest (RF) algorithm and 10-fold cross-validation, the optimal number of genes was determined. Finally, RF and support vector machine (SVM) classification models were created using the “randomForest” and “e1071” packages in R, respectively. The diagnostic ability of two classification models was evaluated in both the training set and the GSE123342 dataset using the receiver operating characteristic (ROC) curve generated via the “pROC” package in R. The area under the curve (AUC) value was used to quantify the performance of models.
Drug Prediction and Molecular Docking
The DGIdb database (https://dgidb.org/) was utilized to select candidate drugs associated with genes in diagnostic models. The binding activity was calculated through molecular docking. The 3D structures of target proteins were obtained from the RCSB PDB (http://www.rcsb.org/pdb/home/home.do), while 3D structures of drugs were downloaded from the PubChem (https://pubchem.ncbi.nlm.nih.gov/).Citation27,Citation28 Hydrogenation and other pre-processing of proteins and drugs were performed using AutoDockTools, followed by molecular docking.Citation29 In this study, the binding energies with <-5.0 kJ/mol indicated strong binding activity.Citation30 The molecular docking results were visualized by the PyMol software.Citation31
Real-Time qPCR (RT-qPCR) Analysis
A total of 11 blood samples were collected from 6 patients with stable coronary artery disease (CAD) served as controls and 5 patients with MI for RT-qPCR. The clinical information and disease history of all samples are displayed in Supplementary Table 1. Total RNA was extracted using HiPure Liquid RNA/miRNA Kit (Magen) following the manufacturer’s instructions. Then, FastQuant cDNA First Strand cDNA Synthesis Kit (Tiangen) was used to perform mRNA reverse transcription. SuperReal PreMix Plus (SYBB Green, Tiangen) was utilized for qRT-PCR according to the manufacturer’s instructions. Finally, the results were measured using the ABI 7300 real-time PCR instrument (BIOER), and the relative mRNA expression levels were calculated by the 2−ΔΔCt method with GAPDH and β-actin as the internal references. The synthesis of primers was completed by Biomed, and the sequences are shown in Supplementary Table 2.
Results
Data Processing and GSEA Analysis
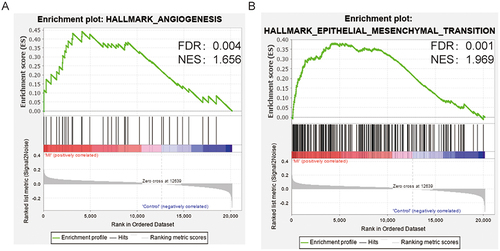
After removing the batch effect, 60 controls and 139 MI samples in the training sets were obtained. A total of 24 angiogenesis-related genes, 188 EMT-related genes, and 12 common genes were acquired. To assess expression levels of angiogenesis- and EMT-related genes in MI, the gene set enrichment analysis (GSEA) was conducted using GSEA software. The Results showed that angiogenesis- and EMT-related genes were significantly enriched in patients with MI ( and ).
Figure 1 GSEA analysis. GSEA analysis showed that angiogenesis- (A) and EMT-related genes (B) were up-regulated in MI samples.
Identification of DEGs and MI-Related Genes
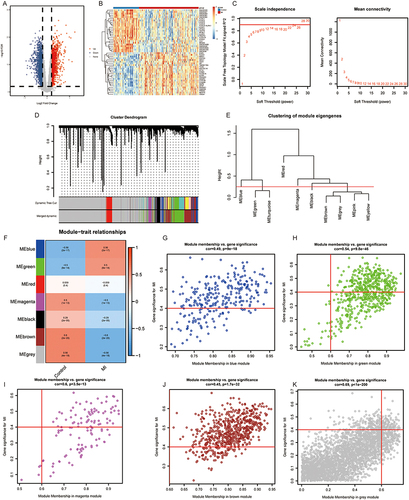
Compared with controls, a total of 2,897 DEGs, including 1,279 up-regulated and 1,618 down-regulated, were identified in MI patients ( and ). WGCNA was carried out to identify the MI-related genes in the training sets. The power β = 22 was used to construct the scale-free network (). A total of 7 modules were clustered with gene count in each module ≥50 and divergence ≥0.25 ( and ). Six modules were significantly associated with MI, and modules with |correlation| ≥0.5 were used for further analysis, including blue, green, magenta, brown, and grey models (). With |GS| >0.4 and |MM| >0.6, a total of 1,217 MI-related genes were obtained: 207 genes were identified in the blue module, 295 in the green module, 63 in the magenta module, 542 in the brown module, and 110 in the grey module. ().
Figure 2 WGCNA. (A and B) Volcano plot (A) and heatmap (B) of DEGs between MI and control samples. (C) Scale Independence and mean connectivity analysis. (D) A cluster dendrogram of 7 modules. (E) Clustering of module eigengene. (F) The module trait relationship. (G–K) Scatter plots of gene significance for MI vs the module membership in the blue (G), green (H), magenta (I), brown (J), and grey (K) modules.
Identification of Hub Genes and Function Analysis
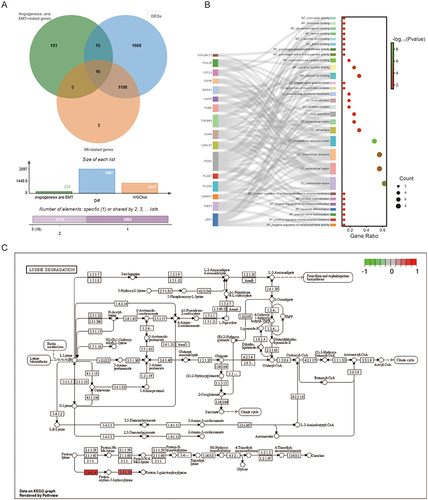
The 2,897 DEGs, 36 angiogenesis-related genes, 200 EMT-related genes, and 1,217 MI-related genes were intersected to obtain 16 intersection genes, including LRPAP1, THBD, TIMP1, VCAN, CAPG, FSTL3, ITGB1, LGALS1, LRP1, PLAUR, PLOD1, PLOD3, QSOX1, TGFBI, TGFBR3, and COLGALT1 (). GO analysis revealed that these 16 intersection genes were involved in various processes, including negative regulation of metallopeptidase activity, positive regulation of beta-amyloid clearance, peptidyl-lysine hydroxylation, myoblast differentiation, positive regulation of neuroblast proliferation, receptor internalization, and positive regulation of protein localization to the plasma membrane (). KEGG analysis indicated that PLOD3, PLOD1, and COLGALT1 were mainly involved in the lysine degradation and other types of O-glycan biosynthesis pathways, and the lysine degradation was displayed in .
Figure 3 Identification of intersection genes. (A) Venn analysis of intersection genes among DEGs, angiogenesis- and EMT-related genes, and MI-related genes. (B) GO analysis of intersection genes. (C) Lysine degradation pathway.
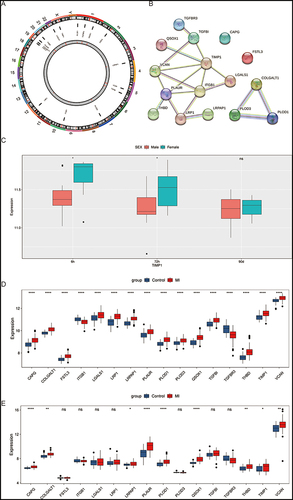
The locations of 16 intersection genes on chromosomes are displayed in . PPI results showed that the degree of TIMP1 was the highest, interacting with 6 genes, among 19 interacting pairs (). There are 4 gene pairs with interaction scores above 0.95 in all interaction relationships, including LRP1 and LRPAP1, COLGALT1 and PLOD3, COLGALT1 and PLOD1, and PLOD1 and PLOD3 (). Considering that TIMP1 was located on the X chromosome and has the highest degree in the PPI network, the relationship between TIMP1 and gender in MI was explored in the GSE28454 dataset, which included monocyte samples from patients with MI at 6 h, 72 h, and 90 days. We found that the expression of TIMP1 was significantly increased in females at 6h and 72 h compared to male patients (). Furthermore, the expression levels of 16 intersection genes in the training sets and GSE123342 dataset were displayed in . The expression of CAPG, COLGALT1, LRPAP1, PLAUR, PLOD1, QSOX1, THBD, TIMP1, and VCAN was significantly up-regulated in MI samples compared with the control group in both two datasets. Hence, the above 9 genes were identified as the hub genes.
Figure 4 Identification of hub genes. (A) The locations of intersection genes on the chromosome. (B) The PPI network of intersection genes. (C) The expression levels of TIMP1 gene at three time points in the GSE28454 dataset between MI and control samples. (D and E) The expression of intersection gene in the training sets (D) and GSE123342 dataset (E) between MI and control samples. *p <0.05; **p <0.01; ****p <0.0001; ns, no significance.
Correlation Analysis Between Immune Cells and Hub Genes
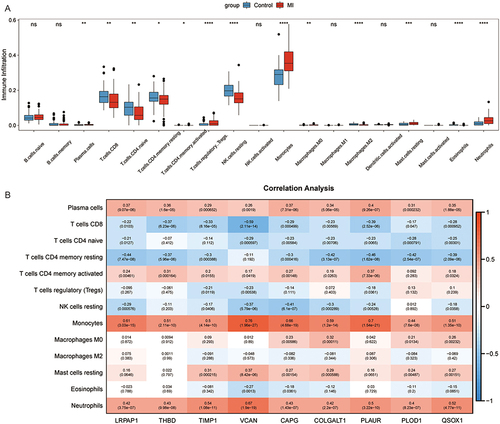
The results showed that patients with MI had higher immune infiltration levels of plasma cells, T cells CD4 memory activated, monocytes, macrophages M0, mast cells resting, and neutrophils, while T cells CD8, T cells CD4 native, T cells CD4 memory resting, NK cells resting, T cells regulatory (Tregs), macrophages M2, and eosinophil were enriched in the control group (). Next, the correlation between 13 immune cells and 9 hub genes was analyzed (). Plasma cells, monocytes, and neutrophils were significantly correlated with all hub genes. VCAN showed the highest positive correlation with monocytes at 0.76, followed by PLAUR and monocytes at 0.7. In addition, the highest negative correlation was observed between T cells CD8 and VCAN, which was −0.59.
Figure 5 Microenvironment analysis. (A) The abundance of each immune infiltration cell in MI and control samples. (B) Heatmap of the correlation between immune cells and hub genes. *p <0.05; **p <0.01; ***p <0.001; ****p <0.0001; ns, no significance.
Construction of TFs-Hub Genes Regulated Network
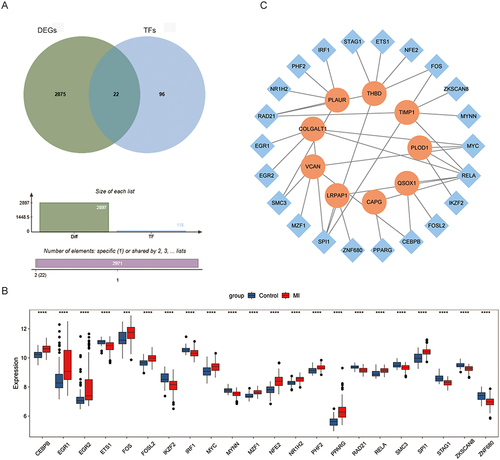
A total of 118 TFs associated with 9 hub genes were obtained, and then they were intersected with the DEGs to acquire 22 MI-related TFs (). The expression of 22 MI-related TFs was exhibited in . Then, the TFs-hub genes regulated network was constructed (). Among 37 regulatory relationship pairs, THBD and TIMP1 were regulated by 6 different TFs, while RELA TF regulated 6 hub genes.
Figure 6 Construction of TFs-hub genes network. (A) The intersection between the DEGs and TFs. (B) The expression levels of MI-related TFs between MI and control groups. (C) TFs-hub genes network. Orange and blue represent hub genes and TFs, respectively. ****p <0.0001.
Construction of Diagnostic Model for Predicting MI
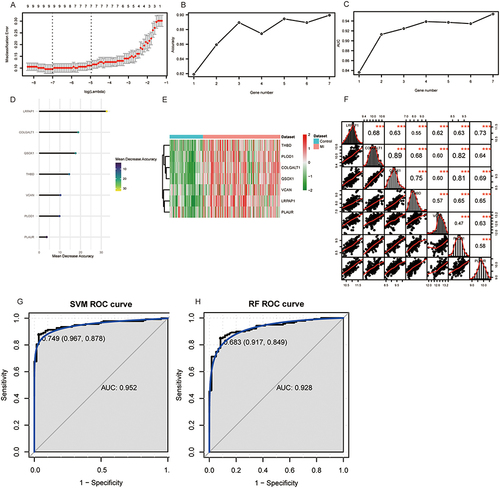
A total of 7 diagnostic genes were acquired in the training set using LASSO regression analysis (). The results of mean decreasing precision and 10-fold cross-validation showed that the highest accuracy was achieved when the number of genes was seven (), including LRPAP1, COLGALT1, QSOX1, THBD, VCAN, PLOD1, and PLAUR. The heatmaps were used to visualize the expression levels of these genes (). The correlation results indicated that seven diagnostic genes were significantly correlated with each other, with COLGALT1 and QSOX1 having the strongest correlation of 0.89 (). Then, the SVM and RF classification models were constructed based on 7 diagnostic genes. The AUC of SVM and RF were 0.952 and 0.928, respectively in the training set ( and ). In the SVM model, sensitivity and specificity were 87.8% and 96.7%, respectively, while the RF model showed 84.9% and 91.7% for sensitivity and specificity. In the GSE123342 dataset, these two classification models also distinguished patients with MI from the control group (Supplementary Figure 1).
Figure 7 Construction of diagnostic model. (A) The optimal lambda value was acquired by LASSO regression analysis. (B) Accuracy values at different gene numbers. (C) The AUC values at different gene numbers. (D) The mean decrease accuracy of 7 diagnostic genes. (E) Heatmap of 7 diagnostic genes in training set. (F) The correlation analysis among 7 diagnostic genes. (G and H) ROC analysis of SVM (G) and RF (H) diagnostic models in training datasets. ***p <0.001.
Drugs Predicting and Molecular Docking
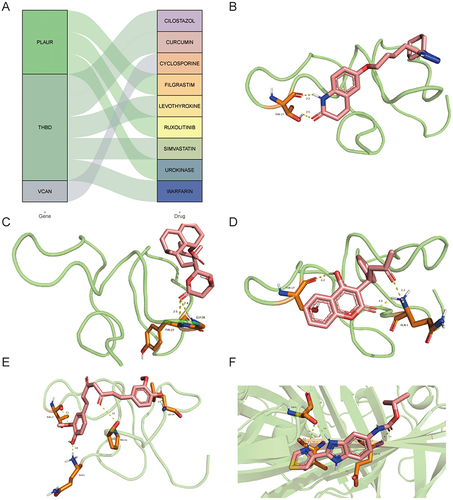
A total of 9 drugs for seven diagnostic genes were obtained from the DGIdb database (). Among these drugs, 5 drugs may target THBD gene, 3 drugs may target PLAUR gene, and 1 drug may target VCAN gene. However, other genes were not matched to the drug. The lowest binding energy of THBD and cilostazol was −7.08 kcal/mol by binding THR-17 amino acid residues with 2 hydrogen bonds (). The binding energy of THBD and simvastatin was −6.01 kcal/mol by binding TYR-27 and GLY-26 amino acid residues with 2 hydrogen bonds (). The binding energy of THBD and warfarin was −5.44 kcal/mol by binding THR-17 and GLN-1 amino acid residues with 3 hydrogen bonds (). The binding energy of THBD and curcumins was −6.35 kcal/mol by binding THR-17, GLN-1, PRO-24, and LEU-29 amino acid residues with 4 hydrogen bonds (). The binding energy of PLAUR and urokinase was −5.21 kcal/mol by binding THR-8, VAL-41, and GLU-39 amino acid residues with 5 hydrogen bonds ().
Figure 8 Drugs predicting and molecular docking. (A) Sankey diagram of predicted drugs. (B–E) THBD and cilostazol (B), simvastatin (C), warfarin (D), and curcumins (E) molecular docking, respectively. (F) PLAUR and urokinase molecular docking.
RT-qPCR Validation
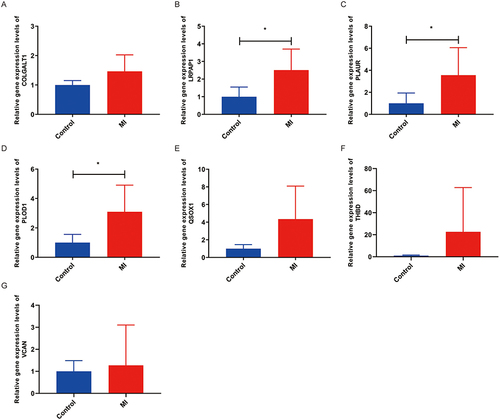
The expression levels of 7 diagnostic genes were validated by RT-qPCR (). Compared with the control group, the expression of all diagnostic genes was increased in the MI group. Remarkably, the expression of LRPAP1, PLAUR, and PLOD1 was significantly increased in the MI group ().
Figure 9 RT-qPCR analysis. (A–G) The expression levels of COLGALT1 (A), LRPAP1 (B), PLAUR (C), PLOD1 (D), QSOX1 (E), THBD (F), and VCAN (G). *P <0.05.
Discussion
MI is pathologically characterized by the death of myocardial cells resulting from prolonged ischemia, which is related to high mortality.Citation20,Citation32 Angiogenesis and EMT participate in the repair process after MI by rebuilding microvascular circulation.Citation33,Citation34 However, the molecular mechanism between MI, angiogenesis, and EMT is not clear. Chen et al reported that PI3K/Akt/mTOR, Notch, Wnt/β-catenin, Hippo, Sonic Hedgehog, and JAK/STAT signaling pathways are key targets for post-MI angiogenesis regulation.Citation35 HIF-1α, eNOS, VEGF-A, and FOXO, as the downstream effectors for PI3K/Akt/mTOR signaling pathway, participated in generation and maintenance of blood vessels in post-MI.Citation35 In MI model rats, the overexpression of notch intracellular domain, which serves as a core component of the Notch signaling pathway, promoted angiogenesis.Citation36 In addition, activated Notch enhanced PI3K/Akt signaling in adult myocardium after MI.Citation37 In MI, the Wnt/β-catenin pathway is activated in endothelial cells, leading to their mesenchymal transformation and the generation of bipotential mesenchymal cells, which may be involved in angiogenesis.Citation38 In a mouse model of ischemic heart failure post-MI, knock out Hippo pathway component Salvador induced angiogenesis.Citation39 Elevated expression of Sonic hedgehog during myocardial ischemia activates endothelial progenitor cells and induces angiogenesis and expression of angiogenic factors.Citation40 In mice with cardiomyocyte-specific deletion of STAT3, the reduced myocardial capillary density was observed at four months of age.Citation41 Additionally, these mice showed increased susceptibility to myocardial infarction and larger infarct sizes.Citation41 Hence, establishing a multi-gene risk model for MI based on angiogenesis and EMT can facilitate timely and targeted therapeutic interventions in clinical practice for MI patients.
In this study, we aimed to explore angiogenesis- and EMT-related diagnostic biomarkers in patients with MI through bioinformatics analysis. A total of 9 hub genes were identified and then the diagnostic models consisting of 7 hub genes were constructed and validated, which can distinguish patients with MI from control group.
COLGACT1 is a member of the collagen beta (1-O) galactosyltransferase family, and their variants might be responsible for cerebral small vessel disease.Citation42 Gelsolin-like actin-capping protein (CAPG), belonging to the gelsolin superfamily, plays a role in cell migration.Citation43 In the post-ischemic heart, decellularized extracellular matrix (dECM) hydrogels therapy could promote cardiomyocyte vascularization through down-regulating CAPG expression.Citation44 LRPAP1 is a molecular chaperone protein that regulates low-density lipoprotein receptor (LDLR) function.Citation45 Yu et al reported that LDLR variants could reduce the risk of premature MI in Han Chinese.Citation46 Additionally, MI showed a linear correlation with the number of “cholesterol-years”, as an indicator of cumulative exposure to low-density lipoprotein cholesterol.Citation47 The urokinase plasminogen activator receptor (PLAUR) is a member of the plasminogen activation system and serves as a valuable diagnostic indicator for atherosclerosis, which is the cause of MI.Citation48,Citation49 Procollagen-lysine, 2-oxoglutarate 5-dioxygenase 1 (PLOD1) encodes a lysyl hydroxylase 1 (LH1) and is vital for maintaining stability in collagen fibrils by supporting intermolecular cross-links.Citation50 In the abdominal aortic aneurysm model, knock-out PLOD1 exacerbated the inflammatory response and vascular smooth muscle cell apoptosis.Citation51 Quiescin sulfhydryl oxidase 1 (QSOX1), as a sulfhydry1 oxidase, plays a role in cellular growth and extracellular matrix remodeling and could act as a new independent marker of left ventricular dysfunction after MI.Citation52 Thrombomodulin (THBD) acts as an anticoagulant transmembrane factor, reducing the formation of thrombin.Citation53 Wenzel et al showed that endogenous THBD played a protective role in the ischemic brain through mediating angiogenesis.Citation54 In heart failure, Xin-shu-bao, a cardioprotective drug, alleviated heart failure through THBD/ARRB1/FGF1/STIM1 signaling.Citation55 Tissue inhibitor of metalloproteinases 1 (TIMP1) had been related to maintain the homeostatic balance of the myocardial extracellular matrix (ECM).Citation56 The expression of TIMP1 was increased after MI in pigs in the treatment of extracorporeal cardiac shock, along with up-regulation of angiogenesis and angiogenic factor.Citation57 Versican (VCAN) is a chondroitin sulfate proteoglycan, constituting a component of the ECM originating from cardiac fibroblasts.Citation58 In adult mice after MI, the increasing of VCAN facilitated cardiomyocyte proliferation and cardiac recovery.Citation59 In our study, the 9 hub genes (CAPG, COLGALT1, LRPAP1, PLAUR, PLOD1, QSOX1, THBD, TIMP1, and VCAN) were obtained, and their expression was increased in patients with MI. Except for CAPG and TIMP1, diagnostic model consisting of other genes could distinguish MIs from controls well. Hence, we speculated that these genes may play a potential role in cardiac recovery after MI and may be candidate biomarkers.
After MI, the innate and adaptive immune responses were activated, and T and B cells were recruited.Citation60 B cells have an impact on inflammation and repair following MI.Citation61 Kyaw et al reported that dying cardiomyocytes could release a signal to activate B cells, leading to an increase in plasma cells, which secreted IgG and accelerated recurrent MI.Citation61 Activated CD4 T cells enhanced wound healing and heart recovering in mice after MI.Citation62 Monocytes, macrophages, and neutrophils play key roles in regulating myocardial healing.Citation62 Monocytes are precursor cells to macrophages.Citation63 In the early phase of MI, the number of cardiac monocyte and macrophage cells with a proinflammatory phenotype increases rapidly, followed by a shift to a reparative phenotype involved in the deposition of scar tissue.Citation63 Neutrophils were recruited within hours after the onset of MI, leading to acute tissue injury, whereas, during the process of infarct healing, they promoted cardiac recovery by influencing macrophage polarization.Citation64 Consistent with previous studies, our data suggested that the immune infiltration levels of plasma cells, T cells CD4 memory activated, monocytes, macrophages M0, mast cells resting, and neutrophils were higher in patients with MI than controls, indicating that these cells may exert a potential role in cardiac repair after MI.
Urokinase is a widely used intravenous thrombolytic in clinical practice.Citation65 Administering intravenous urokinase for coronary artery thrombolysis in patients with MI contributes to reducing infarct size.Citation66 Triple antiplatelet therapy with cilostazol demonstrates superior early clinical outcomes compared to P2Y12 inhibitor dual antiplatelet therapy, recommended in guidelines for treating ischemic events in MI.Citation67 Curcumin, derived from curcuma longa, is a phenolic compound.Citation68 Curcumin could prompt angiogenesis through enhancing endothelial progenitor cell function in hindlimb ischemia mice with diabetes.Citation69 Rahnavard et al reported cardioprotective effect of curcumin in rats after MI.Citation70 Simvastatin improves ventricular remodeling through the TGF β1 signaling pathway in post-MI rats.Citation71 Long-term therapy with warfarin can decrease the risk of death and reinfarction followed with MI.Citation72 In our study, a total of 9 drugs were acquired for THBD, PLAUR, and VCAN genes, and molecular docking results showed that THBD has low binding energies with cilostazol, curcumin, simvastatin, and warfarin. The binding energy between PLAUR and urokinase was −5.21 kcal/mol. All these results indicated that these genes may be potentially therapeutic targets in MI.
However, some limitations in this study should be noticed. First, all data were downloaded from public databases, lacking larger-sample datasets to validate. Second, experiments in vitro and in vivo need to be performed to validate these results in this study. Finally, the small size of MI samples was collected for RT-qPCR of diagnostic genes, which may affect the accuracy of the results.
Conclusion
In summary, we obtained 7 diagnostic biomarkers (COLGALT1, LRPAP1, PLAUR, PLOD1, QSOX1, THBD, and VCAN) in patients with MI based on the angiogenesis- and EMT-related genes using bioinformatic analysis. Microenvironment analysis showed that these genes were correlated with the immune response. Additionally, diagnostic models were constructed and exhibited good diagnostic performance. Finally, therapeutic drugs were predicted, indicated that these genes may be potentially therapeutic targets in MI. Our findings could provide candidate biomarkers and offer potential treatment targets for MI.
Abbreviations
MI, Myocardial infarction; EMT, epithelial mesenchymal transition; DEGs, differentially expressed genes; TFs, transcription factors; ECs, endothelial cells; GEO, Gene Expression Omnibus; PBMC, peripheral blood mononuclear cells; FDR, false discovery rate; TOM, topological overlap matrix; ME, module eigengene; GS, gene significance; MM, module membership; GO, Gene Ontology; KEGG, Kyoto Encyclopedia of Genes and Genomes; RF, random forest; SVM, support vector machine; ROC, receiver operating characteristic; AUC, area under the curve; CAD, coronary artery disease; GSEA, gene set enrichment analysis; CAPG, actin-capping protein; dECM, decellularized extracellular matrix; LDLR, low-density lipoprotein receptor; PLAUR, plasminogen activator receptor; PLOD1, Procollagen-lysine, 2-oxoglutarate 5-dioxygenase 1; LH1, lysyl hydroxylase 1; QSOX1, Quiescin sulfhydryl oxidase 1; THBD, Thrombomodulin; TIMP1, Tissue inhibitor of metalloproteinases 1; ECM, extracellular matrix; VCAN, Versican.
Ethics Approval and Consent to Participate
This study was approved by the ethics committee of The Second Affiliated Hospital of Shandong First Medical University (2023-H-172) and was carried out in compliance with the principles of the Declaration of Helsinki. Each individual signed the informed consent.
Author Contributions
All authors made a significant contribution to the work reported, whether that is in the conception, study design, execution, acquisition of data, analysis, and interpretation, or all these areas; took part in drafting, revising, or critically reviewing the article; gave final approval of the version to be published; have agreed on the journal to which the article has been submitted; and agree to be accountable for all aspects of the work.
Disclosure
The authors declare no competing interests in this work.
Data Sharing Statement
The data in this study are available from the corresponding author upon reasonable request.
Additional information
Funding
References
- Gossage JR. Acute myocardial infarction. Reperfusion strategies. Chest. 1994;106(6):1851–1866. doi:10.1378/chest.106.6.1851
- Reed GW, Rossi JE, Cannon CP. Acute myocardial infarction. Lancet. 2017;389(10065):197–210. doi:10.1016/s0140-6736(16)30677-8
- Ramachandra CJA, Hernandez-Resendiz S, Crespo-Avilan GE, Lin YH, Hausenloy DJ. Mitochondria in acute myocardial infarction and cardioprotection. EBioMedicine. 2020;57:102884. doi:10.1016/j.ebiom.2020.102884
- Liyuan M, Zeng WW, Jing F, Shengshou H. Summary of the China Cardiovascular Health and Disease Report 2022. Chin J Intervent Cardiol. 2023;07:485–508.
- Tsao CW, Aday AW, Almarzooq ZI, et al. Heart Disease and Stroke Statistics-2023 Update: a Report From the American Heart Association. Circulation. 2023;147(8):e93–e621. doi:10.1161/cir.0000000000001123
- Wu Y, Pan N, An Y, Xu M, Tan L, Zhang L. Diagnostic and prognostic biomarkers for myocardial infarction. Front Cardiovas Med. 2020;7:617277. doi:10.3389/fcvm.2020.617277
- Xiang J, Shen J, Zhang L, Tang B. Identification and validation of senescence-related genes in circulating endothelial cells of patients with acute myocardial infarction. Origin Res. 2022;9. doi:10.3389/fcvm.2022.1057985
- Jortveit J, Pripp AH, Langørgen J, Halvorsen S. Incidence, risk factors and outcome of young patients with myocardial infarction. Heart. 2020;106(18):1420–1426. doi:10.1136/heartjnl-2019-316067
- Cohen M, Gensini GF, Maritz F, et al. Prospective evaluation of clinical outcomes after acute ST-elevation myocardial infarction in patients who are ineligible for reperfusion therapy: preliminary results from the TETAMI registry and randomized trial. Circulation. 2003;108(16 Suppl 1):Iii14–Iii21. doi:10.1161/01.Cir.0000091832.74006.1c
- Wu X, Reboll MR, Korf-Klingebiel M, Wollert KC. Angiogenesis after acute myocardial infarction. Cardiovasc Res. 2020;117(5):1257–1273. doi:10.1093/cvr/cvaa287
- Prabhu SD, Frangogiannis NG. The biological basis for cardiac repair after myocardial infarction: from inflammation to fibrosis. Circ res. 2016;119(1):91–112. doi:10.1161/circresaha.116.303577
- Sánchez-Alonso S, Alcaraz-Serna A, Sánchez-Madrid F, Alfranca A. Extracellular vesicle-mediated immune regulation of tissue remodeling and angiogenesis after myocardial infarction. Front Immunol. 2018;9:2799. doi:10.3389/fimmu.2018.02799
- Martín-Bórnez M, Falcón D, Morrugares R, et al. New insights into the reparative angiogenesis after myocardial infarction. Int J Mol Sci. 2023;24(15). doi:10.3390/ijms241512298
- Dubé KN, Thomas TM, Munshaw S, Rohling M, Riley PR, Smart N. Recapitulation of developmental mechanisms to revascularize the ischemic heart. JCI Insight. 2017;2(22). doi:10.1172/jci.insight.96800
- Blom JN, Wang X, Lu X, Kim MY, Wang G, Feng Q. Inhibition of intraflagellar transport protein-88 promotes epithelial-to-mesenchymal transition and reduces cardiac remodeling post-myocardial infarction. Eur J Pharmacol. 2022;933:175287. doi:10.1016/j.ejphar.2022.175287
- Li Y, Lui KO, Zhou B. Reassessing endothelial-to-mesenchymal transition in cardiovascular diseases. Nat Rev Cardiol. 2018;15(8):445–456. doi:10.1038/s41569-018-0023-y
- Aharonov A, Shakked A, Umansky KB, et al. ERBB2 drives YAP activation and EMT-like processes during cardiac regeneration. Nat Cell Biol. 2020;22(11):1346–1356. doi:10.1038/s41556-020-00588-4
- Tombor LS, John D, Glaser SF, et al. Single cell sequencing reveals endothelial plasticity with transient mesenchymal activation after myocardial infarction. Nat Commun. 2021;12(1):681. doi:10.1038/s41467-021-20905-1
- DeFilippis AP, Chapman AR, Mills NL, et al. Assessment and treatment of patients with type 2 myocardial infarction and acute nonischemic myocardial injury. Circulation. 2019;140(20):1661–1678. doi:10.1161/circulationaha.119.040631
- Thygesen K, Alpert JS, White HD. Universal definition of myocardial infarction. J Am Coll Cardiol. 2007;50(22):2173–2195. doi:10.1016/j.jacc.2007.09.011
- Sherman BT, Hao M, Qiu J, et al. DAVID: a web server for functional enrichment analysis and functional annotation of gene lists (2021 update). Nucleic Acids Res. 2022;50(W1):W216–W221. doi:10.1093/nar/gkac194
- Huang da W, Sherman BT, Lempicki RA. Systematic and integrative analysis of large gene lists using DAVID bioinformatics resources. Nat Protocols. 2009;4(1):44–57. doi:10.1038/nprot.2008.211
- Szklarczyk D, Kirsch R, Koutrouli M, et al. The STRING database in 2023: protein-protein association networks and functional enrichment analyses for any sequenced genome of interest. Nucleic Acids Res. 2023;51(D1):D638–D646. doi:10.1093/nar/gkac1000
- Newman AM, Liu CL, Green MR, et al. Robust enumeration of cell subsets from tissue expression profiles. Nature Methods. 2015;12(5):453–457. doi:10.1038/nmeth.3337
- Mei S, Qin Q, Wu Q, et al. Cistrome Data Browser: a data portal for ChIP-Seq and chromatin accessibility data in human and mouse. Nucleic Acids Res. 2017;45(D1):D658–D662. doi:10.1093/nar/gkw983
- Zheng R, Wan C, Mei S, et al. Cistrome Data Browser: expanded datasets and new tools for gene regulatory analysis. Nucleic Acids Res. 2019;47(D1):D729–D735. doi:10.1093/nar/gky1094
- Burley SK, Bhikadiya C, Bi C, et al. RCSB Protein Data Bank (RCSB.org): delivery of experimentally-determined PDB structures alongside one million computed structure models of proteins from artificial intelligence/machine learning. Nucleic Acids Res. 2023;51(D1):D488–D508. doi:10.1093/nar/gkac1077
- Kim S, Chen J, Cheng T, et al. PubChem 2023 update. Nucleic Acids Res. 2023;51(D1):D1373–D1380. doi:10.1093/nar/gkac956
- El-Hachem N, Haibe-Kains B, Khalil A, Kobeissy FH, Nemer G. AutoDock and AutoDockTools for Protein-Ligand Docking: beta-Site Amyloid Precursor Protein Cleaving Enzyme 1(BACE1) as a Case Study. Methods Mol Biol. 2017;1598:391–403. doi:10.1007/978-1-4939-6952-4_20
- Liu S, Wang R, Lou Y, Liu J. Uncovering the mechanism of the effects of Pien-Tze-Huang on liver cancer using network pharmacology and molecular docking. Evid Based Complement Alternat Med. 2020;2020:4863015. doi:10.1155/2020/4863015
- Baugh EH, Lyskov S, Weitzner BD, Gray JJ. Real-time PyMOL visualization for Rosetta and PyRosetta. PLoS One. 2011;6(8):e21931. doi:10.1371/journal.pone.0021931
- Fan M, Yang K, Wang X, et al. Lactate promotes endothelial-to-mesenchymal transition via Snail1 lactylation after myocardial infarction. Sci Adv. 2023;9(5):eadc9465. doi:10.1126/sciadv.adc9465
- Ríos-Navarro C, Hueso L, Díaz A, et al. Role of antiangiogenic VEGF-A(165)b in angiogenesis and systolic function after reperfused myocardial infarction. Rev esp cardiologia. 2021;74(2):131–139. doi:10.1016/j.rec.2020.03.013
- González-Iglesias A, Nieto MA. Proliferation and EMT trigger heart repair. Nat Cell Biol. 2020;22(11):1291–1292. doi:10.1038/s41556-020-00594-6
- Chen C, Wang J, Liu C, Hu J, Liu L. Pioneering therapies for post-infarction angiogenesis: insight into molecular mechanisms and preclinical studies. Biomed Pharmacothe. 2023;166:115306. doi:10.1016/j.biopha.2023.115306
- Zhou XL, Zhu RR, Liu S, et al. Notch signaling promotes angiogenesis and improves cardiac function after myocardial infarction. J Cell Biochem. 2018;119(8):7105–7112. doi:10.1002/jcb.27032
- Gude NA, Emmanuel G, Wu W, et al. Activation of Notch-mediated protective signaling in the myocardium. Circ Res. 2008;102(9):1025–1035. doi:10.1161/circresaha.107.164749
- Aisagbonhi O, Rai M, Ryzhov S, Atria N, Feoktistov I, Hatzopoulos AK. Experimental myocardial infarction triggers canonical Wnt signaling and endothelial-to-mesenchymal transition. Dis Models Mech. 2011;4(4):469–483. doi:10.1242/dmm.006510
- Leach JP, Heallen T, Zhang M, et al. Hippo pathway deficiency reverses systolic heart failure after infarction. Nature. 2017;550(7675):260–264. doi:10.1038/nature24045
- Zhang Q, Wang L, Wang S, et al. Signaling pathways and targeted therapy for myocardial infarction. Sig Transd Target Ther. 2022;7(1):78. doi:10.1038/s41392-022-00925-z
- Hilfiker-Kleiner D, Hilfiker A, Fuchs M, et al. Signal transducer and activator of transcription 3 is required for myocardial capillary growth, control of interstitial matrix deposition, and heart protection from ischemic injury. Circ Res. 2004;95(2):187–195. doi:10.1161/01.Res.0000134921.50377.61
- Miyatake S, Schneeberger S, Koyama N, et al. Biallelic COLGALT1 variants are associated with cerebral small vessel disease. Ann Neurol. 2018;84(6):843–853. doi:10.1002/ana.25367
- Ma Q, Zhao M, Long B, Li H. Super-enhancer-associated gene CAPG promotes AML progression. Commun Biol. 2023;6(1):622. doi:10.1038/s42003-023-04973-1
- Wang X, Senyo S. Abstract P387: deceasing tissue stiffness improves the efficacy of extracellular matrix-based therapy for myocardial infarction. Circ Res. 2021;129(1):AP387–AP387. doi:10.1161/res.129.suppl_1.P387
- Liu S, Chen T, Chen B, Liu Y, Lu X, Li J. Lrpap1 deficiency leads to myopia through TGF-β-induced apoptosis in zebrafish. Cell Commun Signaling. 2022;20(1):162. doi:10.1186/s12964-022-00970-9
- Yu H, Pu T, Xu M, Gao W. P808Association between genetic variants in PCSK9/APOB/LDLR and premature myocardial infarction in Han Chinese. Eur Heart J. 2018;39(1). doi:10.1093/eurheartj/ehy564.P808
- Dyrbus K, Niedziela J, Banach M, et al. Cholesterol-Years and the risk of the first MI. Eur Heart J. 2023;44(2). doi:10.1093/eurheartj/ehad655.1366
- Liu M, Chen S, Zhang A, Zheng Q, Fu J. PLAUR as a potential biomarker associated with immune infiltration in bladder urothelial carcinoma. J Inflamm Res. 2021;14:4629–4641. doi:10.2147/jir.S326559
- Dai C, Lin Y. Comprehensive analysis of the diagnostic and therapeutic value of the hypoxia-related gene PLAUR in the progression of atherosclerosis. Sci Rep. 2023;13(1):8533. doi:10.1038/s41598-023-35548-z
- Koenig SN, Cavus O, Williams J, et al. New mechanistic insights to PLOD1-mediated human vascular disease. Transl Res. 2022;239:1–17. doi:10.1016/j.trsl.2021.08.002
- Li H, Xu H, Wen H, et al. Lysyl hydroxylase 1 (LH1) deficiency promotes angiotensin II (Ang II)-induced dissecting abdominal aortic aneurysm. Research Paper. Theranostics. 2021;11(19):9587–9604. doi:10.7150/thno.65277
- Vanhaverbeke M, Vausort M, Veltman D, et al. Peripheral Blood RNA Levels of QSOX1 and PLBD1 are new independent predictors of left ventricular dysfunction after acute myocardial infarction. Circ Genomic Precis Med. 2019;12(12):e002656. doi:10.1161/circgen.119.002656
- Lobato RL, White WD, Mathew JP, et al. Thrombomodulin gene variants are associated with increased mortality after coronary artery bypass surgery in replicated analyses. Circulation. 2011;124(11 Suppl):S143–S148. doi:10.1161/circulationaha.110.008334
- Wenzel J, Spyropoulos D, Assmann JC, et al. Endogenous THBD (Thrombomodulin) mediates angiogenesis in the Ischemic Brain-Brief Report. Arteriosclerosis Thrombosis Vasc Biol. 2020;40(12):2837–2844. doi:10.1161/atvbaha.120.315061
- Zhang F, Xu X, Hou J, et al. Cardioprotective efficacy of Xin-shu-bao tablet in heart failure with reduced ejection fraction by modulating THBD/ARRB1/FGF1/STIM1 signaling. Biomed Pharmacothe. 2023;165:115119. doi:10.1016/j.biopha.2023.115119
- Takawale A, Zhang P, Patel VB, Wang X, Oudit G, Kassiri Z. Tissue Inhibitor of Matrix Metalloproteinase-1 promotes myocardial fibrosis by mediating CD63-integrin β1 interaction. Hypertension. 2017;69(6):1092–1103. doi:10.1161/hypertensionaha.117.09045
- Siming T, Tao G, Yu W. Effect of extracorporeal cardiac shock wave therapy on MMP 1& TIMP1 after acute myocardial infarction in pigs. BMJ. 2011;97(Suppl 3):A71. doi:10.1136/heartjnl-2011-300867.205
- Hatano S, Kimata K, Hiraiwa N, et al. Versican/PG-M is essential for ventricular septal formation subsequent to cardiac atrioventricular cushion development. Glycobiology. 2012;22(9):1268–1277. doi:10.1093/glycob/cws095
- Feng J, Li Y, Li Y, et al. Versican promotes cardiomyocyte proliferation and cardiac repair. Circulation. 2024;149:1004–1015. doi:10.1161/circulationaha.123.066298
- Yan X, Anzai A, Katsumata Y, et al. Temporal dynamics of cardiac immune cell accumulation following acute myocardial infarction. J Mol Cell Cardiol. 2013;62:24–35. doi:10.1016/j.yjmcc.2013.04.023
- Kyaw T, Loveland P, Kanellakis P, et al. Alarmin-activated B cells accelerate murine atherosclerosis after myocardial infarction via plasma cell-immunoglobulin-dependent mechanisms. Eur Heart J. 2021;42(9):938–947. doi:10.1093/eurheartj/ehaa995
- Hofmann U, Beyersdorf N, Weirather J, et al. Activation of CD4+ T lymphocytes improves wound healing and survival after experimental myocardial infarction in mice. Circulation. 2012;125(13):1652–1663. doi:10.1161/circulationaha.111.044164
- Peet C, Ivetic A, Bromage DI, Shah AM. Cardiac monocytes and macrophages after myocardial infarction. Cardiovasc Res. 2019;116(6):1101–1112. doi:10.1093/cvr/cvz336
- Horckmans M, Ring L, Duchene J, et al. Neutrophils orchestrate post-myocardial infarction healing by polarizing macrophages towards a reparative phenotype. Eur Heart J. 2017;38(3):187–197. doi:10.1093/eurheartj/ehw002
- Li D, Deng L, Hu Z, et al. Optical clearing imaging assisted evaluation of urokinase thrombolytic therapy on cerebral vessels with different sizes. Biomed Opt Express. 2022;13(6):3243–3258. doi:10.1364/BOE.457912
- Mathey DG, Schofer J, Sheehan FH. Coronary thrombolysis with intravenous urokinase in patients with acute myocardial infarction. Am J Med. 1987;83(2a):26–30. doi:10.1016/0002-9343(87)90884-9
- Byun S, Lee SN, Lim S, et al. Triple antiplatelet therapy with cilostazol and favorable early clinical outcomes after acute myocardial infarction compared to dual antiplatelet therapy with standard or potent P2Y12 inhibitors. J Clin Med. 2022;11(22). doi:10.3390/jcm11226856
- Pang B-Y, Wang Y-H, Ji X-W, Leng Y, Deng H-B, Jiang L-H. Systematic review and meta-analysis of the intervention effect of curcumin on rodent models of myocardial infarction. Origin Res. 2022;13. doi:10.3389/fphar.2022.999386
- You J, Sun J, Ma T, et al. Curcumin induces therapeutic angiogenesis in a diabetic mouse hindlimb ischemia model via modulating the function of endothelial progenitor cells. Stem Cell Res Ther. 2017;8(1):182. doi:10.1186/s13287-017-0636-9
- Rahnavard M, Hassanpour M, Ahmadi M, et al. Curcumin ameliorated myocardial infarction by inhibition of cardiotoxicity in the rat model. J Cell Biochem. 2019;120(7):11965–11972. doi:10.1002/jcb.28480
- Xiao X, Chang G, Liu J, et al. Simvastatin ameliorates ventricular remodeling via the TGF‑β1 signaling pathway in rats following myocardial infarction. Mol Med Rep. 2016;13(6):5093–5101. doi:10.3892/mmr.2016.5178
- Smith P, Arnesen H, Holme I. The effect of warfarin on mortality and reinfarction after myocardial infarction. New Engl J Med. 1990;323(3):147–152. doi:10.1056/nejm199007193230302