
Abstract
Introduction
Osteoporosis diagnosis often utilizes quantitative computed tomography (QCT). This study explored the validity of applying lumbar bone mineral density (LBMD) standards to thoracic vertebrae (T8-T10) for osteoporosis detection during CT lung cancer screenings. This study investigated the utility of thoracic BMD (BMD-T8-T10) for detecting osteoporosis in older persons during CT lung cancer screening.
Methods
We studied 701 participants who underwent QCT scans for both LBMD and BMD-T8-T10. Osteoporosis was diagnosed using ACR criteria based on LBMD. We determined BMD-T8-T10 thresholds via a receiver operating characteristic (ROC) curve and translated BMD-T8+T9+T10 to LBMD (TTBMD) using linear regression. Kappa test was used to evaluate the accuracy of BMD-T8-T10 thresholds and TTBMD in diagnosing osteoporosis.
Results
Raw BMD-T8-T10 poorly identified osteoporosis (kappa = 0.51). ROC curve analysis identified BMD-T8-T10 thresholds for osteopenia (138 mg/cm3) and osteoporosis (97 mg/cm3) with areas under the curve of 0.97 and 0.99, respectively. We normalized BMD-T8-T10 to TTBMD based on the formula: TTBMD = 0.9 × BMD-T8-T10 - 2.56. These thresholds (kappa = 0.74) and TTBMD performed well in detecting osteoporosis/osteopenia (kappa = 0.74).
Conclusion
Both calculating BMD-T8-T10 threshold (138.0 mg/cm3 for osteopenia and 97 mg/cm3 for osteoporosis) and normalizing BMD-T8-T10 to LBMD demonstrated good performance in identifying osteoporosis in older adults during CT lung cancer screening.
Introduction
Osteoporosis diagnosis often utilizes quantitative computed tomography (QCT). The diagnostic criteria for lumbar spine QCT were based on the American College of Radiology (ACR) recommendations:Citation1 normal, >120 mg/cm3; low bone mass, 80–120 mg/cm3; and osteoporosis < 80 mg/cm3. These thresholds have been adopted for thoracic bone mineral density (BMD) to define low or very low bone mass.Citation2 However, it has been shown that the thoracic BMD is usually greater than those of the lumbar spine.Citation3 It is necessary to evaluate whether the thresholds of lumbar spine BMD (LBMD) and the ACR criteria could be applied to the thoracic BMD.
Chest CT scans are recommended for early lung cancer screening and coronary cardiac disease detection, which can reduce lung cancer and cardiovascular mortality rates. The target population for those detection have overlaps with the high-risk group for osteoporosis. QCT combined with routine clinical chest CT to quantify BMD enables opportunistic screening for osteoporosis without additional increase in the radiation dose or scan time. It would be interesting and helpful to evaluate osteoporosis during chest CT scans.
During a chest CT scan, the lumbar spine 1–2 (L1-2) is also imaged in approximately 11.57% of patients.Citation4 As a result, a few studies have demonstrated that osteoporosis can be opportunistically detected during chest CT scans.Citation5,Citation6 It is challenging to determine whether people have osteoporosis if a chest scan scans only the L1 region or no region of the lumbar spine. Osteoporosis can not be evaluated based only on BMD-L1. Finding methods to assess osteoporosis using thoracic BMD would be helpful. Interestingly, few studies have showed the role of thoracic BMD in osteoporosis diagnosis.Citation7,Citation8 Budoff et alCitation7 converted the BMD-T7+T8+T9 into equivalent LBMD, and then they obtained the T score. Their results showed that the average T-score calculated from measured lumbar spine was similar to the average T-score obtained from translated LBMD. However, their study only calculated the T-score and the performance of the ACR criteria (80 mg/cm3) was not tested in the translated LBMD. In addition, linear regression analysis was used in a recent study to determine the cut-off points of cervicothoracic BMD for osteoporosis and osteopenia.Citation8 However, subjects who underwent contrast-enhanced CT scans were included, and they only showed the cut-off point of single vertebra BMD (C2-T12) for osteoporosis/osteopenia evaluation. Usually, the diagnosis is based on the average BMD of at least two vertebrae. Moreover, that study only evaluated thresholds, and the ability of the thoracic BMD to identify osteoporosis was not tested. Furthermore, the proposed thresholds were calculated by substituting 120 mg/cm3 and 80 mg/cm3 into the linear regression equation. It is also valuable to use other methods to determine thresholds and test their performance.
Our previous study had reported two methods for osteoporosis/osteopenia evaluation based on thoracic BMD of T11 and T12.Citation9 However, for some chest CT scans, such as cardiac CT examination, T11 or T12 could not be scanned. Osteoporosis/osteopenia could not be evaluated during such chest CT scan. Therefore, in this study, we aimed to show the ability of BMD-T8-T10 in diagnosing osteoporosis/osteopenia in older adults who underwent both CT scans for lung cancer screening and QCT. We adopted two methods, one is to calculate the thresholds and another is to translate TBMD to LBMD, to improve the performance of BMD-T8-T10 in diagnosing osteoporosis/osteopenia. Our study may provide more widely applicable methods for osteoporosis evaluation during chest CT scans.
Methods
Participants
The participants’ information was reported in our previous study.Citation9 This study had the same ethics reference as the previous work as it is part of the research project. Briefly, this retrospective study was approved by the Institutional Review Board of the Affiliated Hospital of Nanjing University of Chinese Medicine (2019NL-158-01). Informed consent was waived by Institutional Review Board of the Affiliated Hospital of Nanjing University of Chinese Medicine because of the retrospective design. All patient data were anonymized. Subjects who underwent both CT lung cancer screening and QCT examinations between 2021 and 2023 were identified at our institution. Subjects whose thoracic spine (T8, T9, T10. BMD-T8-T10) and lumbar spine (L1-L2, BMD-L1+L2) were both scanned were included for further analysis. In addition, subjects with an osteoporotic compression fracture in T8-L2, history of surgery, history of tumors, ankylosing spondylitis and chronic diseases affecting bone metabolism, and who were taking drugs affecting bone metabolism were excluded. Finally, a total of 701 subjects (318 women and 383 men, 50–89 years old) were identified.
Bone Mineral Density Measurements
BMD was determined based on CT images obtained from OptimaCT660 scanner (GE, USA). The scan protocol was described in our previous study.Citation9 The brief scan protocol was as follows: tube voltage, 120 Kv; automatic mAs; and thickness, 0.625 mm. The CT images were transferred to the QCT workstation. Volumetric BMD measurements of the BMD-T8+T9+T10 and LBMD were performed by using commercially available software (Mindways QCT Pro; Mindways Software, synchronous calibration). The mean BMD-T8-T10 and LBMD were calculated for osteoporosis/osteopenia evaluation. Osteoporosis/osteopenia was diagnosed based on the LBMD according to the ACR criteria.
Methods for Evaluating Osteoporosis Based on BMD-T8-T10
Three methods were used to evaluate osteoporosis based on BMD-T8+T9+T10. The first was to define osteoporosis/osteopenia using BMD-T8-T10 based on the ACR criteria (normal, >120 mg/cm3; low bone mass, 80–120 mg/cm3; and osteoporosis < 80 mg/cm3). Second, we obtained new thresholds of BMD-T8+T9+T10 to define osteoporosis/osteopenia by using receiver operating characteristic (ROC) curve. Third, we obtained the linear regression equation between TBMD and LBMD, and translated TBMD to LBMD and then defined osteopenia or osteoporosis according to the ACR criteria.
Statistical Analysis
Statistical analyses were performed using the commercial software SPSS 25.0 and MedCalc (version 22.026). Comparisons between BMD-T8-T10 and LBMD were performed by using paired two-tailed t tests. The proportions of subjects with osteoporosis/osteopenia defined by the different methods were compared by Chi-square tests. The correlation between BMD-T8-T10 and LBMD was analyzed using Pearson’s correlation and linear regression analysis. A receiving operator characteristic (ROC) curve was used to determine the threshold of BMD-T8+T9+T10 (Youden index) for defining osteopenia or osteoporosis. The agreement of different approaches in defining osteopenia or osteoporosis was evaluated by using the kappa test. A Bland‒Altman plot was used to show the agreement between LBMD and TTBMD. Statistical significance was defined as p < 0.05.
Results
Characteristics of the Participants
The characteristics of the participants are shown in . The mean age was 65.0 years (women, 63.0; men, 67.2). The average LBMD was lower than that of BMD-T8-T10 (mean difference = 19.2 mg/cm3, 95% confidence interval (CI) = −18.6 to −21.0, p < 0.01) (). The BMDs of T8, T9, T10 and the lumbar spine (L1-L2) were 113.3 ± 39.7 mg/cm3, 116.8 ± 41.3 mg/cm3, 117.3 ± 41.1 mg/cm3 and 96.7 ± 36.3 mg/cm3, respectively. No significant differences were observed among BMDs of T8, T9, T10 (p > 0.05). The BMDs of men were greater than those in women (p < 0.05).
Table 1 Characteristics of the Subjects
Figure 1 Role of thoracic vertebral bone mineral density (BMD-T8+T9+T10) in identifying osteopenia and osteoporosis based on one American College of Radiology (ACR) criterion. The difference between thoracic vertebral bone mineral density (BMD-T8-T10) and lumbar bone mineral density (LBMD) (A) The kappa test showed moderate agreement in identifying osteoporosis between BMD-T8-T10 and lumbar spine BMD (kappa = 0.51) (B). Compared to those in the gold standard group, the proportions of osteopenia and osteoporosis defined by BMD-T8+T9+T10 groups were significantly different (C) ***, P < 0.001.
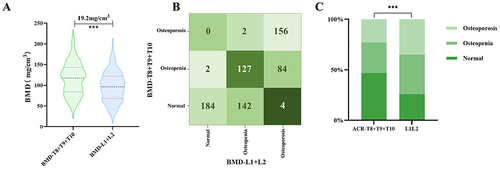
The Diagnostic Performance of BMD-T8-T10 for Osteoporosis/Osteopenia Based on the ACR Criteria
The agreement of osteoporosis/osteopenia identification between BMD-T8+T9+T10 and LBMD was moderate (kappa = 0.51, 95% CI: 0.45–0.56, p < 0.001) according to the ACR diagnostic criteria (). The positive predictive value (PPV) and specificity were high (> 98%), but the negative predictive value (NPV) and sensitivity were low (). Only 57.6% (156/271) and 52.9% (129/244) of the subjects were diagnosed with osteoporosis/osteopenia, respectively, when the 80 mg/cm3 threshold was used for BMD-T8+T9+T10, which was significantly lower than the gold standard (p < 0.01) ().
Table 2 Performance of Low Thoracic Vertebral Bone Mineral Density (BMD-T8+T9+T10)
Calculating the Cut-off Point of Thoracic Vertebral Bone Mineral Density
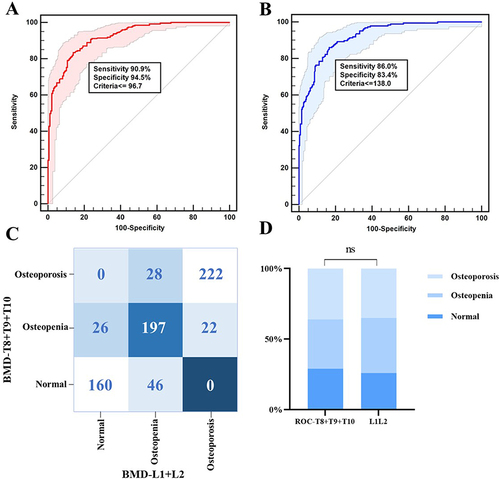
Subsequently, we calculated the cut-off point of BMD-T8-T10 for diagnosing osteoporosis/osteopenia using ROC curves. 138.0 mg/cm3 had acceptable performance in identifying osteopenia (area under the curve (AUC) = 0.98, with a sensitivity of 86.0%, specificity of 83.4%) () and 97.0 mg/cm3 had good performance in identifying osteoporosis (AUC = 0.96, with a sensitivity of 90.9%, specificity of 94.5%) (). Then, we defined osteoporosis/osteopenia based on the two obtained thresholds of BMD-T8-T10. The agreement between BMD-T8-T10 and the gold standard for identifying osteopenia and osteoporosis was moderate (kappa = 0.74, 95% CI: 0.70–0.78, p < 0.001) (). The proportion of subjects with osteoporosis/osteopenia defined by the two thresholds was not significantly different compared to the gold standard (p > 0.05) (). The accuracy of BMD-T8-T10 was 87.1% (162/186), 72.7% (197/271) and 91.0% (222/244) for identifying normal, osteopenia, and osteoporosis, respectively. The NPV and sensitivity were greater than those defined according to the thresholds of 120 mg/cm3 and 80 mg/cm3 ().
Figure 2 The performance of the thoracic vertebral bone mineral density (BMD-T8+T9+T10) in identifying osteopenia and osteoporosis. Receiver operating characteristic curves (ROC) were generated for the identification of osteopenia (A) and osteoporosis (B). The thresholds were 138 mg/cm3 and 97 mg/cm3. Then, we identified osteopenia and osteoporosis using these two thresholds. The kappa test showed good agreement in identifying osteoporosis between BMD-T8+T9+T10 and lumbar spine BMD (kappa = 0.74) (C). Compared to those of the gold standard group, the proportions of osteopenia and osteoporosis defined by the two thresholds were not significantly different (p > 0.05) (D). NS: not significant.
Translated Thoracic Vertebral Bone Mineral Density
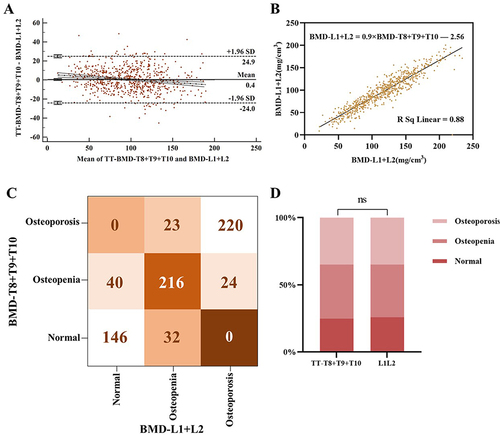
We found that LBMD was highly correlated with BMD-T8-T10 (r = 0.94) (). Therefore, we normalized BMD-T8-T10 to LBMD based on the following formula: TTBMD = 0.9 × BMD-T8-T10 - 2.56. Then, we obtained the translated BMD (TTBMD) based on the BMD-T8+T9+T10 data. The Bland‒Altman plot showed good agreement between LBMD and TTBMD (). Subsequently, we defined osteoporosis/osteopenia based on the TTBMD according to the ACR criteria. The agreement between LBMD and TTBMD for identifying osteopenia and osteoporosis was high (kappa = 0.74, 95% CI: 0.71–0.76, p < 0.001) (). Compared to the gold standard, the proportion of subjects with osteoporosis/osteopenia defined by TTBMD was not significantly different (p > 0.05) (). The accuracy of TTBMD were 78.5% (146/186), 80.0% (216/271) and 90.1% (221/244) for identifying normal vertebrae, osteopenia, and osteoporosis, respectively. The NPV and sensitivity were greater than those defined according to the thresholds of 120 mg/cm3 and 80 mg/cm3, respectively ().
Figure 3 The Bland‒Altman plot also showed good agreement between lumbar bone mineral density (LBMD) and translated thoracic BMD (TTBMD) (A) A formula (LBMD = 0.9 × BMD-T8-T10 – 2.56) was obtained to translate the LBMD based on the thoracic BMD (BMD-T8-T10) (B) and the performance of the translated LBMD in identifying osteopenia and osteoporosis was evaluated. The kappa test showed good agreement in identifying osteoporosis between the TTBMD and LBMD (kappa = 0.74) (C) Compared to those of the gold standard group, the the proportions of osteopenia and osteoporosis defined by TTBMD were not significantly different (p > 0.05) (D) NS: not significant.
Discussion
During chest CT, the thoracic spine is typically examined, providing the chance to quantify the spine’s BMD. The ACR suggested criteria, however, are predicated on LBMD. It is unclear what TBMD levels are for diagnosing osteoporosis. The BMD of T8-T10 is usually greater than that of LBMD.Citation3,Citation7,Citation10 In addition, BMD-T8-T10 was strongly correlated with LBMD (r > 0.80).Citation7,Citation11 Similar high correlation (r = 0.94) was also observed in the present study. It is possible to normalize BMD-T8-T10 to LBMD for the definition of osteoporosis due to the strong positive association. In this work, we investigated two methods for defining osteoporosis or low bone mass based on BMD-T8-T10. One is to determine whether osteopenia or osteoporosis is present by calculating the BMD-T8-T10 threshold (138.0 mg/cm3 for osteopenia and 97 mg/cm3 for osteoporosis). The alternative is to normalize the BMD-T8-T10 data to LBMD and then classify osteopenia or osteoporosis according to the ACR criteria. Both approaches demonstrated strong agreement with the LBMD-based strategy. Our study identified tools for diagnosing osteoporosis if the BMD of L1 and L2 cannot be assessed via chest CT.
Several studies have shown that the thoracic BMD is greater than that of lumber spine.Citation3,Citation12 Therefore, we speculated that the ACR criteria may be not refer to thoracic BMD for osteoporosis/osteopenia diagnosis. Our results showed that the agreement of osteoporosis/osteopenia identification between BMD-T8-T10 and LBMD was moderate (kappa = 0.51), which demonstrated that it is not a good choice to use raw thoracic BMD for osteopenia/osteoporosis diagnosis. Other methods should be considered.
The use of thoracic BMD for defining osteoporosis/osteopenia has not been well studied. Using the LBMD-based osteoporosis/osteopenia as a reference standard, we calculated the BMD-T8-T10 threshold for detecting osteopenia and osteoporosis. For osteopenia, the cutoff value was 138 mg/cm3, and for osteoporosis, it was 97 mg/cm3. When defining osteopenia or osteoporosis, the two cut-off points agreed well with those for LBMD (kappa = 0.74). Few studies have also shown the cut-off point of thoracic BMD for osteopenia or osteoporosis diagnosis. BMD thresholds at T8 (126.6 mg/cm3 for osteopenia and 94.1 mg/cm3 for osteoporosis), T9 (128.8 mg/cm3 for osteopenia and 95.4 mg/cm3 for osteoporosis) and T10 (131.0 mg/cm3 for osteopenia and 95.0 mg/cm3 for osteoporosis) were reported for defining osteoporosis/osteopenia.Citation8 The cut-off point for osteoporosis in our study was close to the published data. However, the performance of those cut-off points was not tested. Moreover, that study only showed cut-off point of a single vertebral body. To our knowledge, the thresholds of combined T8, T9 and T10 were not reported. Furthermore, a linear regression equation was used to obtain the cut-off point.Citation8 ROC curve, which is frequently used to determine the ideal cut-off point, was utilized to calculate the thresholds in our study. It is vital to verify the efficacy of this strategy.
Low-dose CT for lung cancer screening has gradually increased over the past decade. The age of lung cancer onset and the age of osteoporosis onset have overlap. The US guideline recommended that adults aged 50 to 80 years with high-risk should undergo annual screening for lung cancer.Citation13 China guideline also recommended that those subjects older than 50 years should undergo such screening.Citation14 Moreover, lung cancer screening is recommended for individuals with chronic obstructive pulmonary disease, which usually occurs in older person in China.Citation15 Every year, a large number of middle-aged and elderly people undergo lung CT cancer screening in China. Osteoporosis/osteopenia identification during CT scans did not increase radiation exposure or scanning time. Several studies have demonstrated that cardiac CT could be used for identifying individuals with low bone mass or with a high risk of fracture.Citation2,Citation16 Our study calculated the threshold of BMD-T8-T10 for osteoporosis/osteopenia identification, which may be used to diagnose osteoporosis during CT lung scans and cardiac CT.
Our study also has several limitations. First, the sample size was relatively small. Our results might need to be validated in studies with large sample sizes. Second, we only calculated the cut-off point of BMD-T8-T10 because cardiac CT usually scans such sections and our results may be extended to those subjects who underwent cardiac CT because chronic coronary diseases are also highly prevalent in older adults. In addition, our results and those of a recent study both showed that the BMD of T8, T9 and T10 were relatively close.Citation17 Third, our study included only subjects older than 50 years because people of these ages are recommended to undergo CT lung cancer screening. Future research is needed to determine whether our findings can be applied to younger adults. Fourth, subjects who were taking drugs affecting bone metabolism and those who had a history of surgery, tumors, ankylosing spondylitis or chronic diseases affecting bone metabolism were excluded. However, we cannot exclude all pharmacological therapies and comorbidities that may affect bone. Finally, it has been shown that thoracic BMD is related to fracture risk.Citation18 However, we did not show the role of our methods in predicting fracture risk.
In conclusion, our research demonstrated that the ACR criteria for may not be appropriate for BMD-T8-T10 for identifying osteoporosis/osteopenia. In the present study, we obtained two cut-off point for osteoporosis/osteopenia diagnosis based on BMD-T8-T10: 97 mg/cm3 for osteoporosis, 138 mg/cm3 for osteopenia. In addition, translating BMD-T8-T10 to LBMD is also useful for identifying osteoporosis/osteopenia. Based on information on the translated LBMD and the BMD-T8-T10 cut-off point, the two methods demonstrated good diagnostic performance in detecting osteoporosis. To determine generalizable BMD-T8-T10 thresholds for osteoporosis, more research is needed.
Ethics Approval and Consent to Participate
This study conformed to the ethics principles set forth by the Declaration of Helsinki. This retrospective study was approved by the Institutional Ethics Review Board of the Affiliated Hospital of Nanjing University of Chinese Medicine. Informed consent was waived by Institutional Review Board of the Affiliated Hospital of Nanjing University of Chinese Medicine because of the retrospective design. All patient data were anonymized.
Disclosure
The authors report no conflicts of interest in this work.
Additional information
Funding
References
- Practice parameter for the performance of quantitative computed tomography (QCT) bone densitometry. American College of Radiology; 2018. Available from: https://www.acr.org/Quality-Safety/Standards-Guidelines/Practice-Guidelines-by-Modality/CT. Accessed November 12, 2019.
- Therkildsen J, Nissen L, Jorgensen HS, et al. Thoracic Bone Mineral Density Derived from Cardiac CT Is Associated with Greater Fracture Rate. Radiology. 2020;296(3):499–508. doi:10.1148/radiol.2020192706
- Budoff MJ, Khairallah W, Li D, et al. Trabecular bone mineral density measurement using thoracic and lumbar quantitative computed tomography. Acad Radiol. 2012;19(2):179–183. doi:10.1016/j.acra.2011.10.006
- Wang Y, Yang Y, He S. Low-dose chest CT and QCT ”one-stop-shop” scan technology: a feasibility study. Radiol Prac. 2018;33(11):1194–1197.
- Jang S, Graffy PM, Ziemlewicz TJ, et al. Opportunistic osteoporosis screening at routine abdominal and thoracic ct: normative l1 trabecular attenuation values in more than 20 000 adults. Radiology. 2019;291(2):360–367. doi:10.1148/radiol.2019181648
- Cheng X, Zhao K, Zha X, et al. Opportunistic screening using low-dose CT and the prevalence of osteoporosis in china: a nationwide, multicenter study. J Bone Miner Res. 2021;36(3):427–435. doi:10.1002/jbmr.4187
- Budoff MJ, Hamirani YS, Gao YL, et al. Measurement of thoracic bone mineral density with quantitative CT. Radiology. 2010;257(2):434–440. doi:10.1148/radiol.10100132
- Ruhling S, Scharr A, Sollmann N, et al. Proposed diagnostic volumetric bone mineral density thresholds for osteoporosis and osteopenia at the cervicothoracic spine in correlation to the lumbar spine. Eur Radiol. 2022;32(9):6207–6214. doi:10.1007/s00330-022-08721-7
- Hu N, Wang M, Yang M, et al. Bone mineral density in lower thoracic vertebra for osteoporosis diagnosis in older adults during CT lung cancer screening. BMC Geriatr. 2024;24(1):237. doi:10.1186/s12877-024-04737-4
- Chen W, Zheng R, Zhang S, et al. Annual report on status of cancer in China, 2010. Chin J Cancer Res. 2014;26(1):48–58. doi:10.3978/j.issn.1000-9604.2014.01.08
- Johannesdottir F, Allaire B, Kopperdahl DL, et al. Bone density and strength from thoracic and lumbar CT scans both predict incident vertebral fractures independently of fracture location. Osteoporos Int. 2021;32(2):261–269. doi:10.1007/s00198-020-05528-4
- Hayashi T, Chen H, Miyamoto K, et al. Analysis of bone mineral density distribution at trabecular bones in thoracic and lumbar vertebrae using X-ray CT images. J Bone Miner Metab. 2011;29(2):174–185. doi:10.1007/s00774-010-0204-1
- Moyer VA. Screening for lung cancer: u.S. Preventive Services Task Force recommendation statement. Ann Intern Med. 2014;160(5):330–338. doi:10.7326/M13-2771
- He J, Li N, Chen WQ, et al. China guideline for the screening and early detection of lung cancer (2021, Beijing). Zhonghua Zhong Liu Za Zhi. 2021;43(3):243–268. doi:10.3760/cma.j.cn112152-20210119-00060
- Luo X, Zheng S, Liu Q, et al. Should Nonsmokers Be Excluded from Early Lung Cancer Screening with Low-Dose Spiral Computed Tomography? Community-Based Practice in Shanghai. Transl Oncol. 2017;10(4):485–490. doi:10.1016/j.tranon.2017.02.002
- Therkildsen J, Winther S, Nissen L, et al. Feasibility of opportunistic screening for low thoracic bone mineral density in patients referred for routine cardiac CT. J Clin Densitom. 2020;23(1):117–127. doi:10.1016/j.jocd.2018.12.002
- Salzmann SN, Okano I, Jones C, et al. Thoracic bone mineral density measured by quantitative computed tomography in patients undergoing spine surgery. Spine J. 2021;21(11):1866–1872. doi:10.1016/j.spinee.2021.05.016
- Li D, Mao SS, Budoff MJ. Trabecular bone mineral density as measured by thoracic vertebrae predicts incident Hip and vertebral fractures: the multi-ethnic study of atherosclerosis. Osteoporos Int. 2024;35(6):1061–1068. doi:10.1007/s00198-024-07040-5