
Abstract
Background
In this study, we evaluate homeostatic markers correlated to autonomic nervous and endothelial functions in a population of coronary artery disease (CAD) patients versus a control group. Since CAD is the highest risk marker for sudden cardiac death, the study objective is to determine whether an independent cardiovascular risk score based on these markers can be used alongside known conventional cardiovascular risk markers to strengthen the understanding of a patient’s vascular state.
Materials and methods
Sixty-five subjects (13 women) with a mean age of 62.9 years (range 40–80 years) who were diagnosed with CAD using coronary angiography (group 1) and seventy-two subjects (29 women) with a mean age of 45.1 years (range 18–85 years) who claimed they were healthy (group 2) were included in the study. These subjects underwent examination with the TM-Oxi and SudoPath systems at IPC Heart Care Centers in Mumbai, India. The TM-Oxi system takes measurements from a blood pressure device and a pulse oximeter. The SudoPath measures galvanic skin response to assess the sudomotor pathway function. Spectral analysis of the photoplethysmograph (PTG) waveform and electrochemical galvanic skin response allow the TM-Oxi and SudoPath systems to calculate several homeostatic markers, such as the PTG index (PTGi), PTG very low frequency index (PTGVLFi), and PTG ratio (PTGr). The focus of this study was to evaluate these markers (PTGi, PTGVLFi, and PTGr) in CAD patients against a control group, and to calculate an independent cardiovascular risk factor score: the PTG cardiovascular disease risk score (PTG CVD), calculated solely from these markers. We compared PTGi, PTGVLFi, PTGr, and PTG CVD scores between the CAD patient group and the healthy control group. Statistical analyses were performed using receiver operating characteristic curves to determine the specificity and sensitivity of the markers to detect CAD at optimal cutoff values for PTGi, PTGVLFi, PTGr, and PTG CVD. In addition, correlation analyses between these markers and conventional autonomic nervous system and endothelial function markers were performed to understand the possible underlying physiological sources of the differences observed in marker values between CAD patients and healthy control patients. Additionally, t-tests were performed between two subgroups of the CAD patient group to determine whether diabetic or coronary artery bypass grafting (CABG) patients have significantly different PTGi marker values.
Results
Each spectral analysis PTG marker yielded a high specificity and sensitivity to detect CAD. Most notably, the PTG CVD score had a sensitivity of 82.5% and specificity of 96.8%, at a cutoff of 2, when used to detect CAD (P=0.0001; area under the receiver operating characteristic curve =0.967). The PTG spectral analysis markers were well-correlated to other autonomic nervous system and endothelial function markers. CAD diabetic patients (n=27) had a lower PTGi value compared with the CAD non-diabetic patients (n=38): and patients that underwent CABG (n=18) had a higher PTGi value compared with the CAD without CABG surgery patients (n=47).
Conclusion
The spectral analysis of the photoplethysmography method is noninvasive, fast, operator-independent, and cost-effective, as only an oximeter and galvanic skin response device are required in order to assess in a single testing the autonomic nervous system and endothelial function. The spectral analysis techniques used on the photoplethysmogram, as outlined in this study, could be useful when used alongside conventional known cardiovascular disease risk markers.
Introduction
Sudden cardiac death is the most likely consequence of both men (50%) and women (64%) with coronary artery disease (CAD).Citation1 Currently, the only available strategy to reduce mortality in the at-risk population is primary prevention.Citation1 CAD is a multifactorial disease that usually develops many years before any clinical symptoms are manifest; it is caused by risk factors such as hyperlipoproteinemia, high cholesterol diet, smoking, and diabetes mellitus.Citation1
Over the last dozen years, appreciation of the role of endothelial dysfunction in CAD has burgeoned,Citation2–Citation4 as well as the role of cardiac autonomic neuropathy (CAN) in silent myocardial ischemia and cardiovascular morbidity.Citation5
In addition, sympathetic stimulation significantly impairs the endothelial function by an alpha-adrenergic mechanism and therefore there is a relationship between the vascular and general homeostatic markers.Citation6
Despite the fact that the autonomic nervous system and endothelial dysfunction increase cardiovascular risk, they do not contribute to either the Framingham score or the new American Heart Association/American College of Cardiology cardiovascular risk calculator.Citation7
Endothelial dysfunction or damage is characterized by reduction of the bioavailability of nitric oxide, which upsets the balance between vasoconstriction and vasodilation and initiates a number of processes that promote hypertension.Citation8 In addition, endothelial damage includes increased endothelial permeability, platelet aggregation, proinflammatory and procoagulatory states, and monocytes migration from the blood into the subendothelial intima and transformation into macrophages, which accumulate lipids to form the lipid core of atherosclerotic plaque.Citation9
Plaque rupture can cause continued development of the atherosclerotic lesion by inducing further thrombus formation and release of more inflammatory mediators, resulting in continued luminal narrowing.Citation10
A more drastic outcome of plaque rupture is arterial occlusion, which can result in myocardial infarction, ischemic stroke, or critical ischemia in peripheral tissues.Citation11
The gold standard test for the evaluation of coronary endothelial function requires invasive quantitative coronary angiography to examine the changes in diameter in response to intracoronary infusions of endothelium-dependent vasodilators such as acetylcholine.Citation12
Although several invasive tests have been employed successfully for the assessment of endothelial function over the last two decades, attention has now focused predominantly on noninvasive techniques.
A number of noninvasive techniques are now available for assessment of forearm vascular reactivity, and presently the most frequently used method involves flow-mediated dilation of the brachial artery, using ultrasound imaging. In this method, brachial diameter is measured at baseline and after an increase in arterial shear stress induced by inflation, then deflation, of a sphygmomanometric arm cuff that elicits reactive hyperemia and brachial vasodilation, predominantly caused by endothelium-derived nitric oxide release.Citation13
One such newer methodology involves digital pulse amplitude tonometry, which measures volumetric changes in the fingertip using a probe that quantifies pulse amplitude in response to reactive hyperemia.Citation14
Another device that is fairly quick and simple to use involves fingertip infrared light transmission photoplethysmography, which performs digital pulse volume waveform analysis and generates an automated reflection index (RI).Citation15
CAN is also often underdiagnosed but can lead to severe morbidity and mortality, due to the associated cardiovascular burden.Citation16 New evidence has emerged surrounding its complex pathways, but its full pathogenesis is yet to be understood. CAN manifests in a spectrum of subclinical and clinical presentations, ranging from resting tachycardia to cardiomyopathy.
Scintigraphy has enabled the diagnosis of CAN at a subclinical stage.Citation17 Also, a battery of tests using tilt table and sudomotor evaluation induced by injection of acetylcholine are being used in diagnosis.Citation18 The Toronto Consensus Panel on Diabetic Neuropathy has recently issued guidance for the diagnosis of CAN based on heart rate variability analysis and heart rate responses to deep breathing, standing, and Valsalva maneuver, as well as blood pressure response to standing. This guidance is considered as the gold standard in clinical testing for autonomic neuropathy.Citation19
Despite the clinical need to assess endothelial function and the autonomic nervous system, several limitations have precluded its integration into clinical practice, partly owing to technical limitations that require extensive training, expensive equipment, and are labor-intensive, that have prompted a search for techniques inherently faster and easier to perform.
The TM-Oxi system assesses adrenergic and cardiovagal autonomic nervous system function in order to detect CAN as well as endothelial function in order to detect cardiovascular risk. It uses an automatic blood pressure device and an oximeter for heart rate detection and monitoring of blood volume and blood flow during the cardiac cycle (photoplethysmography). The SudoPath system assesses a patient’s galvanic skin response by stimulating the post-sympathetic cholinergic fibers in order to measure sweat gland density and skin microcirculation.
The objective of this study is to evaluate the TM-Oxi and SudoPath systems that use a patented, noninvasive analytical approach to assess new markers correlated to endothelial and autonomic nervous system functions by calculating the specificity and sensibility of these markers to detect CAD patients.
Materials
Two marketed medical devices, the TM-Oxi and SudoPath systems (LD Technology, Miami, FL, USA), were used in the study (see ).
Figure 1 Photograph of the integrated medical devices (TM-Oxi and SudoPath).
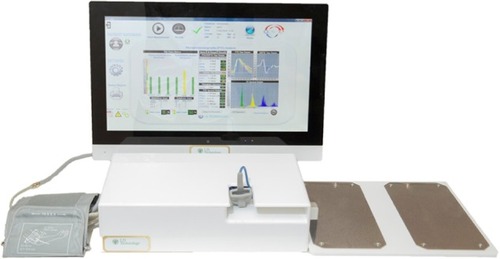
The TM-Oxi uses a pulse oximeter and an automatic oscillometric blood pressure device managed by software. The pulse oximeter waveform or photoplethysmograph (PTG) is a simple and noninvasive optical technique that can be used to detect blood volume changes in the microvascular tissue bed.Citation20
The PTG waveform is comprised of a pulsatile (alternating current) physiological waveform attributed to cardiac synchronous changes in the blood volume with each heartbeat and is superimposed on a slowly varying (direct current) baseline with various lower frequency components attributed to respiration, sympathetic nervous system activity, and thermoregulation.Citation21
The TM-Oxi performs PTG analysis of the beat-to-beat heart rate (RR intervals) and the PTG contour. The PTG analysis of RR intervals is based on the heart rate variability analysis as described by the Task Force of the European Society of Cardiology and the North American Society Task force,Citation22 and from Ewing tests (eg, Valsalva maneuver, deep breathing, and change in posture) as described by the CAN subcommittee of the Toronto Consensus Panel on Diabetic Neuropathy.Citation19
The PTG contour analysis is based on the PTG analysis as described in various studies in Asia, Europe, and the USA,Citation23,Citation24 and on the patented spectral analysis of the wave harmonics as described below. These measurements identify abnormal cardiovascular function, possibly stemming from autonomic nervous system and endothelial dysfunction.Citation24
The conventional PTG analysis performed by TM-Oxi
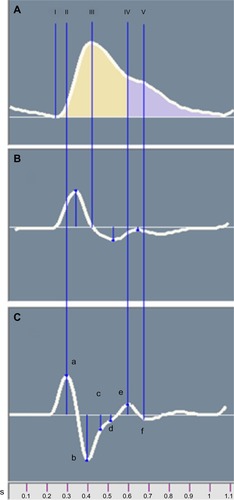
The original PTG () displays measurements of relative blood volume in the fingertip during cardiac events. The first derivative PTG () peaks are used for accurate detection of the beat-to-beat heart rate (RR intervals). The second derivative PTG () has been developed to allow for more accurate recognition of the inflection points on the original PTG wave.Citation15 The ratios of the amplitude of |a| to the amplitudes of |b|, |c|, |d|, and |e| can aid in understanding arterial stiffness. Studies have shown that ratio negative second derivative b/a and second derivative d/a decrease in aging populations and some studies have linked these ratios directly to arterial distensibility.Citation23,Citation24 Additionally, the ratio between the heights of the dicrotic notch divided by the PTG peak is the Reflection Index (RI) ratio, which was also used in this study.
Figure 2 Averaged photoplethysmograph wave (A) and its first (B) and second (C) derivatives.
SudoPath system: patented sudomotor function assessment (patent number # US 61835064)
The SudoPath is a galvanic skin response that uses two large stainless steel electrodes placed on the soles of the feet, where sweat gland density is very high. The device generates a low voltage signal with weak direct current that is fed to the active electrode. The current is delivered to the contralateral electrode–person circuit in two directions for each pathway. During the patented measurement process, the polarity is alternated at the middle of each measured pathway. The electrical stimulation provokes an electrochemical reaction on the bulk of the electrodes, measured as electro-conductance response nitric oxide, which corresponds to the skin microcirculation, and electro-conductance response chloride, which corresponds to sweat gland density. The method is described on the manufacturer’s web site (http://www.ldteck.com/galvanic-skin-response.html).
Patented signal processing analysis of the TM-Oxi (patent number PCT/IB2013/002595)
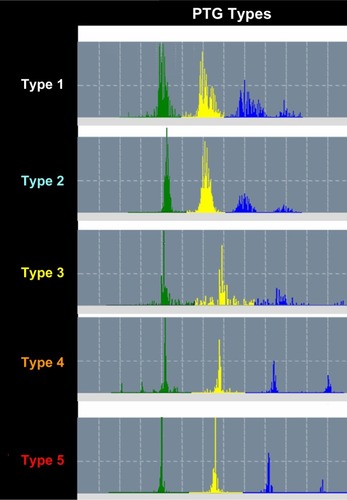
Analysis of the fast Fourier transform (FFT) of the PTG recording is a patented signal processing analytical method and could reveal information regarding autonomic nervous system activity and arterial status. In , a 2-minute FFT PTG recording shows the characteristic peaks and frequency bands of a healthy subject. Average heart rate, power of each frequency band, peak amplitudes and their corresponding frequency bins, and total power (TP) can be extracted from this information. Harmonic components included in the FFT PTG include those associated with heart rate variability, the respiratory effects on the cardiac cycle, systolic and diastolic effects on peripheral blood flow, and the ability for blood vessels to dilate and contract. Harmonic components are very low frequency (PTGVLF), low frequency, and high frequency. In addition, parameters calculated from these components and from the SudoPath tests include: PTG index (PTGi), corresponding to the average of the amplitude of the three components expressed in volts per second (V/s), PTGVLF index (PTGVLFi), corresponding to the ratio of PTGVLF area/electro-conductance response nitric oxide expressed in milliseconds squared/microsiemens (msCitation2/μS), and PTG ratio (PTGr), corresponding to the PTGVLF area/PTGi ratio. A PTG cardiovascular (PTGCVD) score is calculated using the three markers PTGi, PTGVLFi, and PTGr. Each marker is scored as 0= normal, 1= borderline, and 2= abnormal, in order to calculate the PTGCVD score. shows the FFTPTG split into five groups by PTGi value.
Figure 3 Spectral analysis of the first derivative of the photoplethysmography.
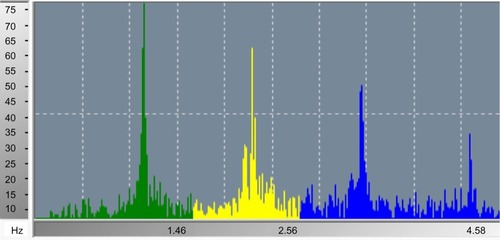
Figure 4 Spectral analysis of the photoplethysmography.
Abbreviation: PTGi, photoplethysmography index.
Experimental design
Sixty-five patients (13 women) with a mean age of 62 years (range 40–80 years) who were diagnosed with CAD (group 1) and seventy-two subjects (29 women) with a mean age of 45.1 years (range 18–85 years) who claimed they were healthy (group 2) were included in the study.
Patients in group 1 were diagnosed with CAD by coronary angiography and all subjects underwent examination with the TM-Oxi and SudoPath systems at IPC Heart Care Centers in Mumbai, India. describes the subject demographics and describes the associated disease and treatment of CAD patients.
Table 1 Subject demographic information
Table 2 Group 1 subject diseases and treatments
The study was conducted according to the ethical principles of the Declaration of Helsinki. All of the subjects provided written informed consent and confidentiality was maintained for all subjects.
Subjects who were over the age of 18 years and had the ability to provide written informed consent were included in this study.
Patients were excluded from this study if they wore an automatic external defibrillator device, had erratic, accelerated, or mechanically-controlled irregular heart rhythms, had arterial fibrillation/flutter, had atrioventricular block, and/or had any implanted electronic device. These conditions were contraindications of the TM-Oxi and SudoPath devices.
Data analysis
Statistical analysis was performed using receiver operating characteristic curves to determine the specificity and sensitivity of PTGi, PTGVLFi, PTGr, and PTGCVD in detecting CAD. The t-tests were also performed to determine if a significant difference in marker values between subgroups of group 1 (diabetic patients and patients who have had coronary artery bypass grafting [CABG] surgery), as outlined in this study, existed.
Additionally, in order to understand the physiological parameters measured by PTGi, correlation analyses were performed between PTGi and RI, PTGi and heart rate variability score (TP), PTGi and age, and PTGi and CAN score.
Sample size calculation and statistical analysis
Based upon the preliminary study results, to have 90% power to detect a significant difference between subjects with the above mean and standard deviation at alpha =0.05, 30 subjects per group needed to be included. The sample size (n≥30 and α=0.05%) was determined using MedCalc statistical software (http://www.medcalc.org/publications/journals.php).
Results
MedCalc statistical software was used to perform the statistical analysis of the collected data with the function receiver operating characteristic curves in order to determine the specificity and sensitivity of the markers as shown in and .
Figure 5 Receiver operating characteristic curves for photoplethysmography spectral analysis markers (image generated in Microsoft Excel from data gathered from MedCalc statistical software).
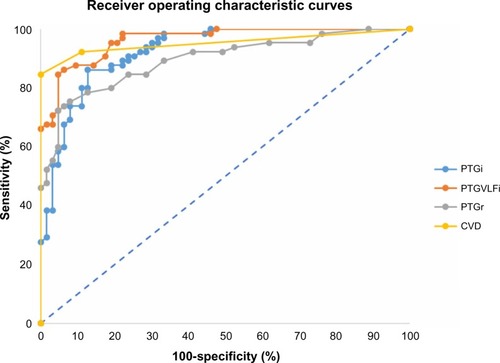
Table 3 PTG spectral analysis markers results (data gathered from MedCalc statistical software) for detecting coronary artery disease
MedCalc statistical software was used to perform the statistical analysis of the collected data with the coefficient of correlation in order to determine the correlation of the markers with endothelial and autonomic nervous system markers as shown in and –.
Figure 6 Scatter gram for evaluating the correlation of PTGi/RI.
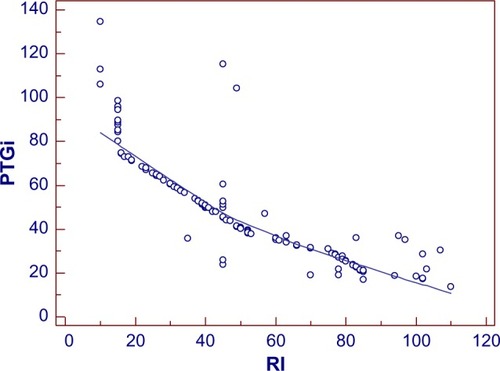
Figure 7 Scatter gram for evaluating the correlation of PTGi/total power.
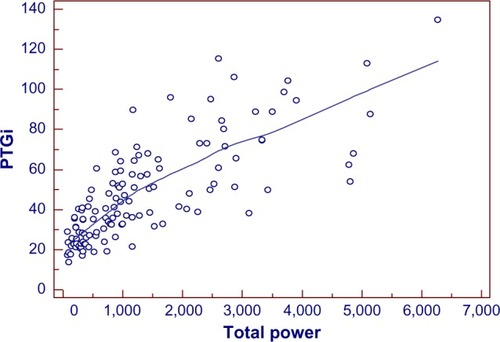
Figure 8 Scatter gram for evaluating the correlation of PTGVLFi/CAN score.
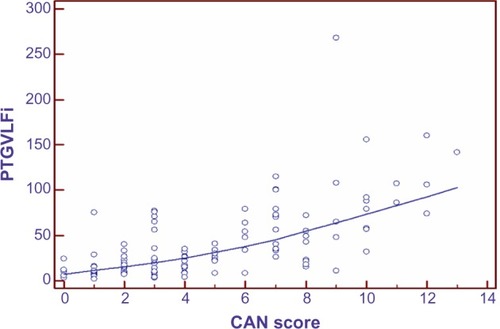
Figure 9 Scatter gram for evaluating the correlation of PTGi/age.
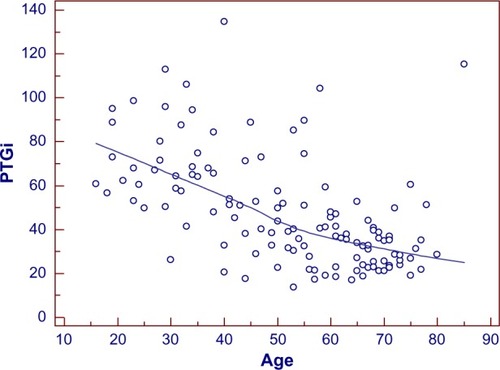
Table 4 Coefficient of correlation (r) for PTG spectral analysis markers and endothelial/autonomic nervous system function markers (data gathered from MedCalc statistical software)
The coefficient of correlation, r, was performed between the spectral analysis markers and RI (marker of endothelial function). As shown in , r=−0.87 for PTGi/RI (P=0.0001), r=0.76 for PTGVLFi/RI (P=0.0001), and r=0.70 for PTGr/RI (P=0.0001).
The coefficient of correlation, r, was performed between the spectral analysis markers and TP (marker of heart rate variability score). As shown in , r=0.76 for PTGi/TP (P=0.0001), r=−0.51 for PTGVLFi/TP (P=0.0001), and r=0.50 for PTGr/TP (P=0.0001).
The coefficient of correlation, r, was performed between the spectral analysis markers and CAN score (marker of presence of cardiac autonomic neuropathy). As shown in , r=−0.56 for PTGi/CAN (P=0.0001), r=0.64 for PTGVLFi/CAN (P=0.0001), and r=0.41 for PTGr/CAN (P=0.0001).
The coefficient of correlation, r, was performed between the spectral analysis markers and age. As shown in , r=−0.54 for PTGi/age (P=0.0001), r=0.47 for PTGVLFi/age (P=0.0001), and r=0.32 for PTGr/age (P=0.002).
In addition, statistical analyses using t-tests were performed to compare PTGi values between the subgroups of the CAD patients.
CAD diabetic patients (n=27) had a lower PTGi value compared to the CAD non-diabetic patients (n=38). The mean PTGi in the CAD diabetic patient group was 24 V/s versus 33 V/s in the CAD non-diabetic patient group (P=0.0001). Patients who underwent CABG (n=18) had a higher PTGi value compared to that of the CAD patients who did not undergo CABG surgery (n=47). The mean PTGi for CAD patients who had CABG surgery was 34 V/s versus 30 V/s for CAD patients who did not have CABG surgery (P=0.01).
Discussion
The results demonstrate that the PTG spectral analysis markers reflect homeostatic functions through correlation analyses with conventional markers of endothelial and autonomic nervous system function. The highest correlation of the PTG spectral analysis markers with the conventional markers of endothelial and autonomic nervous system functions are as follows:
PTGi correlated to endothelial function (r=−0.87) and PTGVLFi correlated to CAN (r=0.64).
PTGr has a lower correlation coefficient with autonomic nervous system function than the previous markers, but still has a good correlation with endothelial function (r=0.70).
Since the pathological state known as endothelial dysfunction is recognized as the main factor of the pathogenesis of CADCitation2 and CAN is a risk marker of mortality and cardiovascular morbidity,Citation7 we can explain the good specificity and sensitivity of the PTG spectral analysis markers when comparing the CAD patient group to the healthy control group.
The digital pulse amplitude tonometry study showed that an EndoPAT index cutoff value of 1.67 yields a sensitivity of 82%, a specificity of 77%, and area under the curve of 0.82 when used to diagnose coronary endothelial function.Citation14
The present study showed that PTGCVD score, based on spectral analysis PTG markers, with a cutoff value of 2, returns a roughly equivalent sensitivity (82.5%) but higher specificity (96.8%) and area under the curve (0.967).
Several limitations have precluded the endothelial and autonomic nervous system function assessment from being integrated into clinical practice, partly because the technical comprehension of these methods requires extensive training and expensive equipment, which has prompted a search for techniques that are inherently faster and easier to perform.
In the method outlined in this study, the PTG and sudomotor tests using tactile electrodes can be performed simultaneously, limiting the total time of the exam to 2 minutes. Additionally, these methods do not require operator intervention or invasive techniques, reducing overall patient discomfort.
Test results are immediately available from the software, including the normal range of the associated test results.
Although, the PTG spectral analysis markers provide only “surrogate” measures of endothelial and autonomic nervous systems, they are fast, comfortable, cost-effective, easy to interpret, and highly sensitive and specific when used to detect CAD. Therefore these methods could be easily integrated in daily practice and be very useful for the early detection of asymptomatic patients at high risk of arterial disease, autonomic neuropathy, and for CAD treatment follow-ups.
Finally, the PTG spectral analysis markers can be used alongside known conventional cardiovascular risk markers to strengthen the understanding of a patient’s vascular state.
Limitations
In regard to the sample size of the population included in the present study, we recognize that the results need to be investigated further with more data from a larger cohort in a longitudinal study.
Conclusion
The spectral analysis of the photoplethysmography method is noninvasive, fast, operator-independent, and cost-effective, as only an oximeter and galvanic skin response device are required in order to assess in a single setting the autonomic nervous system and endothelial function. The spectral analysis techniques used on the photoplethysmogram, as outlined in this study, could be useful when used alongside known conventional cardiovascular disease risk markers.
Acknowledgments
The authors want to thank LD Technology for providing the medical systems that were used throughout the study.
Disclosure
The authors report no conflicts of interest in this work.
References
- What is atherosclerosis? [webpage on the Internet]BethesdaNational Heart, Lung, and Blood Institute2011 Available from: https://www.nhlbi.nih.gov/health/health-topics/topics/atherosclerosis/Accessed September 24, 2014
- WidlanskyMEGokceNKeaneyJFVitaJAThe clinical implications of endothelial dysfunctionJ Am Coll Cardiol20034271149116014522472
- VitaJAKeaneyJFJrEndothelial function: a barometer for cardiovascular risk?Circulation2002106664064212163419
- DeanfieldJEHalcoxJPRabelinkTJEndothelial function and dysfunction: testing and clinical relevanceCirculation2007115101285129517353456
- VinikAIZieglerDDiabetic cardiovascular autonomic neuropathyCirculation2007115338739717242296
- JordanJTankJStoffelsMInteraction between beta-adrenergic receptor stimulation and nitric oxide release on tissue perfusion and metabolismJ Clin Endocrinol Metab20018662803281011397891
- How accurate is the new AHA/ACC cardiovascular risk calculator? [webpage on the Internet]JAMA Internal Medicine Blog2014 Available from: http://internalmedicineblog.jamainternalmed.com/2014/03/13/how-accurate-is-the-new-ahaacc-cardiovascular-risk-calculator/Accessed September 24, 2014
- SchiffrinELA critical review of the role of endothelial factors in the pathogenesis of hypertensionJ Cardiovasc Pharmacol200138Suppl 2S3S611811373
- BonettiPOLermanLOLermanAEndothelial dysfunction: a marker of atherosclerotic riskArterioscler Thromb Vasc Biol200323216817512588755
- AndersonTJGerhardMDMeredithITSystemic nature of endothelial dysfunction in atherosclerosisAm J Cardiol199575671B74B7801869
- BehrendtDGanzPEndothelial function: from vascular biology to clinical applicationsAm J Cardiol20029010C40L48L
- KinlaySLibbyPGanzPEndothelial function and coronary artery diseaseCurr Opin Lipidol200112438338911507322
- CorrettiMCAndersonTJBenjaminEJInternational Brachial Artery Reactivity Task ForceGuidelines for the ultrasound assessment of endothelial-dependent flow-mediated vasodilation of the brachial artery: a report of the International Brachial Artery Reactivity Task ForceJ Am Coll Cardiol200239225726511788217
- BonettiPOPumperGMHiganoSTHolmesDRKuvinJTLermanANoninvasive identification of patients with early coronary atherosclerosis by assessment of digital reactive hyperemiaJ Am Coll Cardiol200444112137214115582310
- MillasseauSCKellyRPRitterJMChowienczykPJDetermination of age-related increases in large artery stiffness by digital pulse contour analysisClin Sci (Lond)2002103437137712241535
- KemplerPTesfayeSChaturvediNEURODIAB IDDM Complications Study GroupAutonomic neuropathy is associated with increased cardiovascular risk factors: the EURODIAB IDDM Complications StudyDiabet Med2002191190090912421426
- DimitropoulosGTahraniAAStevensMJCardiac autonomic neuropathy in patients with diabetes mellitusWorld J Diabetes201451173924567799
- Autonomic neuropathy: Tests and diagnosis [webpage on the Inter-net]Mayo Clinic2014 Available from: http://www.mayoclinic.org/diseases-conditions/autonomic-neuropathy/basics/tests-diagnosis/con-20029053Accessed September 24, 2014
- SpalloneVZieglerDFreemanRToronto Consensus Panel on Diabetic NeuropathyCardiovascular autonomic neuropathy in diabetes: clinical impact, assessment, diagnosis, and managementDiabetes Metab Res Rev Epub6222011
- AllenJPhotoplethysmography and its application in clinical physiological measurementPhysiol Meas200728R1R3917322588
- FooJYLimCSDual-channel photoplethysmography to monitor local changes in vascular stiffnessJ Clin Monit Comput200620322122716775657
- Heart rate variability: standards of measurement, physiological interpretation and clinical use. Task Force of the European Society of Cardiology and the North American Society of Pacing and ElectrophysiologyCirculation1996935104310658598068
- TakazawaKTanakaNFujitaMAssessment of vasoactive agents and vascular aging by the second derivative of photoplethysmogram waveformHypertension19983223653709719069
- NousouNUraseSManiwaYFujimuraKFukuiYClassification of acceleration plethysmogram using self-organizing mapIntelligent Signal Processing and Communications Symposium2006681684