
Abstract
As an engineered nanomaterial, zinc oxide nanoparticles (ZnO NPs) are used frequently in biological applications and can make contact with human skin. Here, we systematically investigated the effects of ZnO NPs on non-tumorigenic human epidermal keratinocytes, which were used as a test model for this in vitro study, at the epigenetic and molecular levels. Our results showed that ZnO NPs induced cell cycle arrest at the G2/M checkpoint before the viability of human epidermal keratinocytes was reduced, which was associated with the chromatin changes at the epigenetic level, including increased methylation of histone H3K9 and decreased acetylation of histone H4K5 accompanied by chromatin condensation at 24 hours. The mRNA expression of the methyltransferase genes G9a and GLP was also increased upon treatment with ZnO NPs, and the acetyltransferase genes GCN5, P300, and CBP were downregulated. Reactive oxygen species were found to be more abundant after treatment with ZnO NPs for 6 hours, and DNA damage was observed at 24 hours. Transmission electron microscopy and flow cytometry confirmed that ZnO NPs were absorbed into the cell when they were added to the medium. Apoptotic human epidermal keratinocytes were detected, and the expression of the proapoptotic genes Bax, Noxa, and Puma increased significantly, while the expression of the antiapoptotic gene Bcl-xl decreased 24 hours after exposure to ZnO NPs. These findings suggest that the ZnO NPs induced cell cycle arrest at G2/M, which was associated with epigenetic changes and accompanied by p53-Bax mitochondrial pathway-mediated apoptosis.
Introduction
Zinc oxide nanoparticles (ZnO NPs) have been widely used in various biological fields, such as in cosmetics, as food additives, and for drug delivery, cell imaging, and cancer therapy.Citation1,Citation2 ZnO NPs are added to sunscreens and facial creams to provide protection against skin damage by ultraviolet-A irradiation.Citation3,Citation4 Their nanoscale size confers to them unique physical, chemical, and biological properties and functionality. An understanding of the behavior and genetic effects of nanoparticles (NPs) in living systems is vital for both the design of functionalized NPs and the application of nanomaterial-based formulation of medicines already in use.
Previous studies have demonstrated that ZnO NPs cause cyto- and genotoxicity in vivo or in vitro, accompanied by inflammation, reduced cell viability, DNA damage, and apoptosis. For example, ZnO NPs induced immunotoxicity in murine macrophages (RAW264.7 cells)Citation5 and mice.Citation6 ZnO NPs also induced cell toxicity and apoptosis in malignant human skin melanoma cells and in respiratory disease patients through the generation of reactive oxygen species (ROS), DNA damage, and p53 signaling pathway activation.Citation7,Citation8 Previous studies have reported that ZnO NPs cause selective toxicity to cancer cells by apoptosis via lipid peroxidationCitation9 and ROS generation.Citation10 Long-term exposure to ZnO NPs has been reported to stimulate the generation of ROS, initiating death processes and affecting the cell cycle distribution.Citation11 ZnO NPs may inhibit cell growth by reducing proliferation.Citation12,Citation13 Reduced proliferation has been linked to cell cycle arrest at various phases.Citation11,Citation14,Citation15 Cell cycle progression is blocked in response to diverse internal and external cues. The tumor suppressor p53 is able to activate G2/M cell cycle checkpoints, DNA repair, and apoptotic responses to maintain genomic stability.Citation16
Instead of studying the reduced viability of cells associated with the cyto- and genotoxicity of ZnO NPs, we focused on the epigenomic response involved in cell cycle arrest at the G2/M checkpoint before the reduction in the viability of cells occurs. Chromatin can be modified through methylation of cytosine in DNA and posttranslational modifications of histones at lysine residues including acetylation, phosphorylation, and methylation, all of which may be involved in regulating gene expression.Citation17 Understanding the specific epigenomic response will provide new insights into gene regulation and its role in cellular growth, differentiation, cell death, diseases, and aging.Citation18 Epigenomic mechanisms have emerged as a new mediator of the interaction between the environment and chromatin.Citation19 Pan et al reported that Gd metallofullerenol nanomaterials inhibit pancreatic cancer metastasis by suppressing the interaction of histone deacetylase 1 with metastasis-associated proteins.Citation20 However, the epigenomic response involved in cell cycle arrest and the subsequent reduction in cell viability induced by ZnO NPs have not been reported.
The particle size and morphology, the functional groups on the NP surface, and the cell type have been shown to determine the subcellular distribution of NPs and are associated with variable toxicity and subsequent cell fate.Citation21 Kodiha et al reported that the different subcellular distributions of different gold nanoparticles (Au NPs) could cause tumor cell death by photothermal ablation, mechanical damage, and an increase in the localized drug concentration.Citation22 Ultrasmall Au NPs used as carriers for nucleus-based gene therapy have size-dependent effects.Citation23 The application of ZnO NPs with a size of 100 nm is generally recognized as safe by the US Food and Drug Administration due to their better biocompatibility than smaller ZnO NPs, and NPs of such size can be delivered into cells and can accumulate in different subcellular organelles.Citation24 HaCaT cells are non-tumorigenic human epidermal keratinocytesCitation25 that are reported to have normal p53 activity, and for this reason, have been widely used to study cell cycle alterations and mechanisms involved in NP-induced toxicity.Citation26,Citation27
Because humans are often directly exposed to ZnO NPs, it seems logical that the skin would act as a major target for ZnO NPs before they gain entry into the body through any of the possible routes. Therefore, the aim of the present study was to assess the epigenomic response involved in cell cycle arrest and to understand the mechanism involved in the subsequent relevant apoptotic routes in HaCaT cells after exposure to ZnO NPs. The present study found that ZnO NPs delayed the cell cycle at the G2/M checkpoint, which was followed by reduced HaCaT cell viability. Increased methylation of histone H3K9, decreased acetylation of his-tone H4K5, and condensed chromatin were observed through Western blotting and immunostaining analysis, accompanied by elevated levels of mRNA of the methyltransferase genes G9a and GLP and reduced expression of the acetyltransferase genes GCN5, P300, and CBP, after treatment with ZnO NPs. The production of ROS was found to be increased, and DNA damage was observed following treatment with ZnO NPs. Transmission electron microscopy (TEM) and flow cytometry confirmed that ZnO NPs were absorbed into the cell. Apoptotic HaCaT cells were studied, and the expression of the proapoptotic genes Bax, Noxa, and Puma was found to increase significantly, whereas the expression of the antiapoptotic gene Bcl-xl was found to decrease, after exposure to ZnO NPs. Our findings suggested that ZnO NPs induced cell cycle arrest at G2/M that was associated with epigenetic changes and accompanied by p53-Bax mitochondrial pathway-mediated apoptosis.
Materials and methods
Characterization of ZnO NPs
ZnO NPs (<100 nm; 99.7% metal basis; specific surface area, 15–25 m2/g) were purchased from Sigma-Aldrich Co. (St Louis, MO, USA). For scanning electron microscopy (SEM) (S3400N; Hitachi, Tokyo, Japan) analysis, the samples were fixed onto metallic studs with double-sided conductive tape and sputtered with gold. SEM micrographs were analyzed with ImageJ (National Institutes of Health, Bethesda, MD, USA) software to obtain the mean size of pristine ZnO NPs. The hydrodynamic size and zeta potential of ZnO NPs in cell culture medium were determined by dynamic light scattering (DLS) (ZetaSizer-HT; Malvern Instruments, Malvern, UK). The samples of ZnO NPs in powder form were suspended in cell culture medium at a concentration of 1 mg/mL and were sonicated in a water bath at 4°C for 30 minutes at 30 W to form a homogeneous suspension. This stock solution of ZnO NPs was diluted to a 10–100 μg/mL working solution for DLS size measurement.
Antibodies
The following antibodies were used for immunostaining and western blotting. Anti-H4K5ac (07-327), anti-H3K9me2 (05-1249), anti-H3 (06-755), and fluorescein-conjugated goat anti-rabbit IgG (12-507) antibodies were obtained from EMD Millipore (Billerica, MA, USA). The anti-γ-H2AX (ab2893) was purchased from Abcam (Cambridge, UK). The alkaline phosphatase-conjugated goat anti-rabbit IgG (A4187) was obtained from Sigma-Aldrich Co.
Cell culture
HaCaT cells (cell line GDC106; China Center for Type Culture Collection, Wuhan University, People’s Republic of China) were seeded in α-minimal essential medium (Hyclone™; Thermo Fisher Scientific, Waltham, MA, USA) supplemented with 10% (v/v) fetal bovine serum (Hyclone™, Thermo Fisher Scientific) and maintained in a humidified environment at 5% CO2 and 37°C.
Cell viability analysis
Cell viability was measured by the MTS (3-(4,5-dimethylthiazol-2-yl)-5-(3-carboxymethoxyphenyl)-2-(4-sulfophenyl)-2H-tetrazolium; inner salt) assay. HaCaT cells were seeded in a 96-well cell culture plate with 1×10⁴ cells in 100 μL medium per well. After 12 hours, the cells were exposed to ZnO NPs at different concentrations (0, 0.5, 5, 10, 15, 20, 50, 100, and 200 μg/mL) and then cultured for 24, 48, and 72 hours, respectively. At the end of exposure, 20 μL MTS solution (Promega Corporation, Fitchburg, WI, USA) was added to every well, and the cells were incubated for 4 hours at 37°C. According to the manufacturer’s protocol, the assay is based on conversion of MTS into the soluble, colored formazan product by mitochondrial dehydrogenase in metabolically active cells. Absorbance was quantified at 490 nm with a microplate spectrophotometer system (ELx800; BioTek, Winooski, VT, USA). The viability of treated groups was expressed as the absorbance ratio of the treated groups to that of the control group: cell viability = (AT − AT1)/(AC − AC1), where AT is the absorbance of the treated group, AT1 is the absorbance of a suspension of ZnO NPs in cell-free medium, AC is the absorbance of the control group, and AC1 is the absorbance of cell-free medium.
Flow cytometry
Cell cycle analysis
The cell cycle distribution was analyzed by flow cytometry. Untreated HaCaT cells or cells treated with ZnO NPs were trypsinized and counted. Then, 5×10⁵ cells were fixed in ethanol at −20°C overnight, resuspended in 1× phosphate-buffered saline (PBS; pH 7.4), and incubated with DNase-free RNase A (Thermo Fisher Scientific) and propidium iodide (PI; Thermo Fisher Scientific) for 1 hour at 37°C in the dark. Fluorescence was measured at 585 nm with a FACSCalibur flow cytometer (Becton Dickinson, San Jose, CA, USA), and 10,000 cells were collected for each analysis. The results of flow cytometry were quantified using the software Summit 4.3 (Beckman Coulter Inc., Brea, CA, USA).
Cellular uptake with ZnO NPs analysis
The uptake of ZnO NPs was examined by analyzing forward scatter versus side scatter (SSC) using flow cytometry as described previously.Citation28 Briefly, cells were incubated with 20 or 50 μg/mL ZnO NPs for 24 hours in the α-minimal essential medium, and then they were suspended in PBS for flow cytometry. Following this, the control and ZnO NPs-exposed cells were analyzed with the flow cytometer, with increases in the SSC due to endocytotic or adsorptive NP interactions. The results of flow cytometry were quantified using the software Summit 4.3 (Beckman Coulter Inc.).
ROS formation analysis
ROS were measured by the fluorescent probe 2′,7′-dichlorodihydrofluorescein diacetate (Sigma-Aldrich Co.). Cells were incubated at 37°C with ZnO NPs for 0, 6, or 24 hours, or 10 days. After treatment, cells were washed with PBS and then incubated at 37°C with 2′,7′-dichlorodihydrofluorescein diacetate in serum-free medium for 30 minutes. The ROS-linked fluorescence, with emission at 525 nm, was quantified by flow cytometry. The results of flow cytometry were quantified using Summit 4.3 (Beckman Coulter Inc.) and FlowJo 7.6 (Tree Star Inc., Ashland, OR, USA).
Apoptosis analysis
Flow cytometry was used to measure Annexin V-fluorescein isothiocyanate (FITC)/PI staining to investigate the mode of cell death induced by ZnO NPs. Annexin V-FITC/PI staining was carried out with an Annexin V-FITC apoptosis detection kit (Beyotime, Haimen, People’s Republic of China). Briefly, the cells were harvested by trypsinization, washed with PBS, and resuspended in binding buffer (10 mM (4-(2-hydroxyethyl)-1-piperazineethanesulfonic acid)/NaOH, pH 7.5, containing 140 mM NaCl and 2.5 mM CaCl2) at a concentration of 106 cells/mL. Annexin V-FITC (5 μL) and PI (10 μL) were added to 195 μL of the cell suspension and incubated for 20 minutes in the dark at room temperature. The cells were immediately analyzed by flow cytometry. Fluorescence emitted by Annexin V-bound FITC and DNA-bound PI was detected as green and red fluorescence, respectively. The results were analyzed by software Summit 4.3 (Beckman Coulter Inc.).
Transmission electron microscopy
Dispersed samples were dropped onto carbon-coated copper grids and viewed under a transmission electron microscope (HIH-8100; Hitachi) at an accelerating voltage of 200 kV. TEM photomicrographs were analyzed by ImageJ (National Institutes of Health) to assess the location of ZnO NPs in HaCaT cells and the mean size of ZnO NP aggregates (n=50).
Scanning electron microscopy
For SEM, cells were grown on glass slides and treated with ZnO NPs for 24 hours. After exposure, cells were fixed with 1% paraformaldehyde, dehydrated in 25%, 50%, 75%, 80%, 90%, and 100% ethanol, lyophilized for 4 hours, coated with gold, and examined with a scanning electron microscope (S3400N; Hitachi). SEM photomicrographs were analyzed by ImageJ (National Institutes of Health) to assess the morphology of the HaCaT cell surface.
Histone extraction
After 24 hours of exposure to ZnO NPs, cells were collected and washed twice with 1X PBS. Cells were lysed in extraction buffer (100 mM Tris–HCl, pH 7.4, containing 4% sodium dodecyl sulfate, 20% glycerinum, 200 mM dithiothreitol, and 1 mM phenylmethanesulfonyl fluoride). The protein concentration was determined using a DC Protein Kit Assay (Bio-Rad Laboratories Inc., Hercules, CA, USA).
Western blotting
Western blotting was carried out as previously described.Citation29 Histone H3 was used as an equal loading control.
Immunostaining
HaCaT cells were plated at a density of 5×10⁴ cells on glass coverslips in a 12-well plate and treated under different conditions. Cells on coverslips were fixed for 20 minutes with fresh 4% paraformaldehyde and then incubated with 0.5% Triton X-100 (Sigma-Aldrich Co.). The cells were incubated with primary antibodies at 4°C overnight, followed by 2 hours of incubation at 37°C with secondary antibodies conjugated to FITC. DNA in the cell nucleus was stained with 0.2 μg/mL 4,6-diamidino-2-phenylindole (Sigma-Aldrich Co.). Images were captured with a fluorescence microscope (BX-60; Olympus, Tokyo, Japan) equipped with the CCD monochrome camera Sensys 1401E and pseudo-colored using the software MetaMorph 7.7.2 (Universal Imaging Corp, Downingtown, PA, USA). The microscope settings and exposure times were kept constant for each respective channel (4,6-diamidino-2-phenylindole or FITC). More than 500 nuclei were analyzed for each treatment group.
Reverse transcription and quantitative real-time PCR
Quantitative real-time polymerase chain reaction (PCR) primers were designed with primer Premier 5 software (PREMIER Biosoft International, Palo Alto, CA, USA) (). β-Actin was used as the reference gene, and all of the PCR products were ~200 bp. Total RNA was isolated by TRIzol reagent (Thermo Fisher Scientific), and 1 μg of total RNA was reverse-transcribed into cDNA with the RevertAid First Strand cDNA Synthesis Kit (Fermentas). Quantitative real-time PCR was carried out using SYBR Green Real-time PCR Master Mix (Toyobo, Tokyo, Japan) on the ABI StepOnePlus real-time PCR system (Thermo Fisher Scientific). The PCR amplification conditions were 95°C for 2 minutes, followed by 40 cycles of 5 seconds at 95°C, 56°C for 15 seconds, and 72°C for 20 seconds. The threshold cycle number for each PCR product was estimated, and the relative expression levels for genes were obtained using the 2−ΔΔCt method with the StepOne software version 2.1 (Thermo Fisher Scientific). Experiments were performed in triplicate biological replicates.
Table 1 Primers used for real-time PCR
Results
ZnO NPs inhibited HaCaT cell growth
To characterize the physical features of ZnO NPs, SEM and DLS were employed to analyze these materials. As seen in , ZnO materials formed rod-shaped particles (), and DLS characterization revealed that the ZnO particles in dispersion had an average size of 132.55±0.45 nm and a zeta potential of −12.6±0.95 mV (). Next, a viability assay was performed to determine the effect of these ZnO NPs on HaCaT cells. The results showed that the viability of HaCaT cells decreased with increasing concentrations of ZnO NPs (). The cell viability at 48 and 72 hours was clearly reduced at concentrations >15 μg/mL from 80% at 20 μg/mL to 60% at 50 μg/mL, while at 24 hours, no obvious difference in cell viability was seen between the 20 and 50 μg/mL treatment groups. Images () of cell culture also showed that the number of cells decreased with increasing ZnO NP concentration after treatment for 48 hours, which was consistent with the results of the MTS assay.
Figure 1 Characterizations of ZnO NPs.
Notes: (A) Scanning electron microscopy image of ZnO NPs; scale bar =500 nm. (B) Hydrodynamic diameter.
Abbreviation: ZnO NPs, zinc oxide nanoparticles.
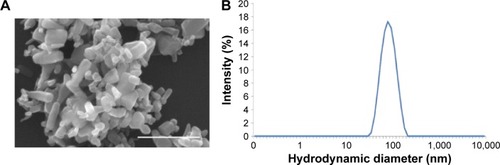
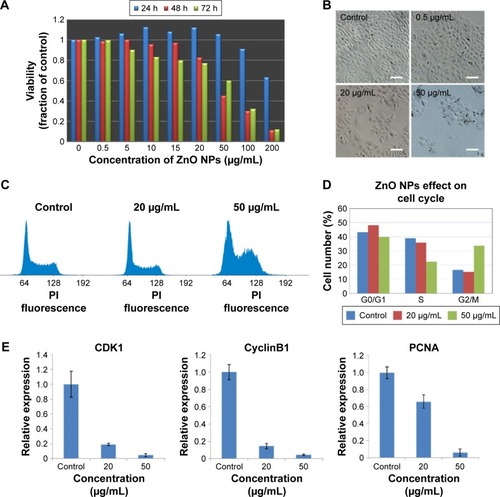
Figure 2 Viability of HaCaT cells and cell cycle alterations in HaCaT cells after exposure to ZnO NPs.
Notes: (A) Viability of HaCaT cells treated with ZnO NPs at different concentrations for 24, 48, and 72 hours. (B) Images of HaCaT cells in cell cultures treated without or with ZnO NPs at 0.5, 20, and 50 μg/mL for 48 hours monitored by an inverted phase-contrast microscope. Scale bars =40 μm. (C) Flow cytometry analysis of cell cycle change. The propidium iodide, a DNA-specific intercalating dye, was used to stain cells. 64: diploid cells with one-chromatid chromatin (G1 phase); 128: diploid cells with two chromatid chromatin (G2/M phase). (D) The quantitative analysis of cells at different phases based on flow cytometry data. The results showed that ZnO NP treatment caused the cell cycle arrest in G2/M checkpoint. (E) The expression of specific marker genes CyclinB1 and CDK1 in G2/M cell cycle arrest was decreased, and the expression of PCNA which was used for estimating cell proliferation was decreased in HaCaT cells after exposure to ZnO NPs for 24 hours as measured by real-time PCR.
Abbreviations: ZnO NPs, zinc oxide nanoparticles; PCR, polymerase chain reaction; PI, propidium iodide; h, hours.
ZnO NP treatment induced cell cycle arrest at the G2/M phase in HaCaT cells
The ZnO NP treatment-induced decrease in cell viability led to us to examine whether cell cycle alterations were induced by ZnO NPs before the decrease in cell viability was observed. We examined the cell cycle distribution of HaCaT cells after 24 hours of exposure to ZnO NPs at 20 and 50 μg/mL by flow cytometry (). Compared with the control, a clearly increased portion of cells treated with 50 μg/mL () were in the G2/M phase. After treatment with 50 μg/mL, 33.55% of cells were in G2/M, in contrast to 16.65% of the control cells. The portion of cells in the S phase at 50 μg/mL was 22.33%, which was clearly less than that of the control (38.83%). The data suggested that ZnO NPs induced cell cycle arrest at the G2/M phase. The expression of specific marker genes CyclinB1 and CDK1 was decreased after treatment with 20 or 50 μg/mL ZnO NPs, indicative of cell cycle arrest at G2/M, and the expression of PCNA, a marker of cell proliferation, also decreased after ZnO NP treatment ().
H4K5ac levels decreased and H3K9me2 levels increased in HaCaT cells after exposure to ZnO NPs
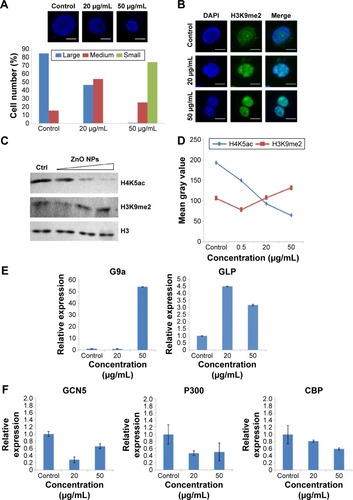
It has been demonstrated that chromatin histone modification is involved in the changes in chromatin structure and cell cycle progression during mitosis.Citation30,Citation31 Thus, histone modification levels were analyzed after treatment with ZnO NPs. Upon treatment with ZnO NPs for 24 hours, chromatin condensation was observed, and the nucleus became smaller (). The number of condensed nuclei increased with increasing concentration of ZnO NPs. The number of moderately condensed nuclei was nearly 3.5-fold higher in treated groups than in the control group; the smallest condensed nuclei only occurred with 50 μg/mL of treatment, but the group treated with 20 μg/mL and the control group both showed no nuclei that had condensed to the smallest size (). ZnO NPs could also induce changes at the epigenetic level in nuclei. Histone acetylation is always related to the decondensed chromatin state and gene activation, whereas deacetylation is a marker of chromatin condensation and gene silencing.Citation17 As expected, Western blot analysis () showed that H4K5ac levels were fourfold lower with increasing ZnO NP concentrations; by contrast, H3K9me2 signals were nearly 1.5-fold higher, although after exposure to ZnO NPs at 0.5 μg/mL, H3K9me2 signals were slightly lower. Immunostaining analysis () showed increased H3K9me2 signals which were mainly distributed in heterochromatin regions after exposure to 20 or 50 μg/mL ZnO NPs. Epigenetic modifications are regulated by enzymes. The data presented by showed that the expression of histone methyltransferase genes was increased after treatment with 20 or 50 μg/mL ZnO NPs. After treatment with 50 μg/mL ZnO NPs, the mRNA level was nearly 50-fold higher for the methyltransferase gene G9a than in control cells and nearly fivefold higher for the GLP gene (). By contrast, the expression of acetyltransferase genes GCN5, P300, and CBP decreased significantly after treatment with ZnO NPs (). The change in expression of these epigenetic enzyme genes might contribute to the alteration of the chromatin modification levels, suggesting that chromatin structure changes mediated by epigenetic modification were involved in the cell cycle arrest.
Figure 3 The alterations of chromatin modifications and the expression of histone methyltransferase genes and acetyltransferase genes in HaCaT cells after exposure to ZnO NPs.
Notes: (A) Nuclear changes induced by ZnO NPs were detected by a fluorescence microscope. HaCaT cells were grown on glass coverslips, untreated (control) or treated for 24 hours with ZnO NPs (20 or 50 μg/mL) and stained with DAPI (blue). Scale bars =10 μm. Percentages of the nucleus in different sizes (large, medium, small) after 24-hour exposure to ZnO NPs at 20 and 50 μg/mL. Number of evaluated cells in each group was 300. (B) The histone H3K9 in nucleus in HaCaT cells undergoes increased methylation after ZnO NPs treatment. HaCaT cells were grown on glass coverslips, untreated (control) or treated for 24 hours with ZnO NPs (20 or 50 μg/mL) and stained with DAPI (blue). The same cells were also stained with the H3K9me2 antibody, followed by anti-rabbit secondary antibody (green). Scale bars =10 μm. (C) A decrease in global H4K5ac and an increase in global H3K9me2 were observed after treatment with 0.5, 20, and 50 μg/mL ZnO NPs compared with the control group. Histone H3 was used as a protein loading control. (D) Histogram showing the mean gray values of the Western blot bands for histone modifications. The experiments were repeated three times using biologically independent samples. (E) ZnO NPs induced the increased expression of methyltransferase genes G9a and GLP; the expression of both G9a and GLP genes was increased at 50 μg/mL, whereas the expression of only GLP gene was increased at 20 μg/mL. (F) The expression of acetyltransferase genes GCN5, P300, and CBP was decreased compared to control. The relative expression value of the control group (untreated) was defined as 1.0. The actin gene was used as an internal control. The data are represented as the mean ± standard error for triplicate quantitative PCRs for each concentration from three independent experiments.
Abbreviations: ZnO NPs, zinc oxide nanoparticles; DAPI, 4,6-diamidino-2-phenylindole; PCR, polymerase chain reaction.
ZnO NPs induced production of ROS and DNA damage in HaCaT cells
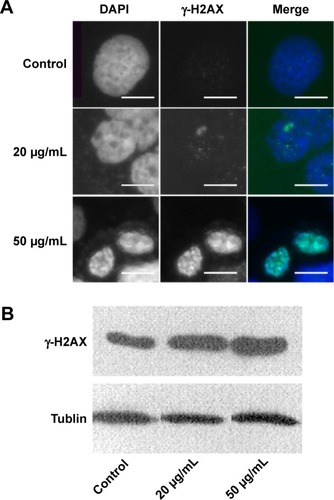
NPs have been reported to be able to induce oxidative stress within cells, which often results in DNA damage.Citation12,Citation13,Citation32 Therefore, ROS formation and DNA damage in treated HaCaT cells were analyzed to investigate their possible involvement in the induction of G2/M arrest. The data presented here showed that the ROS content increased after treatment with 20 μg/mL ZnO NPs for 6 hours () compared with the control (), and then it fell to the control level after 24 hours and remained so until the tenth day (). DNA damage induced cell cycle arrest in the G2/M phase, and the G2/M checkpoint prevented DNA-damaged cells from entering mitosis to allow for the repair of DNA prior to mitosis.Citation33,Citation34 The phosphorylation of the core histone variant H2AX (γ-H2AX), the best marker of DNA damage-induced histone modification,Citation35 serves as a hallmark of DNA double-strand breaks.Citation36,Citation37 Therefore, we measured the distributions of γ-H2AX in the nucleus after exposure to ZnO NPs for 24 hours (). The immunostaining results showed that the γ-H2AX signals were increased significantly in treated samples compared with controls, and the signals after 20 μg/mL treatment were dispersed throughout the whole nucleus, whereas the signals after 50 μg/mL treatment were stronger (). Western blot showed increased γ-H2AX signals after treatment with 20 or 50 μg/mL ZnO NPs compared with the control group, and there was more damage after treatment with 50 μg/mL ZnO NPs than with 20 μg/mL (). The accumulation of γ-H2AX signals indicated that DNA breaks had occurred and that the damage exacerbated with higher concentrations of ZnO NPs, consistent with the report of Toduka et al, who observed increased γ-H2AX signals in cultured (CHO)-K1 cells after exposure to increasing concentrations of ZnO NPs.Citation38
Figure 4 ZnO NPs induced the production of ROS in HaCaT cells.
Notes: Cells grown in a culture plate were treated with nanoparticles at 20 μg/mL for (A) 0, (B) 6, or (C) 24 hours, or (D) 10 days, washed with cold phosphate-buffered saline, and then incubated with DCFH-DA. The samples were measured by flow cytometry. (E) Relative analysis of each sample by software FlowJo 7.6. The x-axis shows the intensity of fluorescence representing the level of ROS, and the y-axis shows the measured cell quantity.
Abbreviations: ROS, reactive oxygen species; DCFH-DA, 2′,7′-dichlorodihydrofluorescein diacetate.
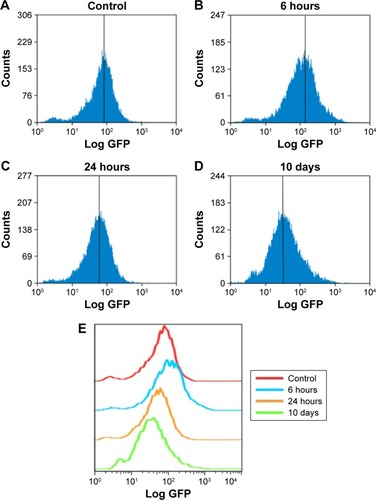
Figure 5 The nucleus in HaCaT cells showed increased γ-H2AX signals after ZnO NPs treatment.
Notes: (A) HaCaT cells were grown on glass coverslips, untreated (control) or treated (20 or 50 μg/mL) for 24 hours with ZnO NPs and stained with DAPI (blue). The same cells were also stained with the γ-H2AX antibody, followed by the anti-rabbit secondary antibody (green). Scale bars =10 μm. (B) An increase in γ-H2AX signals was observed after treatment with 20 and 50 μg/mL ZnO NPs compared with the control group. Tublin was used as a protein-loading control.
Abbreviations: ZnO NPs, zinc oxide nanoparticles; DAPI, 4,6-diamidino-2-phenylindole.
ZnO NPs are absorbed into HaCaT cells
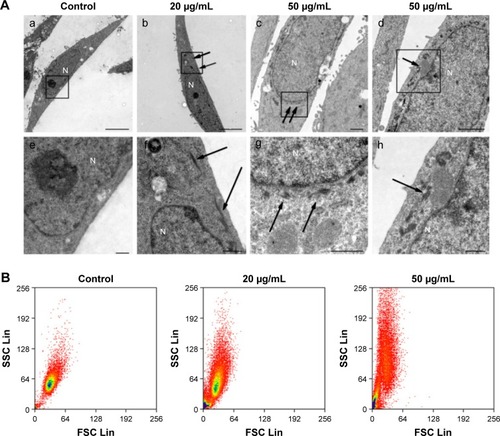
Because NPs appear to exert different cytotoxicities, depending on the cellular uptake, localization, and translocation,Citation21,Citation39 we assessed NP uptake and localization in HaCaT cells using TEM and flow cytometry. TEM images showed that no ZnO NPs were found in the cytoplasm and nucleus of the control cells (), but ZnO NPs were detected as aggregates dispersed inside the cytoplasm instead of as single particles after treatment with 20 μg/mL ZnO NPs (). Surprisingly, after exposure to ZnO NPs at 50 μg/mL for 24 hours, the aggregates were found to have accumulated in the perinuclear region (). We also found that the membrane of mitochondria was squeezed by ZnO NPs () after treatment with 50 μg/mL ZnO NPs for 24 hours. Flow cytometric uptake analysis showed that the nanomaterial affected the SSC, which is related to nanomaterial uptake or changes in the organelles within the cell (). We found that the SSC of cells showed a large increase due to the uptake of a substantial amount of ZnO NPs, and control cells showed a size distribution population with minimal SSC. These results suggested that ZnO NPs were capable of entering the cell and interacting with mitochondria and nuclei, therefore resulting in mitochondrial damage and chromatin changes.
Figure 6 Analysis of nanomaterial uptake by cells.
Notes: (A) TEM images of HaCaT cells treated with ZnO NPs at 20 and 50 μg/mL for 24 hours: (a) No ZnO NP was observed in the control cytoplasm and nucleus. (b) The aggregates of ZnO NPs were observed dispersedly in the cytoplasm (arrows), but not in the nucleus, after cells were treated with ZnO NPs for 24 hours. (c) The nucleus was surrounded by the aggregates of ZnO NPs (arrows), but no ZnO NP was observed in the other area of the cell. (d) The membrane of mitochondria was squeezed by ZnO NPs (arrows). Images e–h are the high-magnification images of the black boxed regions of images a–d. Scale bars: 5 μm in a and b, 1 μm in c and d, and 500 nm in e–h. (B) Flow cytometry analysis of nanoparticle uptake in HaCaT cells exposed to ZnO NPs for 24 hours. The SSC intensity representing granularity of a cell and the FSC representing the size of a cell were analyzed with flow cytometry. Nanomaterial uptake/surface adsorption is reflected by an increase in the SSC of cell populations.
Abbreviations: TEM, transmission electron microscopy; ZnO NPs, zinc oxide nanoparticles; SSC, side scatter; FSC, forward scatter; N, nucleus.
ZnO NPs induced HaCaT cell apoptosis
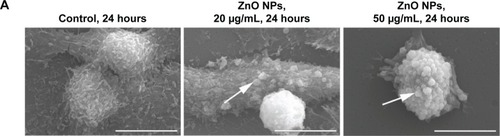
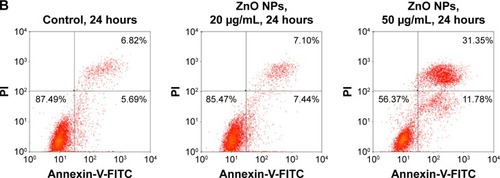
It has been reported that NPs can induce cell apoptosis.Citation21 More specifically, if the damage is irreparable, checkpoint signaling might activate pathways that lead to apoptosis.Citation31,Citation33,Citation40 The finding that ZnO NPs induced cell cycle arrest and DNA repair in treated HaCaT cells prompted us to examine whether apoptosis occurred in these treated cells. The SEM images showed that the untreated control cells remained smooth and flat with a cell surface covered by microvillar structures that were well extended with small lamellapodia (), indicating the fluidity and motility of normal cells. However, the surface of HaCaT cells did not have obvious microvilli, and some membrane blebs (, arrows) were clearly observed in HaCaT cells treated with 20 and 50 μg/mL ZnO NPs. The blebbing of the plasma membrane into smaller membrane-bound apoptotic bodies is a common structural feature of apoptotic cells.Citation41–Citation43 To further confirm apoptosis induced by ZnO NPs, we used Annexin-V-FITC and PI assays to count the ratio of apoptotic cells (). After exposure to ZnO NPs for 24 hours, the numbers of apoptotic cells increased markedly. Furthermore, as the exposure concentration increased from 20 to 50 μg/mL, the total number of apoptotic cells increased from 14.54% to 43.13%. These results suggested that ZnO NPs can induce HaCaT cell apoptosis that was characterized by morphological changes on the cell membrane.
Figure 7 ZnO NPs induced HaCaT cell apoptosis.
Notes: (A) Scanning electron microscopy images of HaCaT cell topography after exposure to ZnO NPs for 24 hours at different concentrations. The normal HaCaT surface was covered by abundant microvillus, whereas after exposure to ZnO NPs, the microvillus was decreased significantly. Compared to normal HaCaT cells, the apoptotic body appeared (white arrows) on the surface of treated cells. Scale bars =10 μm. (B) Flow cytometry results of Annexin-V-FITC and PI assay. HaCaT cells were treated without (control) or with ZnO NPs (20 or 50 μg/mL) for 24 hours. A cell stained by Annexin-V-FITC− and PI− is shown in the lower left area, one stained by Annexin-V-FITC+ and PI− is shown in the lower right area, one stained by Annexin-V-FITC− and PI+ is shown in the upper left area, and one stained by Annexin-V-FITC+ and PI+ is shown in the upper right area.
Abbreviations: ZnO NPs, zinc oxide nanoparticles; FITC, fluorescein isothiocyanate; PI, propidium iodide.
Expression of apoptosis-related genes was upregulated in HaCaT cells after exposure to ZnO NPs
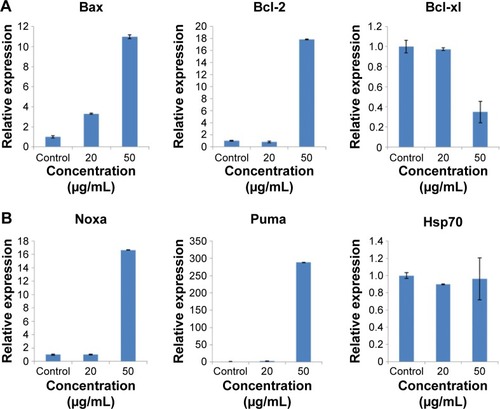
To understand the molecular mechanism of apoptosis induced by ZnO NPs, we measured the expression of several genes involved in triggering or preventing apoptosis (). The results showed that expression of the proapoptotic genes Bax, Noxa, and Puma increased nearly tenfold, 15-fold, and 300-fold, respectively, after treatment with 50 μg/mL ZnO NPs. The mRNA level of the Bax gene was nearly fourfold higher, whereas the mRNA level of the Noxa and Puma genes was unchanged after 20 μg/mL treatment. The expression of the gene Bcl-xl, an inhibitor of apoptosis involved in preventing cell death, was reduced, whereas the mRNA expression of the Bcl-2 (inhibitor of apoptosis) gene was increased and that of the Hsp70 was unchanged. The data presented here indicated that Bax, Noxa, and Puma might be involved in the induction of apoptosis by upregulation within the cell. The expression of the antiapoptotic gene Bcl-2 was activated in the proapoptotic state, but the function of Bcl-2 may be prevented by Puma, which contributes indirectly to the regulation of the Bcl-2 family members Bax and/or Bak by relieving the inhibition imposed by antiapoptotic members. The expression of Bcl family genes relevant to the mitochondrial apoptotic pathway indicated that the apoptosis induced by ZnO NPs may involve mitochondrial damage.Citation44,Citation45
Figure 8 The expression of apoptotic relevant genes in HaCaT cells after exposure to ZnO NPs for 24 hours measured by real-time PCR.
Notes: (A) Mitochondrial apoptotic pathway-relevant Bcl family genes. ZnO NPs induced the increased expression of proapoptotic gene Bax and antiapoptotic gene Bcl-2 and induced the decreased expression of antiapoptotic gene Bcl-xl. (B) The expression of apoptotic genes Noxa and Puma was increased, and that of Hsp70 was unaffected. The relative expression value of the control group (untreated) was defined as 1.0. The actin gene was used as an internal control. The data are represented as the mean ± standard error for triplicate quantitative PCRs for each concentration from three independent experiments.
Abbreviations: ZnO NPs, zinc oxide nanoparticles; PCR, polymerase chain reaction.
Discussion
The rapid growth of nanotechnology has had a significant impact on the quality of human life. Both the design of functionalized NPs and the application of NP-based medicines demand an understanding of the behavior and effects of NPs in living systems. The specific epigenomic response would provide new insights into genetic regulation and its role in cellular growth, differentiation, cell death, diseases, and aging.Citation18 Some studies on the evaluation of the cyto- and genosafety of ZnO NPs have been reported,Citation6,Citation9,Citation46–Citation50 but only few have focused on an epigenomic safety evaluation, even when cyto- and genotoxicity is not apparent. In this study, we examined the effects of ZnO NPs on HaCaT cells as a model for exposed skin at the epigenomic level as well as at the cellular and molecular levels. The results showed that 100 nm ZnO NPs could alter normal cell cycle progression, causing a G2/M arrest that proceeds the loss of viability of HaCaT cells, that was associated with epigenetic changes and accompanied by p53-Bax mitochondrial pathway-mediated apoptosis ().
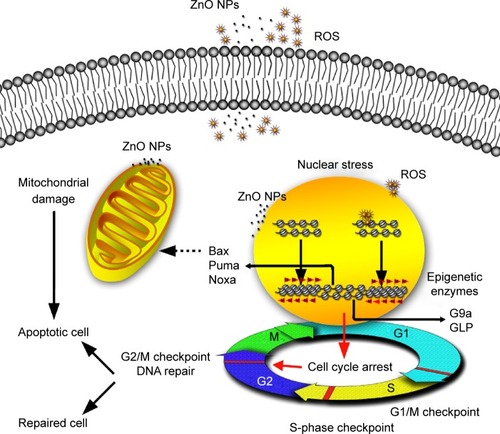
Figure 9 Possible mechanisms involved in ZnO NP-induced changes in HaCaT cells at epigenetic and molecular levels.
Notes: ZnO NPs release ROS extra- and intracellularly. The transient ROS explosion and the ZnO NPs accumulated in perinucleus might result in G2/M cell cycle arrest associated with the nuclear stress (DNA damage and chromatin structure remodeling) before the viability of HaCaT cells was reduced. When the nucleus is subjected to stress, histone lysine residue modifications (H4K5ac and H3K9me2) near the DNA break regions might provide signals for recruitment of DNA repair proteins, resulting in the chromatin structure remodeling such as chromatin condensation and nucleus shrinking. The G2/M checkpoint prevented DNA-damaged cells from entering mitosis to allow for the repair of DNA prior to mitosis; the checkpoint signaling might activate pathways that lead to apoptosis if the damage is irreparable. The upregulation of the proapoptotic Bcl-2 family relevant genes Bax, Noxa, and Puma that are related to mitochondrial apoptotic pathway indicates that the apoptosis induced by ZnO NPs may be involved in mitochondrion damage. The mitochondrion squeezed by ZnO NPs directly may also result in mitochondrion dysfunction and subsequent cell apoptosis.
Abbreviations: ZnO NPs, zinc oxide nanoparticles; ROS, reactive oxygen species.
ZnO NP exposure has previously been reported to result in cellular changes at various phases of the cell cycle.Citation11,Citation14,Citation15 The characteristics of ZnO NPs, the dose, the treatment time, and the specific cell line selected may affect the results obtained.Citation48,Citation51 The data presented here showed that the cell cycle was arrested at the G2/M phase after treatment with 50 μg/mL of 100 nm ZnO NPs for 24 hours (), suggesting that the HaCaT cells exposed to ZnO NPs were unable to go through mitosis, leading to the subsequent decreased cell viability at 48 hours.
Cell cycle arrest is often linked to the DNA damage response and involves changes in histone modification.Citation30,Citation31,Citation34 DNA damage-induced cell cycle arrest at the G2/M phase and the G2/M checkpoint would prevent DNA-damaged cells from entering mitosis to allow for the repair of DNA prior to mitosis.Citation31,Citation33,Citation40,Citation52 Previous evidence suggested that the global chromatin structure is remodeled in response to external cues.Citation35,Citation53,Citation54 Additionally, DNA damage-induced histone modifications and/or preexisting modified histones in the vicinity of the broken chromatin may provide docking sites for DNA damage response proteins.Citation55–Citation57 Our results showed that H4K5ac levels decreased fourfold with increasing ZnO NP concentrations; by contrast, H3K9me2 signals increased nearly 1.5-fold (). The increase in methylated residues in histone H3 and the decrease in acetylated residues in histone H4 near the break regions might provide signals for the recruitment of DNA repair proteins, including chromatin remodeling complexes. The accumulation of γ-H2AX signals indicated that DNA breaks occurred, possibly resulting in remodeling of the chromatin structure, for example, chromatin condensation and nucleus shrinking. G9a and GLP are the major homologous mammalian histone methyltransferases that methylate histone H3 at Lys9Citation58 and cooperatively rather than redundantly mediate H3K9 mono- and di-methylation at euchromatin regions.Citation59 G9a transfers methyl groups to the lysine residues of histone H3, with ten- to 20-fold higher activity than other histone methyltransferases,Citation58 such as Suv39 h1, which contributes to methylation on pericentric heterochromatin.Citation59 The mRNA level increased nearly 50-fold for the methyltransferase gene G9a and nearly fivefold for the methyltransferase gene GLP after exposure to 50 μg/mL ZnO NPs, which suggested that the lysine-terminal tails in histone H3 might be selectively methylated by methyltransferases G9a and GLP, and G9a might play a major role in this methylation state. With increased methylation by G9a and GLP at euchromatin regions, the euchromatin was likely to be transformed into heterochromatin because increased methylation of histone H3 throughout heterochromatin regions was detected (). This ZnO NP-induced hypermethylation of chromatin might control the accessibility of damaged regions of DNA to repair signaling proteins.Citation55,Citation56
The ability of NPs to induce toxicity has been attributed to their increased surface reactivity.Citation60,Citation61 Smaller particles have a higher surface area per unit mass, resulting in production of more ROS in the cellular environment.Citation62,Citation63 ROS generated by NPs can deplete endogenous antioxidants, alter mitochondrial function, and cause oxidative damage to DNA.Citation63 In our study, the ROS content increased after treatment with 20 μg/mL ZnO NPs for 6 hours (), suggesting that the ROS explosion was an early event in response to ZnO NP-mediated stress and occurred before the viability of HaCaT cells decreased. The explosive ROS subsequently caused DNA damage accompanied by histone modification change, which resulted in cell cycle arrest. Our results also showed that the ROS content fell to control levels after 24 hours (), suggesting that ROS content might be eliminated by endogenous antioxidants, but the induced DNA damage still disturbed the cell cycle.
The particle size, particle morphology, functional groups on the NP surface, and the cell type determined the subcellular distribution of NPs and then resulted in variable toxicity and subsequent cell fate.Citation21 Albini et al reported that single-walled carbon nanotubes (SWCNTs) were taken up into acidic vesicles within the endothelial cells, using the neutral red uptake assay, the LysoTracker lysosome test, and dispersive Raman “imaging”.Citation64 Yaron et al reported that 145 nm-long SWCNTs were located in the perinuclear region of HeLa cells, observed by confocal Raman spectroscopy, suggesting that SWCNTs entered cells via endocytosis, disrupted some of the endosomes as they shrank into lysosomes, and were then deposited in or near the endoplasmic reticulum.Citation65 De Berardis et al reported that nuclei with condensed and marginalized chromatin and mitochondria with shrunken, condensed matrices, and swollen cristae were induced by 50–70 nm ZnO NPs in human colon carcinoma cells.Citation66 Our results showed that 100 nm ZnO NP aggregates accumulated in the perinucleus (), accompanied by chromatin condensation. The aggregates accumulated in the perinucleus might interact with the nucleus directly or indirectly.Citation13 Previous research showed that nuclear membranes, nuclear laminae, and nucleolar functions were compromised by small spherical Au NPs or gold nanoflowers in breast cancer cells.Citation67 Dam et al reported that nanoconstructs composed of nucleolin-specific aptamers and gold nanostars were transferred to the perinuclear region and induced major changes to the nuclear phenotype via nuclear envelope invaginations.Citation68 Therefore, the nucleus might be mechanically disturbed by ZnO NP aggregates located in the perinucleus or by the ROS induced by these aggregates. The cell nucleus functions to maintain all processes that occur within the cell, and any disruptions within the nucleus would subsequently affect the cellular chromatin, thereby disturbing the highly regulated cell cycle.Citation69 We also observed that the membrane of mitochondria was squeezed by ZnO NPs (), suggesting that the mitochondria could be mechanically disturbed by ZnO NPs.
The G2/M checkpoint prevents cells from entering mitosis when DNA is damaged to provide these cells an opportunity to repair the damaged DNA before propagating the genetic defects to daughter cells. If the damage is irreparable, checkpoint signaling might activate pathways that lead to apoptosis.Citation40 Our results showed that the cell cycle was arrested at the G2/M phase, in agreement with the result reported in the literature,Citation40 and cell apoptosis subsequently occurred. The tumor suppressor protein p53-related pathway is involved in DNA repair and the apoptotic response to maintain genomic stability.Citation44 The proapoptotic protein Bax is a requisite gateway to mitochondrial dysfunction and death.Citation45 To explore the mechanism of apoptosis associated with G2/M cell cycle arrest, we examined the expression of relevant apoptotic genes. The increased expression of the proapoptotic genes Bax, Noxa, and Puma and the decreased expression of the antiapoptotic gene Bcl-xl suggested that the Bcl-2 family might be involved in the apoptosis through mitochondrial dysfunction.
Conclusion
This study provides new insights into genetic regulation and its role in cellular growth and death after exposure to ZnO NPs, offers an epigenomic safety evaluation even when cyto-and genotoxicity are not apparent, and gives support to the future use of ZnO NPs for cellular therapeutic applications. Further investigations into the long-term effects of NPs on epigenetic modifications and subsequent recovery assays after NP exposure will be required.
Disclosure
The authors report no conflicts of interest in this work.
Acknowledgments
The authors thank Dr Shihan Yan for excellent technical assistance. This work was supported by the National Natural Science Foundation of China (number 31571265).
References
- BraynerRThe toxicological impact of nanoparticlesNano Today2008314855
- NelAXiaTMengHNanomaterial toxicity testing in the 21st century: use of a predictive toxicological approach and high-throughput screeningAcc Chem Res201246360762122676423
- NohynekGDufourERobertsMNanotechnology, cosmetics and the skin: is there a health risk?Skin Pharmacol Physiol200821313614918523411
- NohynekGJLademannJRibaudCRobertsMSGrey goo on the skin? Nanotechnology, cosmetic and sunscreen safetyCrit Rev Toxicol200737325127717453934
- KimCSNguyenHDIgnacioRMImmunotoxicity of zinc oxide nanoparticles with different size and electrostatic chargeInt J Nanomedicine20149Suppl 219520525565837
- Adamcakova-DoddAStebounovaLVKimJSToxicity assessment of zinc oxide nanoparticles using sub-acute and sub-chronic murine inhalation modelsPart Fibre Toxicol2014111524684892
- AlarifiSAliDAlkahtaniSInduction of oxidative stress, DNA damage, and apoptosis in a malignant human skin melanoma cell line after exposure to zinc oxide nanoparticlesInt J Nanomedicine2013898399323493450
- KumarANajafzadehMJacobBKDhawanAAndersonDZinc oxide nanoparticles affect the expression of p53, Ras p21 and JNKs: an ex vivo/in vitro exposure study in respiratory disease patientsMutagenesis201530223724525381309
- PremanathanMKarthikeyanKJeyasubramanianKManivannanGSelective toxicity of ZnO nanoparticles toward Gram-positive bacteria and cancer cells by apoptosis through lipid peroxidationNanomedicine20117218419221034861
- AkhtarMJAhamedMKumarSKhanMMAhmadJAlrokayanSAZinc oxide nanoparticles selectively induce apoptosis in human cancer cells through reactive oxygen speciesInt J Nanomedicine2012784585722393286
- KocbekPTeskačKKreftMEKristlJToxicological aspects of long-term treatment of keratinocytes with ZnO and TiO2 nanoparticlesSmall20106171908191720677183
- SharmaVAndersonDDhawanAZinc oxide nanoparticles induce oxidative DNA damage and ROS-triggered mitochondria mediated apoptosis in human liver cells (HepG2)Apoptosis201217885287022395444
- SharmaVShuklaRKSaxenaNParmarDDasMDhawanADNA damaging potential of zinc oxide nanoparticles in human epidermal cellsToxicol Lett2009185321121819382294
- MahmoudiMAzadmaneshKShokrgozarMAJourneayWSLaurentSEffect of nanoparticles on the cell life cycleChem Rev201111153407343221401073
- ValdiglesiasVCostaCKiliçGNeuronal cytotoxicity and genotoxicity induced by zinc oxide nanoparticlesEnviron Int2013559210023535050
- FarneboMBykovVJWimanKGThe p53 tumor suppressor: a master regulator of diverse cellular processes and therapeutic target in cancerBiochem Biophys Res Commun20103961858920494116
- StrahlBDAllisCDThe language of covalent histone modificationsNature20004036765414510638745
- CallinanPAFeinbergAPThe emerging science of epigenomicsHum Mol Genet200615Suppl 1R95R10116651376
- EstellerMThe necessity of a human epigenome projectCarcinogenesis20062761121112516699174
- PanYWangLKangS-GGd–metallofullerenol nanomaterial suppresses pancreatic cancer metastasis by inhibiting the interaction of histone deacetylase 1 and metastasis-associated protein 1ACS Nano2015976826683626083726
- SohaebuddinSKThevenotPTBakerDEatonJWTangLNanomaterial cytotoxicity is composition, size, and cell type dependentPart Fibre Toxicol2010712220727197
- KodihaMWangYMHutterEMaysingerDStochajUOff to the organelles-killing cancer cells with targeted gold nanoparticlesTheranostics20155435725699096
- HuoSJinSMaXUltrasmall gold nanoparticles as carriers for nucleus-based gene therapy due to size-dependent nuclear entryACS Nano2014865852586224824865
- RasmussenJWMartinezELoukaPWingettDGZinc oxide nanoparticles for selective destruction of tumor cells and potential for drug delivery applicationsExpert Opin Drug Deliv2010791063107720716019
- BoukampPPoppSAltmeyerSSustained nontumorigenic phenotype correlates with a largely stable chromosome content during long-term culture of the human keratinocyte line HaCaTGenes Chromosomes Cancer19971942012149258654
- YangXLiuJHeHSiO2 nanoparticles induce cytotoxicity and protein expression alteration in HaCaT cellsPart Fibre Toxicol201071120180970
- GiusDREzhevskySABecker-HapakMNagaharaHWeiMCDowdySFTransduced p16INK4a peptides inhibit hypophosphorylation of the retinoblastoma protein and cell cycle progression prior to activation of Cdk2 complexes in late G1Cancer Res199959112577258010363976
- SuzukiHToyookaTIbukiYSimple and easy method to evaluate uptake potential of nanoparticles in mammalian cells using a flow cytometric light scatter analysisEnviron Sci Technol20074183018302417533873
- NieswandtBBergmeierWSchulteVRackebrandtKGessnerJEZirngiblHExpression and function of the mouse collagen receptor glycoprotein VI is strictly dependent on its association with the FcRγ chainJ Biol Chem200027531239982400210825177
- OsleyMThe regulation of histone synthesis in the cell cycleAnnu Rev Biochem19916018278611883210
- RiederCLMitosis in vertebrates: the G2/M and M/A transitions and their associated checkpointsChromosome Res201119329130621194009
- SharmaVSinghPPandeyAKDhawanAInduction of oxidative stress, DNA damage and apoptosis in mouse liver after sub-acute oral exposure to zinc oxide nanoparticlesMutat Res20127451849122198329
- RichTAllenRLWyllieAHDefying death after DNA damageNature2000407680577778311048728
- GrothARochaWVerreaultAAlmouzniGChromatin challenges during DNA replication and repairCell2007128472173317320509
- KruhlakMJCelesteADellaireGChanges in chromatin structure and mobility in living cells at sites of DNA double-strand breaksJ Cell Biol2006172682383416520385
- RogakouEPPilchDROrrAHIvanovaVSBonnerWMDNA double-stranded breaks induce histone H2AX phosphorylation on serine 139J Biol Chem199827310585858689488723
- Fernandez-CapetilloOAllisCDNussenzweigAPhosphorylation of histone H2B at DNA double-strand breaksJ Exp Med2004199121671167715197225
- TodukaYToyookaTIbukiYFlow cytometric evaluation of nanoparticles using side-scattered light and reactive oxygen species-mediated fluorescence–correlation with genotoxicityEnviron Sci Technol201246147629763622703531
- ZhaoFZhaoYLiuYChangXChenCZhaoYCellular uptake, intracellular trafficking, and cytotoxicity of nanomaterialsSmall20117101322133721520409
- PearceAKHumphreyTCIntegrating stress-response and cell-cycle checkpoint pathwaysTrends Cell Biol2001111042643311567876
- Casciola-RosenLAAnhaltGRosenAAutoantigens targeted in systemic lupus erythematosus are clustered in two populations of surface structures on apoptotic keratinocytesJ Exp Med19941794131713307511686
- HäckerGThe morphology of apoptosisCell Tissue Res2000301151710928277
- TaylorRCCullenSPMartinSJApoptosis: controlled demolition at the cellular levelNat Rev Mol Cell Biol20089323124118073771
- McCurrachMEConnorTMKnudsonCMKorsmeyerSJLoweSWBax-deficiency promotes drug resistance and oncogenic transformation by attenuating p53-dependent apoptosisProc Natl Acad Sci U S A1997946234523499122197
- WeiMCZongW-XChengEH-YProapoptotic BAX and BAK: a requisite gateway to mitochondrial dysfunction and deathScience2001292551772773011326099
- HuangK-LLeeY-HChenH-ILiaoH-SChiangB-LChengT-JZinc oxide nanoparticles induce eosinophilic airway inflammation in miceJ Hazard Mater201529730431226010476
- ChoW-SDuffinRHowieSProgressive severe lung injury by zinc oxide nanoparticles; the role of Zn2+ dissolution inside lysosomesPart Fibre Toxicol2011812721896169
- HengBCZhaoXTanECEvaluation of the cytotoxic and inflammatory potential of differentially shaped zinc oxide nanoparticlesArch Toxicol201185121517152821656222
- HanleyCLayneJPunnooseAPreferential killing of cancer cells and activated human T cells using ZnO nanoparticlesNanotechnology2008192929510318836572
- KwonJYKoedrithPSeoYRCurrent investigations into the genotoxicity of zinc oxide and silica nanoparticles in mammalian models in vitro and in vivo: carcinogenic/genotoxic potential, relevant mechanisms and biomarkers, artifacts, and limitationsInt J Nanomedicine20149Suppl 227128625565845
- PujaltéIPassagneIBrouillaudBCytotoxicity and oxidative stress induced by different metallic nanoparticles on human kidney cellsPart Fibre Toxicol201181011621235812
- WangYJiPLiuJBroaddusRRXueFZhangWCentrosome-associated regulators of the G2/M checkpoint as targets for cancer therapyMol Cancer200981819216791
- SmerdonMJTlstyTDLiebermanMWDistribution of ultraviolet-induced DNA repair synthesis in nuclease sensitive and resistant regions of human chromatinBiochemistry1978171223772386678515
- SidikKSmerdonMJNucleosome rearrangement in human cells following short patch repair of DNA damaged by bleomycinBiochemistry19902932750175111699600
- HuyenYZgheibODiTullio JrRAMethylated lysine 79 of histone H3 targets 53BP1 to DNA double-strand breaksNature2004432701540641115525939
- SandersSLPortosoMMataJBählerJAllshireRCKouzaridesTMethylation of histone H4 lysine 20 controls recruitment of Crb2 to sites of DNA damageCell2004119560361415550243
- PetersonCLCôtéJCellular machineries for chromosomal DNA repairGenes Dev200418660261615075289
- TachibanaMSugimotoKFukushimaTShinkaiYSet domain-containing protein, G9a, is a novel lysine-preferring mammalian histone methyltransferase with hyperactivity and specific selectivity to lysines 9 and 27 of histone H3J Biol Chem200127627253092531711316813
- TachibanaMUedaJFukudaMHistone methyltransferases G9a and GLP form heteromeric complexes and are both crucial for methylation of euchromatin at H3-K9Genes Dev200519781582615774718
- ColvinVLThe potential environmental impact of engineered nanomaterialsNat Biotechnol200321101166117014520401
- DonaldsonKTranLJimenezLACombustion-derived nanoparticles: a review of their toxicology following inhalation exposurePart Fibre Toxicol2005211016242040
- LiNSioutasCChoAUltrafine particulate pollutants induce oxidative stress and mitochondrial damageEnviron Health Perspect2003111445512676598
- MøllerPJacobsenNRFolkmannJKRole of oxidative damage in toxicity of particulatesFree Radic Res201044114619886744
- AlbiniAMussiVParodiAInteractions of single-wall carbon nanotubes with endothelial cellsNanomedicine20106227728819699323
- YaronPNHoltBDShortPALoscheMIslamMFDahlKNSingle wall carbon nanotubes enter cells by endocytosis and not membrane penetrationJ Nanobiotechnol2011945145
- De BerardisBCivitelliGCondelloMExposure to ZnO nanoparticles induces oxidative stress and cytotoxicity in human colon carcinoma cellsToxicol Appl Pharmacol2010246311612720434478
- KodihaMHutterEBoridySJuhasMMaysingerDStochajUGold nanoparticles induce nuclear damage in breast cancer cells, which is further amplified by hyperthermiaCell Mol Life Sci201471214259427324740795
- DamDHMLeeJHSiscoPNDirect observation of nanoparticle–cancer cell nucleus interactionsACS Nano2012643318332622424173
- KangBMackeyMAEl-SayedMANuclear targeting of gold nanoparticles in cancer cells induces DNA damage, causing cytokinesis arrest and apoptosisJ Am Chem Soc201013251517151920085324