Abstract
Quantum dots (QDs) have shown great development potential in noninvasive imaging and monitoring of cancer cells in vivo because of their unique optical properties. However, the key issue of whether or not QDs-labeled cancer cells affect the proliferation, apoptosis and in vivo tumorigenicity ability has not been reported. The primary issue is if the results obtained from the noninvasive visualization of QDs-labeled tumors are scientific. Here, we applied peptide-linked near-conjugated fluorescent QDs to label human buccal squamous cell carcinoma cell line (BcaCD885). We performed in vivo tumorigenicity ability assays, tumorigenic cells proliferation, and apoptotic capability assays detected by flow cytometry and plate clone formation experiment, and found that peptide-linked near-conjugated fluorescent QDs labeling did not affect the growth, proliferation, apoptosis, and tumorigenicity ability of those cancer cells. Our study provides scientific foundation to support the application of near-infrared fluorescent QDs in noninvasive imaging and monitoring of cancer cells in vivo.
Introduction
The noninvasive, real-time, and long-time imaging and tracking cancerous cells in vivo are of considerable interest in investigation of tumor occurrence, advances, early diagnosis, and treatment. In comparison with conventional organic and fluorescent protein probes, Quantum dots (QDs) have unique optical properties, such as high photoluminescence quantum yield, high intense fluorescence, excellent photostability, and high resistance to photobleaching and photodegradation.Citation1–Citation4 Especially, the recently developed QDs with an infrared emission wavelength between 700 and 900 nm has a powerful ability to penetrate human tissues and at the same time it can avoid the interference of tissue autofluorescence (400–600 nm), which is particularly suitable for noninvasive medical imaging.Citation5–Citation7 Currently, QDs have been used in noninvasive imaging of tumor cells, targeting imaging of tumor neovasculature,Citation8–Citation12 and detection of sentinel lymph nodes in live subjects through labeling tumor cells with QD,Citation13,Citation14 which demonstrate that QDs have satisfactory imaging capability in vivo. The unique optical properties of QDs make them appealing as in vivo fluorophores in investigation of tumor occurrence, advances, early diagnosis, and treatment. Recent work indicates that bioconjugated QDs are nontoxic to cells and have no effect on cells growth and differentiation in vitro.Citation8,Citation15 Some studies used QDs labeled cancer cells for the noninvasive imaging of cell growth and distribution in live subject,Citation8–Citation14 which provides an important basis for the investigation of tumor occurrence, advances, early diagnosis, and treatment. However, the key issue of whether or not QDs-labeled tumor cells affect the proliferation, apoptosis, and in vivo tumorigenicity ability has not been reported. The key issue that needs to be resolved is if the results obtained from the noninvasive visualization of QDs-labeled tumors are scientific and if the results reflect the actual tumor cell growth and invasion in vivo.
Ninety percent of malignant tumor in the oral and maxillofacial regions is squamous cell carcinoma. Buccal squamous cell carcinoma is one of the most common oral squamous cell carcinomas, with only 50% to 60% survival rate at five yearsCitation16,Citation17 and thus investigation on this tumor is of high significance. Recent studies have shown that membrane-penetrating peptide-conjugated QDs can label the cells effectively and rapidly.Citation18–Citation21 In this study, we used peptide-conjugated near-infrared fluorescent QD (Qtracker™ QD800) with a maximal emission of 800 nm to label human buccal squamous cell carcinoma cell line (BcaCD885) through endocytosis. We then observed proliferation, apoptosis, and tumorigenicity ability of the QD800-labeled BcaCD885 cells in vivo. These results provided a theoretical basis to reveal if the visualized tumor cells labeled by peptide-conjugated near-infrared fluorescent QDs reflected the actual cancerous cells growth and distribution in vivo.
Materials and methods
Materials
The human buccal squamous cell carcinoma cell line BcaCD885 was provided by West China College of Stomatology, Sichuan University (Sichuan, China). Qtracker™ 800 Cell Labeling Kit (Invitrogen, Carlsbad, CA, USA) uses a custom peptide to deliver QDs into the cytoplasm of live cells without cell-type specificity. Laser scanning confocal microscope was purchased from Leica (Tcs-sp5; Leica, Wetzlar, Germany). Flow cytometry machine (FACSVantage; BD, Franklin Lakes, NJ, USA) Low-speed refrigerated centrifuge (Z233MK-2) was from HERMLE, (Hosheim, Germany).
Experimental animals
Five female SPF level BALB/c nu/nu substrain nude mice, 5–6 weeks old and 19–20 g of weights, were purchased from the Experimental Animal Center of Chongqing Medical University. They were kept under the conditions of constant temperature and humidity, and sterile bedding, food, and water. They were kept under room temperature.
All experimental procedures were approved by the Laboratory Animal Management Committee of Experimental Animal Research Institute.
Labeling BcaCD885 cells with QDs
Labeling BcaCD885 cells with QD800 was performed according to the manufacturer’s instructions. Briefly, trypsin-digested BcaCD885 cells were transferred into EP tube with 1 × 10⁶ cells and then 0.2 mL of QD800 labeling solution (10 nM) was added. After mixing, the cells were co-cultured with QD800 for 1 h and centrifuged (1,000 × g) for 5 min at 4°C. The supernatant medium was discarded and the cell pellets were washed with PBS for 2 times to remove the uninternalized QDs. The QD800-labeled BcaCD885 cells (BcaCD885/QD800) were cultured continuously for 6 h. And then the labeled cells were dispersed into suspension and the labeling efficiency was detected with flow cytometry. Laser-scanning confocal microscope was used to observe the distribution of QD within BcaCD885 cells. All the experiments were repeated 3 times and the average of the labeling rate was calculated accordingly.
Plate clone formation assay
Cell suspension (5 × 10⁶ cells/mL) of BcaCD885/QD800 used for the following experiments immediately was prepared according to the procedure described above. Suspensions of BcaCD885/QD800 and BcaCD885 were seeded into two 60 mm Petri dishes with 2 × 10² cells in each dish. The cells were dispersed evenly by slightly shaking the Petri dishes and then were incubated at 37°C with 5% of CO2 for 21 d until the visible clones appeared. The medium was discarded and the cells were carefully washed with PBS twice. After being fixed with methanol for 15 min, the cells were stained with Giemsa’s solution for 15 min before washing with tap water and air-drying. The clones with more than 50 cells were counted with an ordinary optical microscope and the clone formation rate was calculated with the following formula: Plate clone formation efficiency = (number of clones/number of cells inoculated) × 100%. All the experiments were repeated 3 times and the average values were reported.
Tumorigenicity experiment
After labeling, 0.1 mL of BcaCD885/QD800 and BcaCD885 cells (2 × 10⁶ cells/mL) was immediately inoculated subcutaneously on the left and right backs of 5 nude mice. Tumorigenicity was monitored 21 d after inoculation, all mice sacrificed by neck-breaking and the tumors were taken out and weighed. The tumor’s maximal long diameter (a) and minimal short diameter (b) were measured, and the volume of tumor was calculated by the equation of V = 0.5 × a × b2. Ten tumors were saved for the following detection of proliferation and apoptosis.
Detection of proliferation and apoptotic capabilities of tumorigenic cells in vivo
Tumor cells from those 10 fresh tumor tissues (BcaCD885/QD800 and BcaCD885 5 specimens each) were suspended, and their proliferation and apoptosis were analyzed by flow cytometry. Brief description of the experimental procedure is as follows: each sample was cleaned by removing the surrounding necrotic tissues, washed 3 times with D-Hanks solution, treated with penicillin (5 × 10⁵ U/L) and streptomycin (100 mg/L) for 20 min. Then each tumor was cut into 1 mm3 pieces, which were subsequently treated with digestion solution (20 mg/10 mL of collagenase, 10 mg/10 mL of DNase, and 0.002 mg/10 mL of Hyaluronidase) for 40 min and filtered with 200-mesh tantalum net. The filtered solutions were centrifuged at 1000 r/min for 5 min and the pellets were washed 2 times with PBS and then resuspended in RPMI 1640 medium to make 10 cell suspension solutions for flow cytometry analyses.
Detection of tumorigenic cell proliferation with flow cytometry: all cell concentrations were adjusted to 1 × 10⁶/mL and 1 mL of cell suspension solution was centrifuged (1000 r/min, 4°C) for 5 min. The pelleted tumor cells were fixed in 70% ethanol at −20°C and then kept at 4°C overnight. The cells were spin down by centrifuging at 1000 r/min at 4°C for 5 min, followed by 2 times of washing with PBS and 30 min staining with PI solution at 4°C in dark. The following equation was used to calculate the proliferation index of tumor cell (PI): PI = (S + G2/M)/(G0/G1 + S + G2/M) × 100%.
Detection of tumorigenic cell apoptosis with flow cytometry: all cell concentrations were adjusted to 1 × 10⁶/mL and 1 mL of cell suspension solution was centrifuged (1000 r/min, 4°C) for 5 min. The pelleted tumor cells were washed 2 times with 4°C PBS, stained in 200 μL of Annexin V staining solution at room temperature for 15 min then in 1 mL of PI staining solution for 5 min before flow cytometry analysis. The following equation was used to calculate the apoptosis index of tumor cell (AI): AI = (number of apoptotic cells/total number of measured cells) × 100%.
All the experiments were repeated for 3 times and the average values were reported.
Statistical evaluations
A Student’s t-test was applied to analyze the data measured. All values are presented as means ± SD. P < 0.05 was considered statistically significant.
Results
Labeling of BcaCD885 cells with QDs
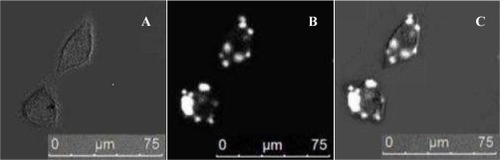
The labeling rate of BcaCD885 cells after 6 h was (94.37 ± 2.38%), as detected by flow cytometry. The average fluorescence intensity was 233.81 ± 7.44. After 6 h, a large amount of QD800 was distributed in the cytoplasm, as detected by a laser confocal microscope ().
Figure 1 Fluorescent images of cells labeled with QD800 after 6 h. Bright-field (A). QD800 fluorescence image (B). Overlay image (C).
Effect of QDs on the BcaCD885 cell proliferation and apoptosis
The average proliferation indexes of BcaCD885/QD800 and BcaCD885 cells were (51.38 ± 2.75%) and (52.06 ± 2.47%), respectively, which are not significantly different from each other (P > 0.05), and their average apoptosis indexes were (10.22 ± 0.81%) and (9.53 ± 0.74%), respectively, which are also not significantly different from each other (P > 0.05). These results indicate that QD800 labeling does not change the proliferation and apoptosis of BcaCD885 cells.
Effect of QDs on the BcaCD885 cell clone formation
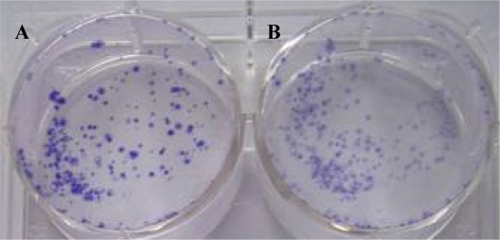
The clone formation efficiency BcaCD885/QD800 and BcaCD885 cells were (64.7 ± 5.4%) and (66.2 ± 3.1%), respectively, after 21 d of culture (). Statistical analysis showed that there was no significant difference between the clonal formation rate of QDs-labeled cells and that of unlabeled cells, indicating that labeling of BcaCD885 cells with QD800 does not affect the clone forming ability.
Figure 2 The clone formation efficiency of BcaCD885 cell treated or untreated with QD800 after 21 d of culture. Panel A indicated the unlabeled BcaCD885 cells and panel B indicated BcaCD885 labeled with QD800.
Effect of QDs on the BcaCD885 cell tumorigenicity in vivo
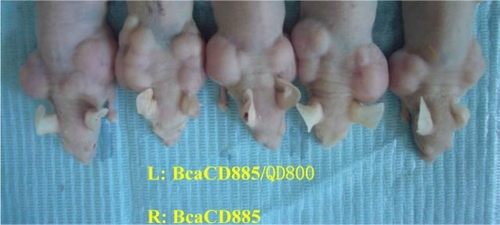
Obvious tumorigenicity was observed in both BcaCD885/QD800 group and BcaCD885 group 21 days after the subcutaneous inoculation. The average weights of tumors of BcaCD885/QD800 group and BcaCD885 group were 1.46 ± 0.19 g and 1.52 ± 0.21 g, respectively, which are not significantly different from each other (P > 0.05). The average sizes of tumors were 2.83 ± 0.74 cm3 and 2.95 ± 0.81 cm3 for BcaCD885/QD800 group and BcaCD885 group, respectively, which are also not significant different from each other (P > 0.05). These results indicate that QD800 labeling does not change BcaCD885 cells tumorigenicity capacities in vivo ().
Figure 3 BcaCD885/QD800 and BcaCD885 cells tumorigenicity in vivo was monitored for 21 d after cells inoculation. The left backs (L) of nude mice are BcaCD885/QD800 group and the rights (R) are BcaCD885 group.
Effect of QDs on the BcaCD885 tumorigenic cells proliferation and apoptosis in vivo
Twenty one days after tumorigenesis, the average proliferation indexes of BcaCD885/QD800 and BcaCD885 tumorigenic cells were (49.57 ± 2.06%) and (50.68 ± 2.24%), respectively, which are not significantly different from each other (P > 0.05), and their average apoptosis indexes were (12.63 ± 0.82%) and (11.79 ± 0.75%), respectively, which are also not significantly different from each other (P > 0.05). These results indicate that QD800 labeling does not change the proliferation and apoptosis capabilities of BcaCD885 tumorigenic cells.
Discussion
In comparison with conventional organic (eg, rhodamine, FITC, Cy3, and Cy5) and fluorescent protein probes, QDs developed due to multidisciplinary cross-cutting development and have unique optical properties, such as high photoluminescence quantum yield, high intense fluorescence, excellent photostability, and high resistance to photobleaching and photodegradation.Citation1–Citation4 The luminescence feature of QDs displays strict size effect: all kinds of spectra from UV to infrared wavelength or from blue to red wavelength can be obtained by changing the size of QDs.Citation8 Therefore, live cell labeled with QDs makes it possible for long-term or simultaneous multicolor observation of multiple cell interactions. Currently, QDs have been used in noninvasive imaging of cancerous cells to reveal the cells growth and distribution in vivo.Citation8–Citation14 However, the issue of whether or not QDs affect the proliferation, apoptosis and tumorigenicity ability of tumor cells has not been reported. The key issue is precisely if the results obtained from the noninvasive visualization of QDs-labeled tumors are scientific to reflect the growth, proliferation, apoptosis, and tumorigenicity ability in vivo. Our study used peptide-conjugated maximum emission wavelength 800 nm near-infrared fluorescent quantum dots for labeling BcaCD885 cancer cells, these experiments proved that quantum dots can label BcaCD885 cells through entering quickly the cells, and the labeling rate of BcaCD885 cells after 6 h was 94.37%. QD800 labeling of BcaCD885 cancer cells does not affect their proliferation, apoptosis, and tumorigenicity ability, and offered a scientific basis for in vivo the noninvasive in situ imaging of cell growth and distribution using near-infrared fluorescent quantum dots.
Conclusion
Peptide-linked near-conjugated fluorescent QDs labeling showed no effects on the growth, proliferation, apoptosis, and tumorigenicity ability of those cancer cells. Our study provides scientific foundation to support the application of peptide-linked near-conjugated fluorescent QDs in noninvasive imaging and monitoring of cancer cells in vivo.
Acknowledgements
The study was supported by the National Natural Science Foundation of China (30872925).
Disclosure
The authors report no conflicts or competing financial interests in this work.
References
- MedintzILUyedaHTGoldmanERMattoussiHQuantum dot bioconjugates for imaging, labelling and sensingNat Mater2005443544615928695
- ChanWCNieSQuantum dot bioconjugates for ultrasensitive nonisotopic detectionScience1998281201620189748158
- DahanMLeviSLuccardiniCRostaingPRiveauBTrillerADiffusion dynamics of glycine receptors revealed by single-quantum dot trackingScience200330244244514564008
- HasegawaUNomuraSMKaulSCHiranoTAkiyoshiKNanogelquantum dot hybrid nanoparticles for live cell imagingBiochem Biophys Res Commun200533191792115882965
- GaoXCuiYLevensonRMChungLWNieSIn vivo cancer targeting and imaging with semiconductor quantum dotsNat Biotechnol20042296997615258594
- MorganNYEnglishSChenWChernomordikVRussoASmithPDReal time in vivo non-invasive optical imaging using near-infrared fluorescent quantum dotsAcademic Radiolog200512313323
- ZimmerJPKimS-WOhnishiSTanakaEFrangioniJVBawendiMGSize series of small indium arsenide-zinc selenide core-shell nanocrystals and their application to in vivo imagingJ Am Chem Soc20061282526252716492023
- MichaletXPinaudFFBentolilaLATsayJMDooseSLiJJQuantum dots for live cells, in vivo imaging, and diagnosticsScience200530753854415681376
- TadaHHiguchiHWanatabeTMOhuchiNIn vivo real-time tracking of single quantum dots conjugated with monoclonal anti-HER2 antibody in tumors of miceCancer Res2007671138114417283148
- ShiCZhuYXieZQianWHsiehCLNieSVisualizing human prostate cancer cells in mouse skeleton using bioconjugated near-infrared fluorescent quantum dotsUrology20097444645119428067
- VouraEBJaiswalJKMattoussiHSimonSMTracking metastatic tumor cell extravasation with quantum dot nanocrystalsand fluorescence emission-scanning microscopyNat Med20041099399815334072
- CaiWShinDWChenKGheysensOCaoQWangSXPeptide-labeled near-infrared quantum dots for imaging tumor vasculature in living subjectsNano Letters2006666967616608262
- FrangioniJVKimSWOhnishiSKimSBawendiMGSentinel lymph node mapping with type ii quantum dotsMethods Mol Biol200737414715917237537
- SolteszEGKimSLaurenceRGDeGrandAMParungoCPDorDMIntraoperative sentinel lymph node mapping of the lung using near-infrared fluorescent quantum dotsAnn Thorac Surg20057926927715620956
- JaiswalJKMattoussiHMauroJMSimonSMLong-term multiple color imaging of live cells using quantum dot bioconjugatesNat Biotechnol200321475112459736
- KademaniDBellRBScbmidtBLOral and maxillofacial surgeons treating oral cancer: a preliminary report from the American Association of Oral and Maxillofacial Surgeons Task Force on oral cancerJ Oral Maxillofac Surg2008662151215718848117
- ParkinDMBrayFFerlayJPisaniPGlobal cancer statistics, 2002CA Cancer J Clin2005557410815761078
- ChenBLiuQZhangYXuLFangXTransmembrane delivery of the cell-penetrating peptide conjugated semiconductor quantum dotsLangmuir200824118661187118823093
- LinSXieXPatelMRYangYHLiZCaoFQuantum dot imaging for embryonic stem cellsBMC Biotechnol20077677717925032
- XueFLChenJYGuoJWangCCYangWLWangPNEnhancement of intracellular delivery of CdTe quantum dots (QDs) to living cells by Tat conjugationJ Fluoresc20071714915417203403
- SantraSYangHStanleyJTHollowayPHMoudgilBMWalterGRapid and effective labeling of brain tissue using TAT-conjugated CdS:Mn/ZnS quantum dotsChem Commun20052531443146