
Abstract
Autophagy dysfunction is considered as a potential toxic mechanism of nanomaterials. Silica nanoparticles (SiNPs) can induce autophagy, but the specific mechanism involved remains unclear. Therefore, the aim of this study was to confirm the effects of SiNPs on autophagy dysfunction and explore the possible underlying mechanism. In this article, we reported that cell-internalized SiNPs exhibited dose- and time-dependent cytotoxicity in both L-02 and HepG2 cells. Multiple methods verified that SiNPs induced autophagy even at the noncytotoxic level and blocked the autophagic flux at the high-dose level. Notably, SiNPs impaired the lysosomal function through damaging lysosomal ultrastructures, increasing membrane permeability, and downregulating the expression of lysosomal proteases, cathepsin B, as evidenced by transmission electron microscopy, acridine orange staining, quantitative reverse transcription-polymerase chain reaction, and Western blot assays. Collectively, these data concluded that SiNPs inhibited autophagosome degradation via lysosomal impairment in hepatocytes, resulting in autophagy dysfunction. The current study not only discloses a potential mechanism of autophagy dysfunction induced by SiNPs but also provides novel evidence for the study of toxic effect and safety evaluation of SiNPs.
Introduction
Silica nanoparticles (SiNPs) are one of the most widely used engineered nanomaterials. According to the updated information on Nanotechnology Consumer Products Inventory (NCPI) in 2015, SiNPs are listed in the top five nanomaterials of consumer products.Citation1 Owing to their unique physicochemical properties, SiNPs are extensively utilized in biomedical and biotechnological fields such as drug delivery, gene therapy, diagnosis, and imaging.Citation2–Citation4 With the growing application of SiNPs, the potential hazards of SiNPs on environment and human health gain more and more attention.Citation5 The Organization of Economic Cooperation and Development (OECD) has also declared SiNPs as one of the nanomaterials requiring urgent toxicity evaluation.Citation6 Therefore, understanding the detailed toxic mechanisms of SiNPs will be helpful for risk assessment.
SiNPs could be distributed via circulatory system in all organs through various exposure routes,Citation7–Citation9 and liver is considered as the primary target organ for the transportation and biotransformation of SiNPs. It is reported that SiNPs are retained in the liver for up to 60 days by intravenous exposure, and liver fibrosis occurs in rats fed with SiNPs.Citation10,Citation11 Previously, we have demonstrated that SiNPs are rapidly accumulated in livers of mice after intravenous administration causing acute toxicity of lymphocytic infiltration and granuloma formation.Citation12 For in vivo study, we confirmed that SiNPs induced excess reactive oxygen species (ROS) generation and thus caused adverse effects such as DNA damage, cell cycle arrest, apoptosis, autophagy, and cell death.Citation13–Citation16 Oxidative stress is a main regulator of autophagy, while autophagy dysfunction was newly proposed as a potential toxic mechanism of nanomaterials.Citation17 Therefore, exploring the effects of SiNPs on autophagy would contribute to a better understanding of toxic mechanisms involved in nanoparticles.
Autophagy is an evolutionarily conserved dynamic process that protects the cellular homeostasis and adapts to the external adverse environment and stress. Defects in autophagy are related to some pathologies in human beings such as chronic infection, neurodegenerative disease, and cancer.Citation18 Nanoparticle-induced autophagy gains increasing attention and is considered as a general phenomenon of nanoparticles. Kinds of nanoparticles such as sliver nanoparticles (AgNPs), gold nanoparticles, titanium dioxide, rare earth oxides, nano-sized fullerene, and the nano-sized fullerene derivatives were reported to evoke autophagy.Citation19–Citation23 Meanwhile, some nanoparticles were found to cause autophagy dysfunction. For example, AgNPs were related to defective autophagy and lysosomal dysfunction,Citation19,Citation24 while carbon nanotube could inhibit autophagic flux in human umbilical vein endothelial cells (HUVEC).Citation25 Therefore, Stern et alCitation17 proposed that autophagy dysfunction was an emerging important toxic mechanism of nanoparticles. The complete autophagic process is dependent on normal lysosomal function. Either autophagy overstimulation or inhibition of autophagosome degradation caused by nanoparticles could induce autophagy dysfunction. However, the detailed mechanism of how these nanoparticles affect autophagy function is not clear. Nanoparticles entered cells and sedimented in lysosomes followed by enhancing lysosomal membrane permeability and releasing of acidic hydrolysis enzymes into cytoplasm, which caused lysosomal impairment. Therefore, damaged lysosomes disturbed the fusion of autophagosome and lysosome; meanwhile, the cargos engulfed in autophagosomes would fail degradation, resulting in accumulation of misfolded proteins and impaired organelles. Autophagic cell death might be due to these stimulations.
Emerging evidences revealed that SiNPs induced autophagy in various types of cells,Citation15,Citation26–Citation29 and our previous studies reported that SiNPs upregulated the expression of autophagy markers such as LC3B and p62.Citation9 p62 would be degraded in the complete autophagic process, so the increased p62 expression suggested the blockage of autophagic degradation. Lysosomal impairment is considered as the leading cause of autophagic flux blockage, resulting in autophagy dysfunction.Citation17,Citation30 For instance, lysosome damage induced by aminochrome resulted in autophagy disorder,Citation31 and HBV X protein could inhibit autophagic degradation through destroying the nature of lysosomes.Citation32 The current investigations on SiNPs and autophagy are mostly focused on autophagy detection; however, the mechanisms of autophagosome accumulation and whether the autophagic flux was blocked remain unclear. Therefore, further detailed investigation of the effects of SiNPs on autophagy and the specific molecular mechanisms are urgently needed.
In this study, we confirmed the effects of SiNPs on autophagy function and investigated its underlying mechanism. First, cellular uptake and cytotoxicity of SiNPs were detected in hepatocytes. To evaluate the autophagic process, autophagosome accumulation and autophagic flux were then measured. Lysosomal function was eventually detected to confirm its role in autophagy dysfunction. The current study developed a comprehensive understanding of toxic mechanism associated with autophagy and improved knowledge for the safety evaluation of SiNPs.
Materials and methods
Preparation and characterization of SiNPs
SiNPs were prepared using the Stöber method and characterized as described in our previous studies.Citation33 Briefly, 2.5 mL of tetraethylorthosilicate (TEOS) was added to 50 mL of premixed ethanol solution containing 4 mL of ammonia and 2 mL of water. The reaction system was kept at 40°C for 12 h with continuous stirring at 150 rpm. Then, the mixture was centrifuged at 12,000 rpm for 15 min and was washed three times with deionized water and then dispersed in 50 mL of deionized water. The size and shape of SiNPs were characterized by transmission electron microscopy (TEM; JEOL JEM-2100, Akishima-shi, Japan). The particle size was calculated from a random field of TEM images that showed the general morphology. A total of 500 particles were randomly counted and measured to determine the mean size, standard deviation (SD), and size distribution. Then, the hydrodynamic diameters and zeta potentials of SiNPs were examined by Zetasizer (Nano-ZS90; Malvern Instruments, Malvern, UK). The purity of SiNPs was analyzed by ICP-AES (ARL, Washington, DC, USA) as described previously.Citation27 Endotoxin in SiNP suspensions was assessed by a gel-clot limulus amebocyte lysate (LAL) assay, and the detection limit was <0.125 EU/mL. Before performing each experiment, the SiNP suspensions were sonicated for 5 min in a sonicator (160 W, 20 kHz; Bioruptor UDC-200; Diagenode, Liège, Belgium).
Cell cultures
The normal human hepatic cell line, L-02, was obtained from Nanjing Keygen Biotech cell library (Nanjing, People’s Republic of China). The human hepatocellular carcinoma cell line, HepG2, was obtained from Chinese Academy of Sciences cell library (Shanghai, People’s Republic of China). All cell lines were routinely maintained in Dulbecco’s Modified Eagle’s Medium (DMEM; Gibco, Carlsbad, CA, USA) supplemented with 100 U/mL penicillin, 100 mg/mL streptomycin, and 10% fetal bovine serum (FBS; Gibco) at 37°C in a humidified 5% CO2 incubator. For each experiment, cells in exponential growth stage were seeded in culture plates and allowed to adhere for 24 h. For SiNP treatment, the complete medium was replaced with fresh serum-free medium containing SiNPs. Controls were supplied with an equivalent volume of serum-free DMEM. For Western blot and quantitative reverse transcription-polymerase chain reaction (RT-PCR) assay, the cells were treated with five different concentrations of SiNPs (6.25, 12.5, 25, 50, and 100 μg/mL) for different time points (3, 6, 12, and 24 h). At the indicated time point, the cells were harvested for further analysis.
Antibodies and reagents
Rabbit anti-LC3 (L7543), rabbit anti-p62 (P0067), and mouse anti-actin (A5441) antibodies were purchased from Sigma-Aldrich Co (St Louis, MO, USA). Antibodies against cathepsin B (CTSB; 31718S) were purchased from Cell Signaling Technology (Beverly, MA, USA). Antibodies against cathepsin D (CTSD; ab75852) were purchased from Abcam. Goat anti-mouse IgG IRDye 680RD (925-68070) and goat anti-rabbit IgG IRDye 800CW (926-32211) antibodies were obtained from Li-Cor Biosciences. The fluorescein Isothiocyanate (FITC)-conjugated anti-rabbit secondary antibodies used for immunofluorescence were procured from Beijing ZhongShan Golden Bridge Biotechnology Co. Ltd. 4′,6-Diamidino-2-phenylindole (DAPI) dihydrochloride (D9542) and bafilomycin A1 (BafA1; B1793) were purchased from Sigma-Aldrich.
Cell viability assay
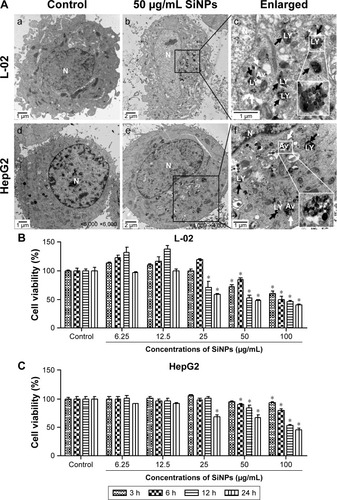
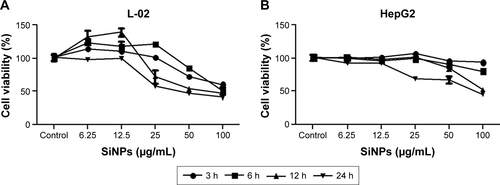
The cytotoxicity of SiNPs in L-02 and HepG2 cells was determined using Cell Counting Kit-8 (CCK-8; CK04-1000; Dojindo, Mashiki-machi, Japan) according to the manufacture’s instruction. Briefly, 1.2×10⁴ L-02 or HepG2 cells were seeded into a 96-well plate in 100 μL of DMEM and incubated at 37°C for 24 h. Then, the cells were treated with various concentrations of SiNPs (6.25, 12.5, 25, 50, and 100 μg/mL) for different time points (3, 6, 12, and 24 h). At the indicated time point, 10 μL of CCK-8 regents was added to each well and further incubated for 2 h, and then the absorbance at 450 nm was detected using a microplate reader (Synergy HT; Bio Tek, Winooski, VT, USA).
TEM
L-02 and HepG2 cells were treated with 50 μg/mL SiNPs for 24 h; then, the cells were harvested and washed three times with phosphate-buffered saline (PBS). The cell pellets were fixed in 2.5% glutaraldehyde (in 0.1 M PBS) at 4°C for 3 h, and washed with 0.1 M PBS. After immersion in 2% agarose gel, the cells were postfixed in 4% osmium tetroxide solution for 1 h. After washing with distilled water, the cells were stained with 0.5% uranyl acetate for 1 h, following dehydration in a graded series of ethanol (30, 60, 70, 90, and 100%), and finally embedded in epoxy resin. The resin was polymerized at 60°C for 48 h. Ultrathin sections were prepared with a ultramicrotome and then stained with 5% aqueous uranyl acetate and 2% aqueous lead citrate. After air drying, sections were observed using TEM (JEOL JEM-2100).
Sodium dodecyl sulfate (SDS)-polyacrylamide gel electrophoresis (PAGE) and Western blot
Cells were harvested and lysed in lysis buffer containing 150 mM NaCl, 25 mM Tris (pH 7.4), 1% NP-40, 0.25% sodium deoxycholate, and 1 mM ethylenediaminetetraacetic acid (EDTA) with a protease inhibitor cocktail (04693132001; Roche). The total protein concentration was determined using a bicinchoninic acid (BCA) protein assay kit (Dingguo, Beijing, China). Equal amounts of total proteins were separated with SDS-PAGE (10%) for p62 detection, 12% gels for CTSB and CTSD detection, and 15% gels for LC3 detection, and then transferred to nitrocellulose membranes (66485; Pall). Membranes were first incubated with different primary antibodies overnight at 4°C and incubated with IRDye 680 or 800 labeled secondary antibodies at room temperature for 2 h. Protein bands on the membrane were scanned using a Li-Cor Odyssey system (Li-Cor Biosciences). At least three independent experiments were performed, and a representative result was shown. For the grayscale analysis, photodensitometric data from protein bands were analyzed and quantified using Quantity One software (Bio-Rad). For statistical analysis, standard error and P-value (Student’s t-test) were calculated from at least three independent experiments using Prism 5 software (GraphPad Software Inc.). A P-value of <0.05 was considered significance.
Immunofluorescence and confocal microscopy
For the analysis of autophagic vesicles, L-02 and HepG2 cells were seeded in confocal dish at a density of 1.5×10⁵ cells/mL. After incubation for 24 h, the cells were treated with various doses of SiNPs (12.5, 25, and 50 μg/mL) for another 24 h. Then, the cells were fixed with 4% paraformaldehyde and permeabilized with PBS containing 0.5% Triton X-100 and 5% bovine serum albumin (BSA) for 30 min. After that, the fixed cells were incubated with rabbit anti-LC3B antibody (1:100 dilution in 5% BSA) at 4°C overnight. Then, the cells were incubated with secondary FITC-conjugated anti-rabbit antibodies at room temperature for 1 h followed by incubation with DAPI for nuclear staining. Images were analyzed using a TCS SP8 laser scanning confocal microscope (LSCM) and software (Leica Microsystems CMS GmbH, Mannheim, Germany).
For the analysis of autophagic flux, L-02 and HepG2 cells were transfected with mTagRFP-mWasabi-LC3B plasmids, and 24 h later the transfected cells were pretreated with 10 nM BafA1 for 2 h and then treated with 50 μg/mL SiNPs for additional 24 h. The distribution of mTagRFP-mWasabi-LC3B was observed using a TCS SP8 LSCM and software (Leica Microsystems CMS GmbH).
Acridine orange (AO) staining
For the analysis of the change of pH values in lysosomal lumens, L-02 and HepG2 cells were seeded in confocal dish at a density of 1.5×10⁵ cells/mL and treated with various doses of SiNPs (12.5, 25, and 50 μg/mL) as described earlier. Cell staining with AO (KGA231; Keygen Biotech, Nanjing, People’s Republic of China) was performed according to the manufacturer’s protocol, adding a final concentration of 5 μg/mL for 10 min (37°C, 5% CO2). After washing with PBS three times, the cells were stained with 20 ng/mL Hoechst33342 (14533; Sigma-Aldrich) at 37°C for 30 min; then, the cells were washed with PBS three times. The AO staining emitted red fluorescence in lysosomal acidic condition of lower pH value, and green fluorescence in cytoplasm of higher pH value. With raising pH, the intensity of red fluorescence decreased. Finally, the images of cells were captured using a TCS SP8 LSCM and its software (Leica Microsystems CMS GmbH). The relative ratio of AO red/green fluorescence was analyzed using Columbus software.
RT-PCR
Total cellular RNA was extracted using RNAiso Plus (9108; Takara) according to the manufacturer’s protocol. One microgram of total RNA was reversely transcribed in a 20 μL volume using PrimeScript™ RT Kit (DRR047A; Takara). All cDNAs were stored at −80°C until further use. To detect the mRNA expression of CTSB and CTSD, 1 μL of cDNA was used for quantitative PCR using SYBR® Premix Ex Taq™ II (RR820Q; Takara). Each experiment was performed in triplicate. Primers for quantitative PCR reactions were as follows: CTSB (human being): 5′-AACACGTCACCGGAGAGATGA-3′, 5′-CCCAGTCAGTGTTCCAGGAGTT-3′; CTSD (human being): 5′-GGCTCTGTGGAGGACCTGATTG-3′, 5′-CGATGCCAATCTCCCCGTAGTA-3′; GAPDH (human being): 5′-TGTTGCCATCAATGACCCCTT-3′, 5′-CTCC ACGACGTACTCAGCG-3′. The PCR reaction was conducted in a real-time PCR machine (Eppendorf, Hamburg, Germany), and the data were analyzed using RQ manager software.
Statistical analysis
All the data are presented as mean ± SD. All experiments were repeated at least three times. One-way analysis of variance (ANOVA) was used to analyze the significance in corresponding experiments. Statistical significance was set at P<0.05.
Results
Characterization of SiNPs
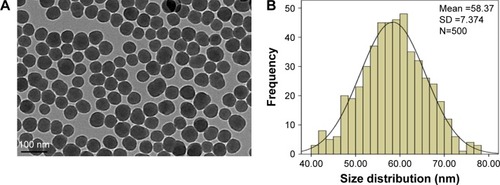
The SiNPs were fully characterized for morphology, size, purity, and toxin contamination. The TEM images showed that all the particles exhibited near-spherical shape () with an average diameter of ~58.4±7.4 nm (). The hydrodynamic sizes and zeta potential were measured at different time points (0, 3, 6, 12, and 24 h) in distilled water and serum-free DMEM (). These data indicated that the prepared SiNPs possessed favorable stability and monodispersity in both stock solution and culture medium. In addition, the purity of SiNPs was >99.9%, and no endotoxin was detected in the SiNP suspensions.
Table 1 The hydrodynamic size and zeta potential of SiNPs in distilled water and DMEM at different time points
Figure 1 Characterization of SiNPs.
Notes: (A) The morphology of SiNPs is characterized by TEM. Scale bar, 100 nm. (B) Size distribution histograms were obtained by ImageJ software. The average diameter was 58.4±7.4 nm.
Abbreviations: SD, standard deviation; SiNPs, silica nanoparticles; TEM, transmission electron microscopy.
Cellular uptake and cytotoxicity of SiNPs
The cellular uptake and the intracellular distribution of SiNPs were observed by TEM assay, as shown in . L-02 and HepG2 cells treated with SiNPs clearly manifested the prominent accumulation of SiNPs within lumens of lysosomes and autophagic vacuoles, compared with the untreated control cells. In addition, some SiNPs were scattered in cytoplasm in nanoparticle-treated cells. The cytotoxicity of SiNPs induced by L-02 and HepG2 cells was measured using CCK-8. As shown in , the results showed that SiNPs decreased cell viability of L-02 and HepG2 cells in a dose- and time-dependent manner (the line plots of cell viability in SiNP-treated L-02 and HepG2 cells are shown in Figure S1).
Figure 2 Cellular uptake of SiNPs and cell viability of L-02 and HepG2 after exposure to SiNPs.
Notes: (A) TEM images of L-02 and HepG2 cells with 50 μg/mL SiNP treatment for 24 h. There were no SiNPs observed in controls and the cellular structures were unchanged (a and d). Electron-dense SiNPs were dispersed in cytoplasm, LYs, and autophagic vacuoles in 50 μg/mL SiNP-treated cells (b and e). The magnification view of the selected area showed LYs (black arrows) and autophagic vacuoles (white arrows) containing aggregated SiNPs. Scale bars: 1 μm (a, c, d, and f); 2 μm (b and e). Magnification: a, 2,500×; b, 1,200×; c, 6,000×; d, 6,000×; e, 4,000×; f, 1,000×. (B and C) Cell viability was analyzed by CCK-8. L-02 and HepG2 cells were treated with different doses of SiNPs (6.25, 12.5, 25, 50, and 100 μg/mL) for indicated time points (3, 6, 12, and 24 h). Data are expressed as mean ± SD. *P<0.05 compared with control.
Abbreviations: Av, autophagic vacuoles; CCK-8, Cell Counting Kit-8; LYs, lysosomes; N, nucleus; SD, standard deviation; SiNPs, silica nanoparticles; TEM, transmission electron microscopy.
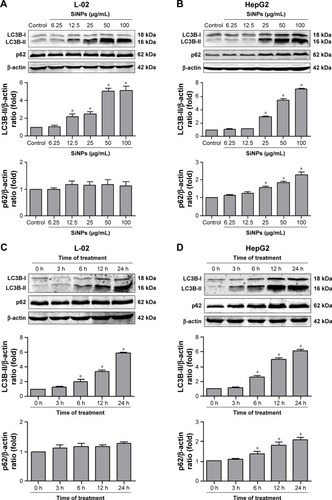
SiNPs induced autophagosome accumulation
Autophagosome accumulation is considered as a general phenotype induced by nanoparticles. Observation of autophagosomes with TEM is the benchmark for autophagy study. As shown in , the subcellular organelles were morphologically normal in untreated control cells with rarely autophagic vacuoles, while a number of double-membrane autophagosomes and single-membrane autolysosomes were obviously observed in SiNP-treated L-02 and HepG2 cells. Moreover, autophagosomes engulfed particle aggregates, damaged mitochondria, and misfolded proteins were also observed. LC3B is a classical autophagic marker; when autophagy was activated, lipid-conjugated LC3B-II accumulated in autophagosome membranes and LC3B-I was distributed through cytoplasm. Then, the puncta formation of endogenous LC3B was examined using LSCM, as shown in , and LC3B protein was dispersed throughout cytoplasm in untreated control cells, whereas it accumulated as specific puncta in SiNP-treated L-02 and HepG2 cells. Compared with untreated cells, a few LC3B puncta were observed in cells treated with low-dose (12.5 μg/mL) of SiNPs, while remarkable LC3B puncta were observed in cells with high-dose (50 μg/mL) of SiNPs treatment. Quantitative analysis revealed that the number of LC3B spots in SiNP-treated cells increased in a dose-dependent manner. For further confirmation, the conversion of LC3B-I to LC3B-II and p62 degradation was measured by Western blot assay. shows that the expression of LC3B-II was increased in a dose- and time-dependent manner, but p62 degradation was not observed in L-02 cells treated with any dose of SiNPs at any time point. However, in HepG2 cells, SiNPs exposure caused a dose- and time-dependent increase in both LC3B-II and p62. Generally, p62 would be degraded in a normal complete autophagic process; the unobserved p62 degradation in L-02 and HepG2 cells implies that SiNPs might block the autophagic flux resulting in autophagy disorder.
Figure 3 SiNPs induced autophagosome accumulation in L-02 and HepG2 cells.
Notes: (A) TEM images showed autophagosome accumulation in L-02 (a, b, c) and HepG2 cells (d, e, f) with SiNP treatment. a,d: untreated control cells; b,e: cells treated with 50 μg/mL SiNP for 24 h; c,f: the enlarged autophagosome or autolysosome. Black arrow, double-membrane autophagosome; white arrow, single-membrane autolysosome. Magnification: a, 8,000×; b, 6,000×; c, 30,000×; d, 12,000×; e, 12,000×; f, 60,000×. (B) After treatment with different doses of SiNPs (12.5, 25, and 50 μg/mL) for 24 h, the cells were fixed and analyzed by indirect immunofluorescence using anti-LC3B. Distribution patterns of cytoplasmic LC3B in control and SiNP-treated cells were visualized with LSCM, and the selected areas were magnified. LC3B (green) and DAPI staining of nuclei (blue) is shown. Quantification represents the number of punctate LC3B per cell in untreated control and SiNP-treated cells. Data are expressed as mean ± SD. *P<0.05 compared with control.
Abbreviations: DAPI, 4′,6-diamidino-2-phenylindole; LSCM, laser scanning confocal microscope; N, nucleus; SD, standard deviation; SiNPs, silica nanoparticles; TEM, transmission electron microscopy.
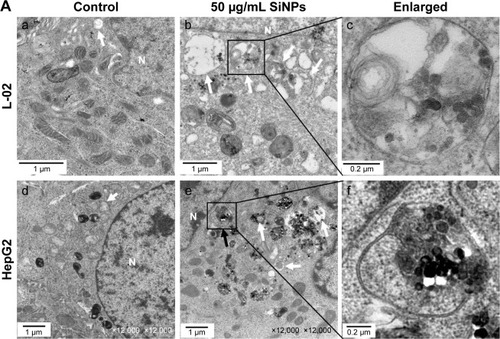
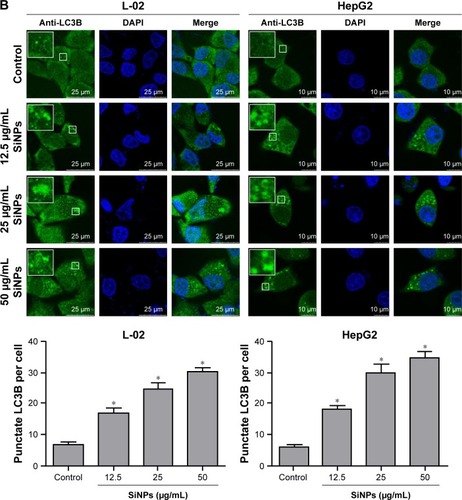
Figure 4 The conversion of LC3B-I to LC3B-II and p62 degradation after SiNP treatment was analyzed using Western blot.
Notes: (A, B) L-02 and HepG2 cells were treated with different concentrations of SiNPs (6.25, 12.5, 25, 50, and 100 μg/mL) for 24 h. (C, D) L-02 and HepG2 cells were treated with 50 μg/mL SiNPs for different time points (3, 6, 12, and 24 h). At the indicated time point, cells were harvested and the expressions of LC3B and p62 were analyzed by Western blot. Blots are representative of the three independent experiments. β-Actin was used as sample-loading control. Densitometric LC3B-II/β-actin and p62/β-actin ratios from at least three independent experiments are shown. The value of control without any treatment was set at 1 for each experiment (*P<0.05).
Abbreviation: SiNPs, silica nanoparticles.
SiNPs inhibited autophagic flux
Autophagic flux is a dynamic process that synthesizes autophagosomes and delivers autophagic substrates to lysosomes. Although a series of studies in our group have reported that SiNPs induced autophagy in various cell lines, the effect of SiNPs on autophagic flux was not investigated yet. To verify the hypothesis that SiNPs inhibited autophagic flux, the control cells and SiNP-treated cells were treated with or without 10 nM BafA1, a specific inhibitor of vacuolar-type H+-ATPase (V-ATPase), which suppresses the fusions between autophagosomes and lysosomes.Citation34 As shown in , with BafA1 treatment, LC3B-II accumulation increased in L-02 cells treated with lower dose of SiNPs (12.5 and 25 μg/mL), while there was no further accumulation of LC3B-II observed in L-02 cells treated with higher dose of SiNPs (50 and 100 μg/mL). Moreover, BafA1 treatment had no effect on p62 expression in L-02 cells with any dose of SiNP treatment. These results indicated that SiNPs might block autophagic flux at higher dose, while have little effect at lower dose. The similar results were obtained in HepG2 cells (). The difference is that p62 expression was increased at lower dose of SiNP exposure but there was no further elevation in higher-dose groups, when compared with the corresponding treated cells in the absence of BafA1.
Figure 5 SiNPs inhibited autophagic flux in L-02 and HepG2 cells.
Notes: (A) L-02 or HepG2 cells were pretreated with (+) or without (−) 10 nM BafA1 for 2 h; then, the cells were treated with different concentrations of SiNPs (12.5, 25, 50, and 100 μg/mL) for 24 h. Cells were harvested and the expressions of LC3B and p62 were analyzed by Western blot. Blots are representative of the three independent experiments. β-Actin was used as sample-loading control. Densitometric LC3B-II/β-actin and p62/β-actin ratios from at least three independent experiments are shown. The value of control without any treatment was set at 1 for each experiment (*P<0.05). (B) L-02 or HepG2 cells were transfected with mTagRFP-mWasabi-LC3B plasmids for 24 h; the cells were pretreated with (+) or without (−) BafA1 (10 nM) for 2 h, and then treated with 50 μg/mL SiNPs for additional 24 h. The distribution of mTagRFP-mWasabi-LC3B was observed using LSCM. Yellow punctate structures indicate autophagosomes; red punctate structures indicate autolysosomes. Scale bars: 10 μm.
Abbreviations: BafA1, bafilomycin A1; DAPI, 4′,6-diamidino-2-phenylindole; LSCM, laser scanning confocal microscope; NS, not significant; SiNPs, silica nanoparticles.
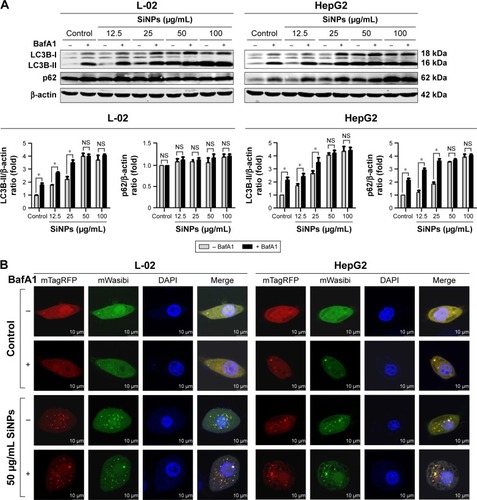
To confirm the blockage of autophagic flux by higher dose of SiNPs, we used an improved tandem fluorescent-tagged LC3B construct (mTagRFP-mWasabi-LC3B) to monitor autophagic flux.Citation35 This assay is based on the principles that the acidic lysosomal environment efficiently quenches green fluorescence but not red fluorescence. Therefore, when autophagosomes fused with lysosomes, green fluorescence from the mTagRFP-mWasabi-LC3B disappeared and red fluorescence could be observed. As shown in , in control cells treated with or without BafA1, the distribution of mTagRFP-mWasabi-LC3B was mainly diffused, as shown by yellow staining due to merged green and red fluorescence. In SiNP-treated cells without BafA1 treatment, the green puncta were not quenched and many separate yellow puncta appeared, indicating that the formation of autophagosomes and autolysosomes was inhibited by SiNPs, while the yellow puncta were not increased in SiNP-treated cells upon treatment with BafA1, indicating that SiNPs inhibited autophagic flux. Overall, all these data suggested that higher dose of SiNP treatment inhibited autophagic flux in both L-02 and HepG2 cells.
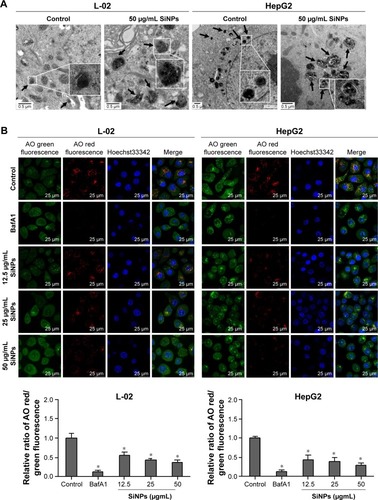
SiNPs blocked autophagic flux via impairing lysosomes
Autophagy is a degradation process depended on lysosomes. Either lysosomes damaged or degradation process disrupted could cause autophagic flux blockage, which might lead to autophagosome accumulation and eventually autophagy dysfunction. To elucidate the mechanism underlying SiNPs inhibited autophagic flux, we assessed the lysosomal function after SiNP exposure. L-02 or HepG2 cells were treated with SiNPs at a concentration of 50 μg/mL for 24 h; then, the lysosome ultrastructures were observed by TEM. As shown in , the internalized SiNPs were prominently accumulated in lysosomes, which caused the swelling of lysosomes even when broken. As these SiNPs were aggregated inside lysosome lumen, the overload of particles might disturb the lysosomal function. The integrity of the lysosomal membrane was assessed using AO staining. AO is a fluorochrome which diffuses into cells and accumulates in lysosomes leading to a change in the fluorescence emission (from cytosolic green to lysosomal red due to concentration-dependent stacking of the probe). The lysosomal membrane destabilization (LMD) can be assessed by measuring the change in intracellular AO fluorescence (loss of lysosomal red and gain of cytoplasmic green). The fluorescence observation was operated with excitation at 485 nm and emission at 530 nm (cytoplasmic green) and 620 nm (lysosomal red). With increasing the dose in SiNP treatment, the lysosomes were overloaded with SiNPs, so the uptake of AO was reduced and the intensity of red fluorescence was decreased. As shown in , the relative ratio of AO red/green fluorescence was decreased with SiNP treatment in a dose-dependent manner, which indicated that the lysosomes were destroyed and lysosomal membrane permeability was increased.
Figure 6 SiNPs blocked autophagic flux through impairing lysosomes.
Notes: (A) TEM images showed that SiNPs were accumulated in lysosomes (black arrows), causing swelling of lysosomes even when broken after SiNP exposure in both L-02 and HepG2 cells. Images of untreated control group showed the smaller intact lysosomes (black arrows). The selected areas were magnified. Scale bars, 0.5 μm. (B) AO staining was performed to evaluate the integrity of the lysosomal membrane in L-02 and HepG2 cells after exposure to SiNPs. Green fluorescence was acquired with excitation at 485 nm and emission at 530 nm; red fluorescence was acquired with excitation at 485 nm and emission at 620 nm using LSCM. Scale bars, 25 μm. The ratio of red and green fluorescence was calculated by Columbus software (*P<0.05).
Abbreviations: AO, acridine orange; BafA1, bafilomycin A1; LSCM, laser scanning confocal microscope; SiNPs, silica nanoparticles; TEM, transmission electron microscopy.
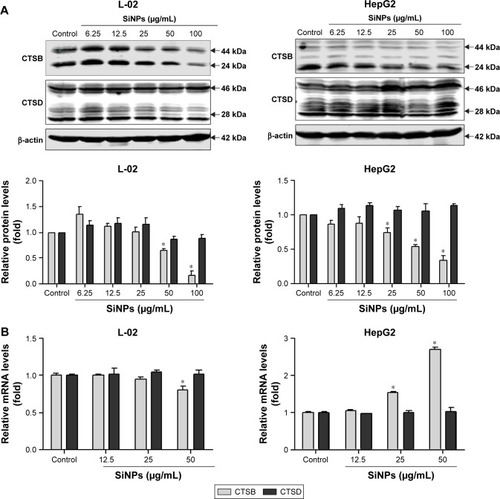
SiNPs downregulated lysosomal cathepsin expression
At the late stage of autophagic flux, the autophagosomes fuse with the lysosomes, the engulfed cargos are then degraded. The autophagic degradation requires the participation of proteases in lysosomes. To further confirm lysosomal dysfunction and explore the underlying mechanism of the autophagic flux blockage, expressions of two major lysosomal proteases, CTSB and CTSD, were detected at both protein and mRNA levels. CTSB and CTSD were synthesized as inactive membrane-bound precursors, and the precursors were further cleaved to produce the active forms in lysosomes. As shown in , the expressions of CTSB were decreased in a dose-dependent manner in both L-02 and HepG2 cells, including both the active and inactive forms. However, the CTSD protein level was not affected by SiNP treatment in either L-02 cells or HepG2 cells. Besides, quantitative RT-PCR assay was performed to examine the mRNA levels of CTSB and CTSD after SiNP exposure. The results showed that only high dose of SiNPs (50 μg/mL) decreased the CTSB mRNA expression in L-02 cells (). Conversely, SiNPs upregulated CTSB mRNA level in a dose-dependent manner in HepG2 cells. The opposite results might attribute to the differences between normal cells and tumor cells. Moreover, the mRNA levels of CTSD were unchanged with or without SiNP treatment in both L-02 and HepG2 cells.
Figure 7 SiNPs downregulated lysosomal cathepsin expression.
Notes: (A) L-02 and HepG2 cells were treated with different concentrations of SiNPs (6.25, 12.5, 25, 50, and 100 μg/mL) for 24 h. Cells were harvested and the expressions of CTSB and CTSD were analyzed by Western blot. Blots are representative of the three independent experiments. β-Actin was used as sample-loading control. Densitometric CTSB/β-actin and CTSD/β-actin ratios from at least three independent experiments are shown. The value of control without any treatment was set at 1 for each experiment (*P<0.05). (B) Relative CTSB and CTSD mRNA levels (compared with GAPDH) were analyzed by quantitative RT-PCR. L-02 and HepG2 cells were treated with SiNPs (12.5, 25, and 50 μg/mL) for 24 h. Cells were harvested, and quantitative RT-PCR was performed. Data are representative of three independent experiments (*P<0.05).
Abbreviations: CTSB, cathepsin B; CTSD, cathepsin D; RT-PCR, reverse transcription-polymerase chain reaction; SiNPs, silica nanoparticles.
Discussion
Autophagy dysfunction is considered as the potential toxic mechanism of nanomaterials.Citation17 Dysregulated autophagy gets involved in multiple human diseases, including cancer, metabolic diseases, neurodegenerative disorders, and viral infections.Citation36–Citation38 Our previous studies have shown that SiNPs could induce autophagy in HUVECs, human bronchial epithelial BEAS-2B, and HepG2 cells, while detailed mechanism is unclear and required to be further studied. In the current study, we deeply investigated the effect of SiNPs on autophagic function and the potential mechanism of autophagosome accumulation. Both normal human hepatic cell line, L-02, and hepatocellular carcinoma cell line, HepG2, which are two common cell lines, were used as cell models in this study. SiNPs were internalized into cells via endocytosis.Citation33,Citation39,Citation40 The TEM observation, as shown in , provided evidence of uptake of SiNPs in L-02 and HepG2 cells, showing that SiNPs were mainly distributed in cytoplasm, lysosomes, and autophagic vacuoles. Then we observed that SiNPs decreased cell viability of L-02 and HepG2 cells in a dose- and time-dependent manner. It might be correlated with the amount of internalization of SiNPs. Despite significant difference of genome organization existing between these two cell lines, there is no obvious difference in cytotoxicity between L-02 and HepG2 cells after SiNP treatment. In addition, both the lowest toxic levels of SiNPs were observed at 25 μg/mL in the two cell lines, which is consistent with our previous results in HUVECs and BEAS-2B cells.Citation26,Citation28
SiNPs could induce autophagy even at noncytotoxic level (), suggesting that autophagy is a more susceptible index for SiNPs, and simple toxicity data are not enough to understand the overall impacts of SiNPs and effects on biological responses. Moreover, SiNPs induced autophagosome accumulation and promoted LC3-I transformation to LC3-II in a dose- and time-dependent manner in both L-02 and HepG2 cells. For cell type-dependent autophagy activation, the dose of SiNP-induced autophagy in L-02 cells is lower than that in HepG2 cells, the former is 12.5 μg/mL and the latter is 25 μg/mL (). The ability to tolerate extreme conditions for cancer cells that might account for higher dose of SiNPs was required to initiate autophagy compared with that in L-02 cells. p62 directly bounds to LC3-II and acts as a cargo receptor for the degradation of ubiquitinated proteins; therefore, the decreased p62 expression was correlated with autophagic activity and autophagic flux. In the current study, p62 was not degraded normally in both L-02 and HepG2 cells, while was increased in a dose- and time-dependent manner in HepG2 cells and unchanged in L-02 cells, which suggested that SiNPs might perturb autophagic flux.
Autophagosome accumulation may result from two opposite scenarios: autophagy activation (autophagosome formation) versus fusion blockage of autophagosomes and lysosomes (inhibition of autophagosome degradation), which implies a defective autophagy. Therefore, it is necessary to measure the autophagic flux; however, nanomaterial-related studies mostly focused on autophagy activation, evidences on whether autophagic flux was affected or not are still lacking. To clarify the effects of SiNPs on autophagic function in L-02 and HepG2 cells, it is essential to conduct autophagy characterization and distinguish autophagy induction and autophagy blockage. As indicated in , LC3-II levels showed no significant difference between samples in the presence and absence of BafA1 with high-dose SiNP treatment in both L-02 and HepG2 cells, indicating that SiNPs absolutely inhibited the autophagic flux at high-dose level, while slightly suppressed the autophagic flux at low-dose level. On the one hand, the internalized particles were perceived as foreign or aberrant by the cells and activated autophagy. On the other hand, a large amount of uptake of SiNPs at high dose might overload the degradation capacity of autophagy and result in the blockage of autophagic degradation. Our results properly confirmed that SiNPs blocked the autophagic flux and caused autophagy dysfunction. In line with our results, gold and fullerene nanoparticles were also reported to impair autophagic flux by the overload of nanoparticles interrupting the fusion of autophagosomes and lysosomes.Citation33,Citation41
Autophagy is a lysosome-dependent degradation process, while autophagic flux blockage prevents degradation. Our previous studies confirmed that SiNPs could activate autophagy through PI3K/Akt/mTOR pathway.Citation26,Citation27 Oxidative stress is widely accepted as the main toxic mechanism induced by SiNPs and considered as a trigger of autophagy induction. ROS could activate MAPK and GSK-3β pathways leading to the inhibition of mTOR pathway, which negatively regulated autophagy.Citation42 Moreover, ROS could directly upregulate LC3B expression facilitating the autophagosome formation. Oxidative stress could also inactivate the protease activity of ATG4, which promoted the lipidation of ATG8 and autophagy induction.Citation42,Citation43 Thus, autophagy initiation is one of the reasons for autophagosome accumulation induced by SiNPs.
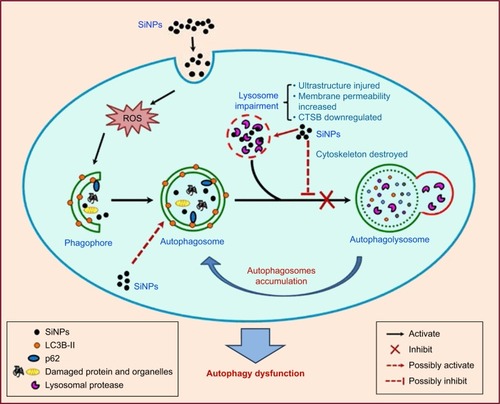
The autophagy blockage was less investigated, and the mechanism of nanoparticle-induced autophagosome accumulation is uncertain. In this article, we deeply explored the possible mechanism of SiNP-induced autophagy dysfunction. We proposed that SiNPs damaged lysosomes resulting in the fusion blockage of autophagosomes and lysosomes and in turn preventing autophagic cargos degradation. The results indicated that the large numbers of SiNPs were deposited in lysosomes causing lysosome ultrastructure damage. Moreover, AO staining likewise indicated that the lysosomal membrane permeability was increased and lysosomes were destroyed.
To further demonstrate that SiNPs impaired lysosomes, we measured the expression of two critical lysosomal proteases, CTSB and CTSD, at both mRNA and protein levels. The results showed that SiNPs solely downregulated the expression of CTSB, while having no obvious effect on CTSD expression. Recently, an autophagy-related study reported that CTSD is not implicated in autophagic activity in pancreatic acinar cells but only plays a role in CTSB and cathepsin L degradation.Citation44 In this study, CTSB mRNA level is upregulated in HepG2 cells in a dose-dependent manner while decreased in L-02 cells. Therefore, the expression of CTSB mRNA is cell type dependent. It is reported that CTSB overexpression is correlated with invasive and metastatic phenotypes in cancers;Citation45 therefore, CTSB transcriptional upregulation might attribute to the carcinoma origin of HepG2 cells. Moreover, increased CTSB expression in B16a melanoma cells was reported due to a transcriptional activator of the CTSB gene.Citation46 Thus, the reason why CTSB mRNA level increased while protein level decreased in HepG2 cells might be that SiNPs activated the CTSB transcription and degraded the protein at posttranscriptional level via the unknown mechanisms. Besides lysosomal impairment, other factors also contributed to the inhibitory effect of autophagosome–lysosome fusion. For example, both preventing of lysosomal trafficking and disruption of the cytoskeleton are principle mechanisms for autophagic flux blockage.Citation17 In addition, the transcription factor EB (TFEB) is a master regulator of lysosome and autophagy gene network, which could be activated by nanoparticle internalization.Citation47,Citation48 As reported, polystyrene nanoparticles could not only upregulate TFEB transcription but also cause lysosomal dysfunction and blockage of autophagic flux.Citation49 Therefore, TFEB might also be involved in SiNP-induced autophagy dysfunction. For further study, other plausible mechanisms of autophagy dysfunction induced by SiNPs are investigated.
Conclusion
We demonstrated that SiNPs were endocytosed in L-02 and HepG2 cells and largely deposited in lysosomes, induced autophagy initiation, blocked the autophagic flux, and caused autophagy dysfunction. Notably, we demonstrated that SiNPs impaired lysosomal function through destroying lysosomal ultrastructures, increasing membrane permeability, and downregulating the expression of lysosomal proteases. Based on these data, we proposed a schematic illustration in to summarize our findings. Collectively, our results uncover a potential mechanism that SiNPs induced autophagy dysfunction through lysosomal impairment and inhibition of autophagosome degradation in hepatocytes. These data would be helpful to explore the biological consequences of autophagy dysfunction induced by SiNPs.
Figure 8 Schematic model of the underlying mechanism of autophagy dysfunction induced by SiNPs.
Notes: SiNPs can be endocytosed into L-02 and HepG2 cells and trigger autophagy through ROS. Moreover, SiNPs were largely deposited in lysosomes and impaired lysosomal function through destroying lysosomal ultrastructures, increasing membrane permeability, and downregulating the expression of lysosomal proteases. Eventually, SiNPs blocked the autophagic flux and caused autophagy dysfunction.
Abbreviations: CTSB, cathepsin B; ROS, reactive oxygen species; SiNPs, silica nanoparticles.
Acknowledgments
This work was supported by the National Natural Science Foundation of China (81402710, 81402709) and Beijing Natural Science Foundation Program and Scientific Research Key Program of Beijing Municipal Commission of Education (KZ201410025022). We thank Professor Jian Lin for generously providing the improved tandem fluorescent-tagged LC3B (mTagRFPmWasabi-LC3B) plasmids.
Disclosure
The authors report no conflicts of interest in this work.
Supplementary material
Figure S1 Cell viability of L-02 and HepG2 after exposure to SiNPs.
Notes: (A, B) Cell viability were analyzed by Cell Counting Kit-8 (CK04-1000; Dojindo, Mashiki-machi, Japan). L-02 and HepG2 cells were treated with different doses of SiNPS (6.25, 12.5, 25, 50, and 100 μg/mL) for an indicated time (3, 6, 12, and 24 h). Data are expressed as mean ± standard deviation.
Abbreviation: SiNPs, silica nanoparticles.
References
- VanceMEKuikenTVejeranoEPNanotechnology in the real world: redeveloping the nanomaterial consumer products inventoryBeilstein J Nanotechnol201561769178026425429
- WangYZhaoQHanNMesoporous silica nanoparticles in drug delivery and biomedical applicationsNanomedicine201511231332725461284
- YangYLiJLipid, protein and poly(NIPAM) coated mesoporous silica nanoparticles for biomedical applicationsAdv Colloid Interface Sci201420715516324268194
- MaiWXMengHMesoporous silica nanoparticles: a multifunctional nano therapeutic systemIntegr Biol (Camb)201351192823042147
- NapierskaDThomassenLCLisonDMartensJAHoetPHThe nanosilica hazard: another variable entityPart Fibre Toxicol2010713921126379
- WangJKangRHuangHHepatitis c virus core protein activates autophagy through EIF2AK3 and ATF6 UPR pathway-mediated MAP1LC3B and ATG12 expressionAutophagy201410576678424589849
- DuanJYuYLiYYuYSunZCardiovascular toxicity evaluation of silica nanoparticles in endothelial cells and zebrafish modelBiomaterials201334235853586223663927
- GuichardYFontanaCChavinierECytotoxic and genotoxic evaluation of different synthetic amorphous silica nanomaterials in the V79 cell lineToxicol Ind Health20163291639165025757481
- HuangHKangRWangJLuoGYangWZhaoZHepatitis C virus inhibits AKT-tuberous sclerosis complex (TSC), the mechanistic target of rapamycin (MTOR) pathway, through endoplasmic reticulum stress to induce autophagyAutophagy20139217519523169238
- ZhuravskiiSYukinaGKulikovaOMast cell accumulation precedes tissue fibrosis induced by intravenously administered amorphous silica nanoparticlesToxicol Mech Methods201626426026927055490
- MaynardADOld materials, new challenges?Nat Nanotechnol20149965865925182032
- YuYLiYWangWAcute toxicity of amorphous silica nanoparticles in intravenously exposed ICR micePLoS One201384e6134623593469
- NiuMZhongHShaoHShape-dependent genotoxicity of mesoporous silica nanoparticles and cellular mechanismsJ Nanosci Nanotechnol20161632313231827455635
- LinYHChenYPLiuTPApproach to deliver two antioxidant enzymes with mesoporous silica nanoparticles into cellsACS Appl Mater Interfaces2016828179441795427353012
- XiCZhouJDuSPengSAutophagy upregulation promotes macrophages to escape mesoporous silica nanoparticle (MSN)-induced NF-kappaB-dependent inflammationInflamm Res201665432534126860538
- SaitoTIchimuraYTaguchiKP62/Sqstm1 promotes malignancy of HCV-positive hepatocellular carcinoma through Nrf2-dependent metabolic reprogrammingNat Commun201671203027345495
- SternSTAdiseshaiahPPCristRMAutophagy and lysosomal dysfunction as emerging mechanisms of nanomaterial toxicityPart Fibre Toxicol201292022697169
- RavikumarBSarkarSDaviesJERegulation of mammalian autophagy in physiology and pathophysiologyPhysiol Rev20109041383143520959619
- MishraARZhengJTangXGoeringPLSilver nanoparticle-induced autophagic-lysosomal disruption and NLRP3-inflammasome activation in HepG2 cells is size-dependentToxicol Sci2016150247348726801583
- MaXWuYJinSGold nanoparticles induce autophagosome accumulation through size-dependent nanoparticle uptake and lysosome impairmentACS Nano20115118629863921974862
- ManNYuLYuSHWenLPRare earth oxide nanocrystals as a new class of autophagy inducersAutophagy20106231031120104026
- ZhaoYHoweJLYuZExposure to titanium dioxide nanoparticles induces autophagy in primary human keratinocytesSmall20139338739223090781
- Johnson-LylesDNPeifleyKLockettSFullerenol cytotoxicity in kidney cells is associated with cytoskeleton disruption, autophagic vacuole accumulation, and mitochondrial dysfunctionToxicol Appl Pharmacol2010248324925820713077
- MaoBHTsaiJCChenCWYanSJWangYJMechanisms of silver nanoparticle-induced toxicity and important role of autophagyNanotoxicology20161081021104027240148
- OrecnaMDe PaoliSHJanouskovaOToxicity of carboxylated carbon nanotubes in endothelial cells is attenuated by stimulation of the autophagic flux with the release of nanomaterial in autophagic vesiclesNanomedicine201410593994824566271
- DuanJYuYYuYSilica nanoparticles induce autophagy and endothelial dysfunction via the PI3K/Akt/mTOR signaling pathwayInt J Nanomedicine201495131514125395850
- YuYDuanJYuYSilica nanoparticles induce autophagy and autophagic cell death in HepG2 cells triggered by reactive oxygen speciesJ Hazard Mater201427017618624583672
- WangBXiXLeiXEnterovirus 71 protease 2Apro targets MAVS to inhibit anti-viral type I interferon responsesPLoS Pathog201393e100323123555247
- Petrache VoicuSNDinuDSimaCSilica nanoparticles induce oxidative stress and autophagy but not apoptosis in the MRC-5 cell lineInt J Mol Sci20151612293982941626690408
- ZhengWWeiMLiSLeWNanomaterial-modulated autophagy: underlying mechanisms and functional consequencesNanomedicine (Lond)201611111417143027193191
- HuenchugualaSMunozPZavalaPGlutathione transferase mu 2 protects glioblastoma cells against aminochrome toxicity by preventing autophagy and lysosome dysfunctionAutophagy201410461863024434817
- LiuBFangMHuYHepatitis B virus X protein inhibits autophagic degradation by impairing lysosomal maturationAutophagy201410341643024401568
- SunLLiYLiuXCytotoxicity and mitochondrial damage caused by silica nanoparticlesToxicol In Vitro20112581619162921723938
- MauvezinCNeufeldTPBafilomycin A1 disrupts autophagic flux by inhibiting both V-ATPase-dependent acidification and Ca-P60A/SERCA-dependent autophagosome-lysosome fusionAutophagy20151181437143826156798
- ZhouCZhongWZhouJMonitoring autophagic flux by an improved tandem fluorescent-tagged LC3 (mTagRFP-mWasabi-LC3) reveals that high-dose rapamycin impairs autophagic flux in cancer cellsAutophagy2012881215122622647982
- NixonRAThe role of autophagy in neurodegenerative diseaseNat Med201319898399723921753
- RubinszteinDCCodognoPLevineBAutophagy modulation as a potential therapeutic target for diverse diseasesNat Rev Drug Discov201211970973022935804
- ChoiAMRyterSWLevineBAutophagy in human health and diseaseN Engl J Med2013368765166223406030
- MaNMaCLiCInfluence of nanoparticle shape, size, and surface functionalization on cellular uptakeJ Nanosci Nanotechnol201313106485649824245105
- FisichellaMDabboueHBhattacharyyaSUptake of functionalized mesoporous silica nanoparticles by human cancer cellsJ Nanosci Nanotechnol20101042314232420355428
- Halamoda KenzaouiBChapuis BernasconiCGuney-AyraSJuillerat-JeanneretLInduction of oxidative stress, lysosome activation and autophagy by nanoparticles in human brain-derived endothelial cellsBiochem J2012441381382122026563
- Scherz-ShouvalRElazarZRegulation of autophagy by ROS: physiology and pathologyTrends Biochem Sci2011361303820728362
- HuangJLamGYBrumellJHAutophagy signaling through reactive oxygen speciesAntioxid Redox Signal201114112215223120874258
- MehannaSSuzukiCShibataMCathepsin D in pancreatic acinar cells is implicated in cathepsin B and L degradation, but not in autophagic activityBiochem Biophys Res Commun2016469340541126682926
- GondiCSRaoJSCathepsin B as a cancer targetExpert Opin Ther Targets201317328129123293836
- QianFChanSJAchkarCSteinerDFFrankfaterATranscriptional regulation of cathepsin B expression in B16 melanomas of varying metastatic potentialBiochem Biophys Res Commun199420214294368037744
- NeibertKDMaysingerDMechanisms of cellular adaptation to quantum dots – the role of glutathione and transcription factor EBNanotoxicology20126324926221495880
- SardielloMPalmieriMdi RonzaAA gene network regulating lysosomal biogenesis and functionScience2009325593947347719556463
- SongWPoppLYangJKumarAGangoliVSSegatoriLThe autophagic response to polystyrene nanoparticles is mediated by transcription factor EB and depends on surface chargeJ Nanobiotechnology2015138726596266