
Abstract
With the increasing application of zinc oxide nanoparticles (ZnO NPs) in biological materials, the neurotoxicity caused by these particles has raised serious concerns. However, the underlying molecular mechanisms of the toxic effect of ZnO NPs on brain cells remain unclear. Mitochondrial damage has been reported to be a factor in the toxicity of ZnO NPs. PINK1/parkin-mediated mitophagy is a newly emerging additional function of autophagy that selectively degrades impaired mitochondria. Here, a PINK1 gene knockdown BV-2 cell model was established to determine whether PINK1/parkin-mediated mitophagy was involved in ZnO NP-induced toxicity in BV-2 cells. The expression of total parkin, mito-parkin, cyto-parkin, and PINK1 both in wild type and PINK1−/− BV-2 cells was evaluated using Western blot analysis after the cells were exposed to 10 μg/mL of 50 nm ZnO NPs for 2, 4, 8, 12, and 24 h. The findings suggested that the downregulation of PINK1 resulted in a significant reduction in the survival rate after ZnO NP exposure compared with that of control cells. ZnO NPs were found to induce the transportation of parkin from the cytoplasm to the mitochondria, implying the involvement of mitophagy in ZnO NP-induced toxicity. The deletion of the PINK1 gene inhibited the recruitment of parkin to the mitochondria, causing failure of the cell to trigger mitophagy. The present study demonstrated that apart from autophagy, PINK1/parkin-mediated mitophagy plays a protective role in ZnO NP-induced cytotoxicity.
Introduction
Zinc oxide nanoparticles (ZnO NPs) are versatile metallic oxide nanomaterials. Due to their excellent antibacterial performance, ZnO NPs are often added as fillers in dental materials, such as dental resin and root canal fillings,Citation1 implant surface coatings,Citation2 toothpaste and mouthwash, and periodontal and bone tissue regeneration nanoscaffolds, which greatly improves the biological properties of these materials. ZnO NPs have also been utilized in sunscreens,Citation3 semiconductors,Citation4 baby powders, shampoos, fabric treatments for UV shielding,Citation5 and nutritional supplements.Citation6
With the increasing biological application of ZnO NPs, the potential adverse effects to the human body caused by ZnO have raised serious concerns. Many studies have confirmed that ZnO NPs can enter the central nervous system (CNS) by breaking through the blood–brain barrier or by neural transportation, leading to neurotoxic effects. In Okada et al’s study,Citation7 the subcutaneous administration of ZnO NPs to pregnant ICR (Institute of Cancer Research) mice prenatally could disrupt the monoaminergic system of the offspring, suggesting the possibility that these particles have detrimental effects on mental health. Male Wistar rats were treated with a single intravenous injection of a suspension of ZnO-NPs in Amara et al’s study.Citation8 The results indicated that plasma and brain zinc concentrations increased after the administration of ZnO-NPs. Han et alCitation9 used the Morris water maze and long-term potentiation to evaluate the spatial learning, memory ability, and long-term synaptic plasticity of 4-week-old rats exposed to ZnO NPs for 8 weeks. The spatial learning and memory ability was attenuated by the alteration of synaptic plasticity in nano-ZnO-treated rats. The neurotoxicity of ZnO NPs is becoming one of the most popular research topics in this field.Citation10,Citation11
NPs have a much larger surface area-to-volume ratio than that of bulk materials, which causes the interactions between NPs and biological molecules such as DNA, proteins, and membranes to be more complicated.Citation12 It is thought that NPs can affect mitochondrial functions in two ways: they cause mitochondrial damage by directly accumulating in the mitochondria, and they disturb the function of the respiratory chain, resulting in reactive oxygen species (ROS) generation and oxidative stress.Citation13,Citation14 Mitochondria are the energy centers of living cells. Lacking the protection provided by histones and having an imperfect DNA repair mechanism, mitochondria are vulnerable to exogenous environmental factors. Once damage occurs, it can cause a transition in the mitochondrial membrane permeability, resulting in a decrease in ATP production followed by a series of subsequent reactions, such as the degradation of the composition of cytoskeletal proteins and lipids as well as an intracellular ion imbalance.Citation15 Since the brain is a high energy-consumption organ, brain cells are rich in mitochondria. An effective clearance system to degrade damaged mitochondria is important for the survival of brain cells after being exposed to various stimuli.Citation16
More recently, an additional function of autophagy has emerged: the selective degradation of functionally damaged mitochondria – mitophagy.Citation17 Mitophagy is a selective autophagy process that clears unwanted or damaged mitochondria and plays an important role in maintaining normal cell function by regulating the number of mitochondria. In this process, damaged mitochondria are enveloped in a bilayer membrane structure to form mitophagy bodies. Then, the outer membrane of the autophagic bodies fuses with the lysosomal membrane or the vacuole membrane and releases the damaged mitochondria into the lysosome or vacuole where they are degraded by hydrolytic enzymes.Citation18 Mitophagy dysfunction is related to a variety of neurodegenerative diseases. However, little is known about the underlying function of mitophagy in ZnO NP-induced cell response in brain cells.Citation19,Citation20
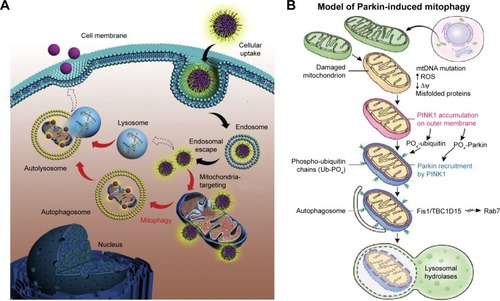
The PINK1/parkin pathway is widely recognized as one of the main molecular mechanisms that mediates the mitophagy process.Citation21 PINK1 (PTEN-induced putative kinase 1) is a protein kinase that is primarily located in the mitochondrial outer membrane. PINK1 is expressed in a variety of cells and is particularly prominent in high energy-consuming organs such as the brain. Parkin is an E3 ubiquitin ligase 8 that is primarily located in the cytoplasm. In damaged mitochondria, PINK1 phosphorylates parkin ubiquitin ligase at S65, which initiates parkin recruitment at the mitochondria, enabling parkin-mediated ubiquitination on other proteins. This process is recognized as PINK1/parkin-mediated mitophagy ().Citation22 The present study investigated the regulatory mechanism of PINK1/parkin pathway-mediated mitophagy in neurotoxicity caused by ZnO NPs.
Figure 1 (A) Schematic illustration of the intracellular trafficking dynamics of mitochondria-targeting nanoparticles. Copyright © 2015. Elsevier Ltd. Reproduced from Zhang Z, Zhou L, Zhou Y, et al. Mitophagy induced by nanoparticle-peptide conjugates enabling an alternative intracellular trafficking route. Biomaterials. 2015;65:56–65.Citation37 (B) Schematic illustration of the PINK1/Parkin pathway. Dysfunctional mitochondria (yellow mitochondrion) fail to import and degrade PINK1, instead stabilizing it on the outer mitochondrial membrane. After PINK1 accumulation, PINK1 phosphorylates ubiquitin and Parkin to activate its E3 ligase activity. Once activated, parkin ubiquitinates substrates on the outer mitochondria for two divergent processes: autophagosome recruitment and the proteasomal degradation of ubiquitinated mitochondrial substrates. Fis1 is a receptor on the outer membrane that binds two proteins TBC1D15/TBC1D17 to govern the developing LC3 isolation membrane to generate the autophagosome around the damaged mitochondria. The autophagosome is then delivered to the lysosome for degradation.Citation38 Copyright © 2015. Elsevier Ltd. Reproduced from Pickrell AM, Youle RJ. The roles of PINK1, parkin, and mitochondrial fidelity in Parkinson’s disease. Neuron. 2015;85(2):257–273.Citation38
Materials and methods
Chemicals and reagents
ZnO NPs, dansylcadaverine (MDC), 2′,7′-dichlorofluorescin diacetate (DCFH-DA), and the Mitochondrial Membrane Potential Kit were purchased from Sigma Chemical (St Louis, MO, USA). Dulbecco’s Modified Eagle’s Medium and α-MEM culture media, the antibiotics–antimycotic solution, and fetal bovine serum were purchased from GIBCO (Grand Island, NY, USA). Anti-LC3B, anti-VDAC1, anti-p53, anti-caspase 9, and anti-GAPDH antibodies were obtained from Cell Signaling Technology (Beverly, MA, USA). Anti-PINK1 (ab23707) and anti-parkin (ab77924) were purchased from Abcam (Cambridge, MA, USA). MitoTracker Red CMXRos and Lipofectamine 2000 (11668-027) were purchased from Invitrogen (Carlsbad, CA, USA). GFP-LC3 was supplied by Prof Tanfeng from Wenzhou Medical University.
NP suspension: preparation and characterization
ZnO NPs were suspended in deionized water at a final stock concentration of 10 mg/mL. The suspension was ultrasonicated for 30 min each time before use. The physical and primary particle size and morphology were determined by analyzing NPs suspended on carbon-coated copper TEM grids using transmission electron microscopy (TEM) (JEOL, Tokyo, Japan), with an accelerating voltage of 200 kV. The average hydrodynamic size, size distribution, and zeta potential of the suspended particles were determined by dynamic light scattering using Zetasizer Nano-ZS equipment (Malvern Instruments Ltd., Malvern, UK). Additionally, X-ray-diffraction (XRD) patterns were obtained at room temperature with an RAX-10 diffractometer (Rigaku,Tokyo, Japan) using Ni-filtered Cu-K α radiation.
Synthesis of parkin siRNAs and GFP-LC3
GFP-LC3 was a kind gift from Professor Tanfeng at Wenzhou Medical University. Three pairs of sense and antisense oligonucleotides were designed and synthesized by Genepharma (Shanghai, People’s Republic of China). The oligo 1 (PINK1 siRNA/68149) sequence was 5′-GAGUAUCUGAUAGGGCAGUTT-3′ (forward) and 5′-ACUGCCCUAUCAGAUACUCTT-3′ (reverse); the oligo 2 (PINK1 siRNA/68150) sequence was 5′-CGCUGUUCCUCGUUAUGAATT-3′ (forward) and 5′-UUCAUAACGAGGAACAGCGTT-3′ (reverse); and the oligo 3 (PINK1 siRNA/68151) sequence was 5′-GAGACCUGAAAUCCGACAATT-3′ (forward) and 5′-UUGUCGGAUUUCAGGUCUCTT-3′ (reverse). The sequence of the negative control was 5′-UUCUCCGAACGUGUCACGUTT-3′ (forward) and 5′-ACGUGACACGUUCGGAGAATT-3′ (reverse). The sequence of the GAPDH positive control was 5′-UGACCUCAACUACAUGGUUTT-3′ (forward) and 5′-AACCAUGUAGUUGAGGUCATT-3′ (reverse). These siRNA sequences were labeled by FAM.
Cell culture and transfection
The immortalized murine microglia cell line, BV-2, purchased from the CBCAS (Cell Bank of the Chinese Academy of Sciences, Shanghai, People’s Republic of China), was maintained in Dulbecco’s Modified Eagle’s Medium containing 10% fetal bovine serum and antibiotics at 37°C in a 5% CO2 humidified incubator. Cells were seeded at a density of 5×10³ cells/well in a 96-well plate, 2×10⁴ cells/well in a 24-well plate, or 3×10⁵ cells/well in a 6-well plate before further experiments were performed. On the second day after seeding, cells were transfected with PINK1 siRNA or GFP-LC3 using Lipofectamine 3000 (Invitrogen) following the manufacturer’s instructions. In our experiment, three pairs of PINK1 siRNA were used to knock down the PINK1 gene in BV-2 cells. The transfection efficiency was detected using a fluorescence microscope. The gene knockdown efficiency was examined using Western blot analysis. The most effective siRNA sequence was chosen for the subsequent experiments.
MTT assay
Both cell growth curves and cell survival rates following treatment with ZnO NPs were evaluated using an MTT assay. Briefly, wild-type BV-2 cells were seeded into a 96-well culture plate at a density of 5×10³ cells/well. The cells were allowed to attach overnight. Then, the cells were exposed to various concentrations of ZnO NPs for 24 h. Cell viability was evaluated using the MTT assay (n=6).
Wild-type BV-2 cells, BV-2 cell clones transfected with an empty vector, and BV-2 cell clones transfected with PINK1 siRNA were seeded into seven 96-well culture plates at a density of 5×10³ cells/well. The cells were allowed to attach overnight and then were incubated for 7 days. Each day, one plate of cells was used to detect cell proliferation by MTT (n=6). The growth curves were calculated to evaluate the cell viability.
Wild-type BV-2 cells, BV-2 cell clones transfected with an empty vector, and BV-2 cell clones transfected with PINK1 siRNA were seeded into seven 96-well culture plates at a density of 5×10³ cells/well. The cells were allowed to attach overnight. Then, three cell clones were exposed to different concentrations of ZnO NPs for 24 h. Cell viability was evaluated using the MTT assay (n=6). Each experiment was repeated three times.
Mitochondrial isolation and Western blot analysis
Protein expression was evaluated using Western blot analysis. Briefly, BV-2 cells were seeded into 100 mm culture plates at a density of 1.5×10⁶ cells/well for mitochondrial isolation and protein extraction. The cells were allowed to attach overnight, and then they were exposed to ZnO NPs for different periods (4, 8, 12, 24 h). The total protein in the cells was extracted using Radio-Immunoprecipitation Assay, and the mitochondrial protein was extracted using the Cell Mitochondria Isolation Kit according to the manufacturer’s instructions. The protein concentration was measured using the BCA Protein Assay Kit (Pierce Biotechnology, Rockford, IL, USA lot# OB183868). Both protein extracts were electrophoresed using sodium dodecyl sulfate-polyacrylamide gel electrophoresis and then electrophoretically transferred to a polyvinylidene fluoride membrane (Millipore, Billerica, MA, USA). The membranes were blocked with 5% nonfat milk at room temperature for 1 h and incubated overnight at 4°C with the following primary antibodies: GAPDH (1:1,000; Cell Signaling Technology), anti-LC3B (1:1,000; Cell Signaling Technology), anti-caspase 9 (1:1,000; Cell Signaling Technology), anti-PINK1(1:1,000; Abcam ab23707), and anti-parkin (1:1,000; Abcam ab77924). The antibody–antigen complexes were visualized using the LI-COR Odyssey Infrared Imaging System according to the manufacturer’s instructions with IRDye800 fluorophore-conjugated antibody (LI-COR Biosciences, Lincoln, NE, USA).
Immunocytochemistry
Following the ZnO NP treatment, cultured BV-2 cells were fixed with 4% paraformaldehyde and incubated with 1:100 diluted primary antibody, rabbit anti-mouse LC3B, and anti-mouse parkin for 1 h at 37°C; secondary antibody TRITC-conjugated goat anti-rabbit IgG was added for 40 min at 37°C. Then, the nucleus was dyed with DAPI for 10 min. Staining of LC3B and parkin was examined using fluorescence microscopy.
ROS
The dichlorodihydrofluorescein diacetate assay (DCFH-DA, Sigma-Aldrich, St Louis, MO, USA) was used to determine the level of intracellular reactive oxygen species (ROS). Briefly, wild-type BV-2 cells, BV-2 cell clones transfected with an empty vector, and PC12 cell clones transfected with PINK1 siRNA were seeded in a 96-well culture plate at a density of 5×10³ cells/well and incubated overnight for cell attachment. Next, the cells were rinsed with PBS and treated with 10 μg/mL ZnO NPs for 4, 8, 12, and 24 h. Then, the cells were washed with PBS twice and incubated with 10 μM of DCFH-DA for 1 h. Subsequently, DCF fluorescence intensity was measured using a Synergy-4 microplate reader (Biotek Instruments Inc., Winooski, VT, USA) at an excitation wavelength of 485 nm and an emission wavelength of 535 nm.
MDC staining
Dansylcadaverine (MDC), an autofluorescent dye and a specific marker for autophagic vacuoles, was used to examine whether the ZnO NPs induced autophagy in BV-2 cells. Briefly, BV-2 cells were seeded at a density of 2×10⁴ cells/well in a 6-well culture plate and incubated overnight for cell attachment. The cells were then treated with 10 μg/mL ZnO NPs for 4, 8, 12, and 24 h. The untreated cells served as the control. After the cells were treated with ZnO NPs, they were collected and stained with MDC following the manufacturer’s instructions. The samples were analyzed immediately using the Synergy-4 microplate reader at an excitation wavelength of 338 nm and an emission wavelength of 500 nm.
JC-1 assay
The Sigma JC-1 Assay Kit was used to measure the alteration of the mitochondrial membrane potential (ΔΨm). JC-1 forms aggregates that emit red fluorescence in the mitochondria of healthy cells. However, JC-1 remains as a monomer that emits green fluorescence during the loss of ΔΨm. Briefly, wild-type BV-2 cells, BV-2 cell clones transfected with an empty vector, and BV-2 cell clones transfected with PINK1 siRNA were seeded in a 96-well culture plate at a density of 5×10³ cells/well and incubated overnight for cell attachment. The cells were then treated with 10 μg/mL ZnO NPs for 4, 8, 12, and 24 h. The untreated cells served as the control. After the cells were treated with ZnO NPs, they were collected and stained using the JC-1 assay kit following the manufacturer’s instructions. The samples were analyzed immediately using the Synergy-4 microplate reader at an excitation wavelength of 540 nm and an emission wavelength of 590 nm to detect JC-1 aggregates and at an excitation wavelength of 490 nm and an emission wavelength of 525 nm to detect JC-1 monomers.
Statistics
Data were evaluated by SPSS (version 20, IBM, Armonk, NY, USA) software using two-way analysis of variance (ANOVA) and the Student Newman–Keuls test (SNK) with the cell line and the concentrations of ZnO NPs as variables in the evaluation of cell survival. One-way ANOVA was used with the cell line as the variable in the evaluation of cell viability, ROS amount, JC-1 amount, and MDC fluorescence intensity. All the Western blot results were quantified by ImageJ 1.48v. Differences were considered significant when P<0.05.
Results
Characterization of NPs
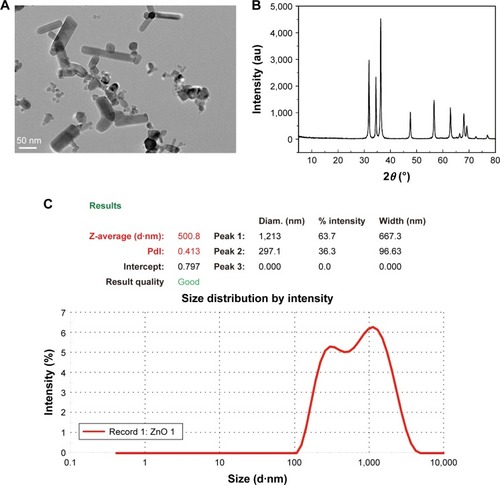
The morphology and primary sizes of ZnO NPs were measured using TEM. The TEM micrographs demonstrated that the ZnO NPs were hexagonal prism-shaped with a diameter of approximately 50 nm (). The XRD spectra clearly show that the diffraction peaks in the pattern are indexed as ZnO and are well matched with the available Joint Committee on Powder Diffraction Standards (JCPDS 36-1451) (). The intensity-weighted average hydrodynamic diameter of ZnO NPs in the distilled water suspension was 500.8 nm. The hydrodynamic size of the ZnO NPs suggested that ZnO formed small aggregates when dispersed in aqueous solution ().
Figure 2 Particle characterization and physicochemical properties of ZnO nanoparticles.
Notes: (A) Transmission electron micrograph indicating the hexagonal prism-shape with sharp-edged structures of the NPs. (B) XRD spectrum pattern of the ZnO nanoparticles. (C) The intensity-weighted average hydrodynamic diameter of ZnO NPs.
Abbreviations: ZnO, zinc oxide; XRD, X-ray diffraction; NP, nanoparticle.
Identification of the most effective PINK1 siRNA
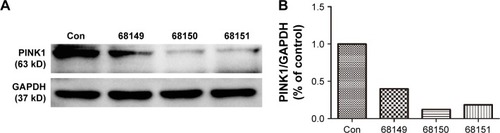
After the BV-2 cells were transiently transfected with the vectors PINK1 siRNA/68149, PINK1 siRNA/68150, and PINK1 siRNA/68151 separately, the expression of PINK1 at the gene level was evaluated using real-time PCR, and the expression of PINK1 at the protein level was evaluated using Western blot analysis. Compared with the other two vectors, the cells transfected with PINK1 siRNA/68150 showed a significant decrease in endogenous PINK1 expression levels 48 h after transfection (). Thus, PINK1 siRNA/68150 was chosen for the following experiments.
Figure 3 Western blot analysis of PINK1 protein in BV-2 cells transfected with three pairs of PINK1 siRNA.
Notes: (A) Western blot band. Con represents normal BV-2 cells, and 68149, 68150, and 68151 represent BV-2 cells transfected with PINK1 siRNA/68149, siRNA/68150, and PINK1 siRNA/68151, respectively. (B) Percentage of gray density. As shown in the figure, the knockdown efficacy of PINK1 siRNA/68150 is the highest. Similar results were observed in three independent experiments.
The effect of ZnO NPs on BV-2 cell viability
Cell viability after ZnO NP treatment in wild-type BV-2 cells
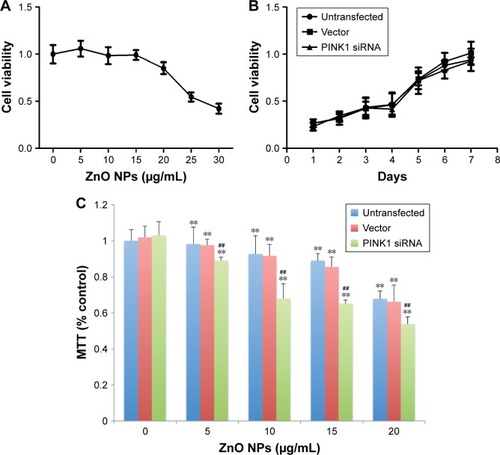
As shown in , ZnO NPs affected the BV-2 cell viability in a dose-dependent manner. At concentrations lower than 10 μg/mL, ZnO NPs showed no significant influence on the cell survival rate. When the concentration was greater than 10 μg/mL, as the ZnO doses increased, the cells showed a significant decrease in cell activity (). Thus, 10 μg/mL was chosen as the dose in the following experiment to study the time-related effect of ZnO NPs on BV-2 cells.
Figure 4 The various viability test results.
Notes: (A) The effect of various concentrations of ZnO NPs on the cell viability of wild-type BV-2 cells. Cells were cultured in media containing 0, 5, 10, 15, 20, 25, and 30 μg/mL ZnO NPs for 24 h. Cell viability was evaluated using an MTT assay. As shown, 20 and 25 μg/mL ZnO NPs were found to decrease the cell viability to below 80% and 50%, respectively (P<0.001). No significant differences were found below 10 μg/mL (P>0.05). (B) The growth curves of the three types of cell clones, ie, untransfected BV-2 cells, BV-2 cells transfected with an empty vector, and BV-2 cells transfected with PINK1 siRNA 68150. As shown, there were no significant changes in cell viability at each time point among the three types of cell clones (P>0.05). Data are expressed as the mean ± standard deviation (n=6). (C) Downregulation of PINK1 decreases the ZnO NP-induced toxicity in BV-2 cells. Untransfected BV-2 cells, BV-2 cells transfected with an empty vector, and BV-2 cells transfected with PINK1 siRNA 68150 were maintained in culture media containing 0, 5, 10, 15, and 20 μg/mL ZnO NPs for 24 h. Cell viability was evaluated using an MTT assay. Data are expressed as the mean ± SEM (n=6). Statistical significance was evaluated using two-way ANOVA with the cell lines and ZnO NP concentrations as independent variables. ** indicate P<0.01 for comparing the cells in the ZnO-treated group with the cells in the untreated group among every cell line. ## indicate P<0.01 for comparing stable clonal cells transfected with PINK1 siRNA/68150 with untransfected cells and cells transfected with vector alone. Similar results were observed in three independent experiments.
Abbreviations: ZnO NP, zinc oxide nanoparticle; ANOVA, analysis of variance.
Cell growth curve for three cell types
Based on the growth curves, no significant difference in cell viability was observed among untransfected BV-2 cells, BV-2 cell clones transfected with an empty vector, and BV-2 cell clones transfected with PINK1 siRNA (P>0.05; ), indicating that the downregulation of PINK1 does not alter cell growth. Moreover, no obvious difference in cell morphology was observed among the three cell clones under the inverted microscope.
Comparison of cell viability following treatment with NPs among the three cell types
The survival rate of the three cell types (untransfected BV-2 cells, BV-2 cells transfected with an empty vector, and BV-2 cells transfected with PINK1 siRNA 68150) after being treated with various doses of ZnO NPs is shown in . From this graph, it was found that the loss of function of PINK1 increased the vulnerability of the BV-2 cells to ZnO NPs ().
ZnO NPs induced oxidative stress in BV-2 cells
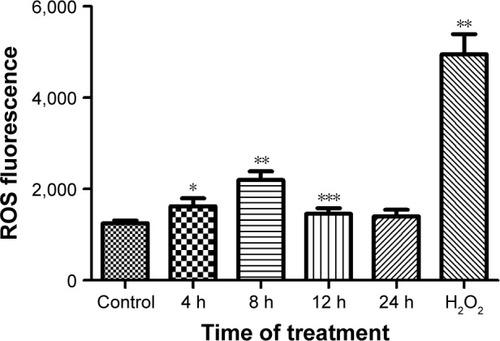
Oxidative stress was thought to be the most important effect of NPs on mammalian cells.Citation23,Citation24 The change in the oxidative status in BV-2 cells after being stimulated by ZnO NPs was evaluated using a DCFH-DA probe. The results obtained showed a time-dependent increase in fluorescence intensity after ZnO NP treatment, indicating that ZnO NPs induced oxidative stress in BV-2 cells in a time-dependent manner ().
Figure 5 The effect of ZnO NPs on the ROS level in BV-2 cells.
Notes: After the wild-type BV-2 cells were treated with 10 μg/mL ZnO NPs for 4, 8, 12, and 24 h, cells treated with H2O2 (500 mM) for 2 h were used as a positive control. ROS production was detected using a DCFH-DA probe and using a Synergy-4 microplate reader. ROS was calculated by multiplying the number of events by the mean of the fluorescence intensity value. The mean ± SD of three independent experiments is shown. The time points of 4, 8, and 12 h showed a significant increasing ROS level compared to that of the control (*P<0.01, **P<0.001, and ***P<0.05, respectively).
Abbreviations: ROS, reactive oxygen species; ZnO NP, zinc oxide nanoparticle; DCHF-DA, 2′,7′-dichlorofluorescin diacetate; SD, standard deviation.
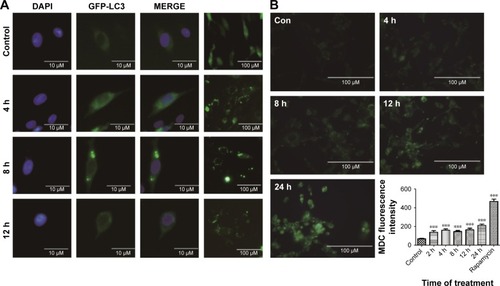
ZnO NPs induced mitochondrial swelling and triggered the autophagy process in BV-2 cells
To determine whether ZnO NPs triggered autophagy in BV-2 cells, wild-type BV-2 cells were transfected with the GFP-LC3 plasmid. The formation of autophagy vacuoles after the ZnO NP treatment was observed directly using a fluorescence microscope, MDC staining, and TEM. The expression of autophagy indicator LC3 was also evaluated using Western blot analysis. The results showed that ZnO NPs induced the autophagy process shortly after the treatment with ZnO NPs ().
Figure 6 The effect of ZnO NPs on the autophagy process in BV-2 cells.
Notes: (A) After the wild-type BV-2 cells were transfected with the GFP-LC3 plasmid, they were treated with 10 μg/mL ZnO NPs for 4, 8, 12, and 24 h. The autophagy process was evaluated using a fluorescence microscope. (B) After the cells were treated with 10 μg/mL ZnO NPs for 4, 8, 12, and 24 h, they were dyed with MDC, and then the fluorescence was determined using a fluorescence microscope. Cells treated with rapamycin (100 nM/L) for 2 h were used as a positive control. (C, D) After the cells were treated with 10 μg/mL ZnO NPs for 4, 8, 12, and 24 h, they were harvested; the total protein was extracted, and the autophagy process was evaluated using Western blot analysis. (E) The autophagy process was examined by TEM. The blue arrows show autophagosomes, and the red arrows show the mitochondria. Compared with the control, the swelling of mitochondria and an increasing number of autophagosomes were observed in the experimental groups. *P<0.05, **P<0.01, ***P<0.001 represent comparing the time point after NPs treatment with control.
Abbreviations: ZnO NP, zinc oxide nanoparticle; MDC, dansylcadaverine; TEM, transmission electron microscopy.
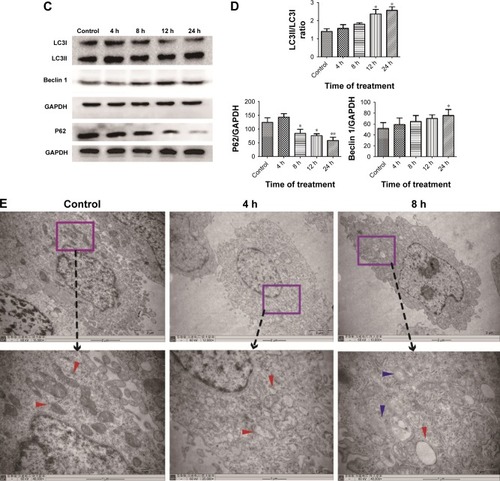
Involvement of PINK1/parkin-mediated mitophagy in ZnO NP-induced toxicity in BV-2 cells
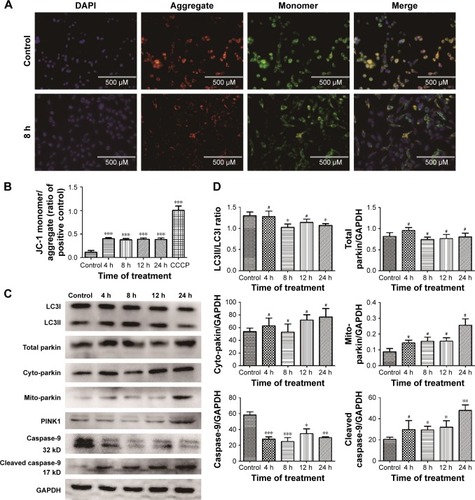
To determine whether PINK1/parkin mitophagy was involved in ZnO NP-induced toxicity in BV-2 cells, Western blot analysis was used to evaluate the protein expression of LC3, total parkin, parkin in the cytoplasm, parkin in mitochondria, PINK1, and caspase-9. The results indicated that the PINK1 expression was elevated after ZnO NP treatment. There was no significant difference in total parkin before and after treatment, while the cyto-parkin level decreased and the mito-parkin level increased after ZnO NP treatment, indicating the translocation of parkin from the cytoplasm to the mitochondria, which implies the involvement of mitophagy ().
Figure 7 Effect of ZnO NPs on the mitochondrial membrane potential and PINK1/parkin-mediated mitophagy in wild-type BV-2 cells.
Notes: Cells were treated with 10 μg/mL ZnO NPs for 4, 8, 12, and 24 h. Then, (A) the cells were stained with JC-1, and its uptake was determined by fluorescence microscopy. (B) The cells were stained with JC-1, and its uptake was determined using a Synergy-4 microplate reader. The JC-1 aggregate/monomer amounts were calculated by multiplying the number of events by the mean of the fluorescence intensity value. Cells treated with CCCP (10 μM) for 20 min were used as a positive control. (C, D) The cells were harvested, and their total protein, cyto-protein, and mito-protein were extracted for Western blot analysis. *P<0.05, **P<0.01, ***P<0.001 represent comparing the time point after NPs treatment with control.
Abbreviations: ZnO NP, zinc oxide nanoparticle; CCCP, carbonyl cyanide 3-chlorophenylhydrazone.
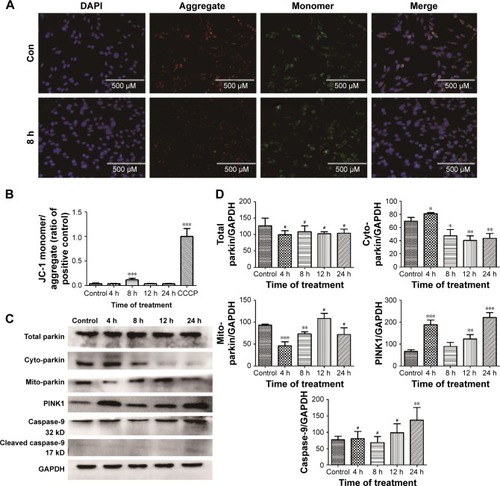
To further determine the specific role of PINK1/parkin-mediated mitophagy, a PINK1 gene knockdown BV-2 cell model was established using PINK1 siRNA 68150. The PINK1−/− BV-2 cells were treated with 10 μg/mL ZnO NPs for 4, 8, 12, and 24 h. The JC-1 assay and Western blot results revealed that the total parkin level was maintained; however, the expression of parkin in the mitochondria was lower than that in the mitochondria of wild-type cells, indicating that almost no parkin was translocated to the mitochondria after treatment with ZnO NPs. Compared with the wild-type cells, PINK1−/− cells showed a higher caspase-9 cleaved expression after ZnO NP treatment, indicating that the loss of PINK1 caused by ZnO NPs increased cell apoptosis ().
Figure 8 Effect of ZnO NPs on the mitochondrial membrane potential and mitophagy related protein expression in PINK1−/− BV-2 cells.
Notes: Cells were treated with 10 μg/mL ZnO NPs for 4, 8, 12, and 24 h. Then, (A) the cells were stained with JC-1, and its uptake was determined by fluorescence microscopy. (B) The cells were stained with JC-1, and its uptake was determined using a Synergy-4 microplate reader. The JC-1 aggregate/monomer amounts were calculated by multiplying the number of events by the mean of the fluorescence intensity value. Cells treated with CCCP (10 μM) for 20 min were used as a positive control. (C, D) The cells were harvested, and their total protein, cyto-protein, and mito-protein were extracted for Western blot analysis. *P<0.05, **P<0.01, ***P<0.001 represent comparing the time point after NPs treatment with control.
Abbreviations: ZnO NP, zinc oxide nanoparticle; CCCP, carbonyl cyanide 3-chlorophenylhydrazone.
Discussion
As the resident macrophage-like cells in the brain and spinal cord, microglia are the first line of defense against the entry of foreign particles or infectious agents. Once NPs enter the CNS, they are engulfed by microglia in a vacuole (phagosome) that contains enzymes and oxidizing moieties to catabolize the NPs. It has been reported that TiO2 NPs (P25) stimulate brain microglia to produce reactive oxygen species (ROS), interfering with mitochondrial energy production.Citation25 Choi et alCitation26 observed the microglial uptake of SiNPs using transmission electron and fluorescence confocal microscopy. Microglial functions were measured after SiNP exposure at different concentrations. The results demonstrated that very low levels of SiNPs could alter microglial function. Increased ROS and RNS production, changes in proinflammatory genes, and cytokine release may adversely affect microglial function and affect surrounding neurons. BV-2 cells were derived from raf/myc-immortalized murine neonatal microglia and are the most frequently used substitute for primary microglia. BV-2 cells and murine microglial cells (N9 cells) were frequently used as cell models for microglial activation and signaling after metallic oxide NP treatment, such as TiO2-NPs.Citation27,Citation28 Thus, BV-2 cells were chosen as the cell model in the present study. The MTT assay was used to evaluate the toxic effect of 50 nm ZnO NPs on BV-2 cell viability. The result indicated that a concentration of 50 nm ZnO NPs affects cell viability in a dose-dependent manner.
The mitochondria are the cellular powerhouses that generate ATP; therefore, they are key participants in all physiological and pathological events. The generation of mitochondrial ROS is a consequence of oxidative phosphorylation, and ROS play a crucial role in several redox-dependent signaling processes. In brain tissue, ROS are mostly generated by microglia and astrocytes, and they modulate synaptic and nonsynaptic communication between neurons and glia.Citation29 Many NPs, including ZnO NPs, can trigger damage to mitochondria and increase the mitochondrial membrane potential.Citation30–Citation32
In the present study, a ROS assay was used to evaluate the change of the ROS level in BV-2 cells after exposure to 50 nm ZnO NPs. The results indicated that the ZnO NP treatment significantly increased the ROS level in a time-dependent manner. Moreover, an increasing number of swollen mitochondria and autophagosomes were observed in the TEM images from exposed groups compared with control groups. A decreased mitochondrial membrane potential was observed in ZnO NP-exposed groups in the JC-1 assay, suggesting the appearance of mitochondrial dysfunction. These results established the induction of mitochondrial dysfunction after exposure to 50 nm ZnO NPs. These results are consistent with those from a recent study in which ZnO NP-induced oxidative stress activates the JNK signaling pathway, compromising the integrity of cellular membranes and leading to apoptosis of astrocytes.Citation33
Mitophagy is the selective degradation of dysfunctional mitochondria by autophagy. Brain cells rely heavily on mitophagy for normal development and function. These cells depend on both general autophagy for protein quality control and mitophagy for the removal of damaged mitochondria.Citation34 Recent findings demonstrated that PINK1 and parkin participate in the mitophagy process. PINK1 can be accumulated on damaged mitochondria where they recruit parkin onto the mitochondria, resulting in ubiquitination of OMM proteins and the induction of mitophagy.Citation35 However, the role of PINK1/parkin-mediated clearance of mitochondria in ZnO NP-induced autophagy in brain astrocytes remains unclear.
To determine whether the PINK1/parkin pathway is involved in ZnO NP-induced cell toxicity in BV-2 cells, the expression of total parkin, mito-parkin, cyto-parkin and PINK1 in wild type BV-2 cells was evaluated by Western blot analysis after the cells were exposed to ZnO NPs for a given period. The results showed a decreased level of cyto-parkin and an increased level of mito-parkin after ZnO NP exposure; however, the change of total parkin was not obvious, indicating that ZnO NPs induced the transportation of parkin from the cytoplasm to the mitochondria, implying the involvement of mitophagy in ZnO NP-induced toxicity.
To further determine the specific role of PINK1/parkin in this process, PINK1 siRNA was used to construct a PINK1 gene knockdown cell model in BV-2 cells, providing a good background to study the function of PINK1/parkin-mediated mitophagy in ZnO NP-induced toxicity in these cells. The results demonstrated that the downregulation of the PINK1 gene did not significantly change the cell growth rate, which is consistent with the results of previous research.Citation36 Different responses between wild-type cells and PINK1 gene knockdown cells to ZnO NP exposure were observed, and the results suggested that the downregulation of PINK1 caused a significant reduction in the survival rate after ZnO NP exposure compared with that of control cells. These results indicated that the PINK1 gene may not be an essential factor in the survival of BV-2 cells but that it possibly exerts a function in the defense of ZnO NP stimulation.
The expression of LC3, total parkin, cyto-parkin, mito-parkin, PINK1 and caspase-9 in PINK1−/− BV-2 cells was measured using Western blot analysis after the cells were treated with 50 nm ZnO NPs. The results indicated that the downregulation of PINK1 did not significantly change the total parkin level, but the mitochondrial level of parkin was significantly lower than that in wild-type BV-2 cells. Moreover, the cleaved caspase-9 level observed at every time point in PINK1−/− BV-2 cells was higher than that in wild-type cells, indicating that the deletion of PINK1 increased the cell apoptosis-related gene level after ZnO NP exposure. There was no difference in LC3II/I levels between the two cell clones, indicating that the knockdown of PINK1 caused by 50 nm ZnO NPs did not affect the autophagy process. These findings demonstrated that apart from autophagy, PINK1/parkin-mediated mitophagy plays a protective role in ZnO NP-induced cytotoxicity. The deletion of the PINK1 gene inhibited the recruitment of parkin to the mitochondria, causing failure of the cell to trigger mitophagy.
Therefore, PINK1/parkin-mediated mitophagy was suggested to play a role in ZnO NP-induced toxicity in BV-2 cells. However, in vitro cell models cannot accurately replicate various cellular interactions present in the body. Using these data alone, it is difficult to accurately predict the toxicological behavior of ZnO NPs in living organisms; this was an unavoidable limitation of the present study. To reach final conclusions, further animal experiments are required. It remains to be determined whether the unique physicochemical properties of ZnO NPs will introduce new mechanisms of injury and whether these injuries will result in new pathology.
Author contributions
Longquan Shao and Limin Wei conceived and designed the experiments; Limin Wei, Xiaoli Feng, and Jia Liu performed the experiments; Aijie Chen analyzed the data; Jianfeng Wang contributed reagents/materials/analysis tools; and Limin Wei wrote the paper. All authors contributed toward data analysis, drafting and critically revising the paper and agree to be accountable for all aspects of the work.
Acknowledgments
This work was supported by the Zhejiang Provincial Natural Science Foundation of China (LY16H140003, LY17H140008), the Wenzhou Municipal Science and Technology Bureau Foundation of China (Y20150070), and the National Natural Science Foundation of China (51672122, 81550011, 51172283).
Disclosure
The authors report no conflicts of interest in this work.
References
- JavidiMZareiMNaghaviNMortazaviMNejatAHZinc oxide nanoparticles as sealer in endodontics and its sealing abilityContemp Clin Dent201451202424808690
- MemarzadehKShariliASHuangJRawlinsonSCAllakerRPNanoparticulate zinc oxide as a coating material for orthopedic and dental implantsJ Biomed Mater Res A2015103398198924862288
- OsmondMJMcCallMJZinc oxide nanoparticles in modern sunscreens: an analysis of potential exposure and hazardNanotoxicology201041154120795900
- ChuangHCJuanHTChangCNCardiopulmonary toxicity of pulmonary exposure to occupationally relevant zinc oxide nanoparticlesNanotoxicology20148659360423738974
- BurnettMEWangSQCurrent sunscreen controversies: a critical reviewPhotodermatol Photoimmunol Photomed2011272586721392107
- WikingLLarsenTSehestedJTransfer of dietary zinc and fat to milk – evaluation of milk fat quality, milk fat precursors, and mastitis indicatorsJ Dairy Sci20089141544155118349247
- OkadaYTachibanaKYanagitaSTakedaKPrenatal exposure to zinc oxide particles alters monoaminergic neurotransmitter levels in the brain of mouse offspringJ Toxicol Sci201338336337023665935
- AmaraSBen-SlamaIMradIAcute exposure to zinc oxide nanoparticles does not affect the cognitive capacity and neurotransmitters levels in adult ratsNanotoxicology20148Suppl 120821524524369
- HanDTianYZhangTRenGYangZNano-zinc oxide damages spatial cognition capability via over-enhanced long-term potentiation in hippocampus of Wistar ratsInt J Nanomedicine201161453146121796247
- ChoWSKangBCLeeJKJeongJCheJHSeokSHComparative absorption, distribution, and excretion of titanium dioxide and zinc oxide nanoparticles after repeated oral administrationPart Fibre Toxicol201310923531334
- RancanFGaoQGrafCSkin penetration and cellular uptake of amorphous silica nanoparticles with variable size, surface functionalization, and colloidal stabilityACS Nano2012686829684222797484
- LiCHShenCCChengYWOrgan biodistribution, clearance, and genotoxicity of orally administered zinc oxide nanoparticles in miceNanotoxicology20126774675621950449
- ChevalletMGalletBFuchsAMetal homeostasis disruption and mitochondrial dysfunction in hepatocytes exposed to sub-toxic doses of zinc oxide nanoparticlesNanoscale2016843184951850627782264
- NalikaNParvezSMitochondrial dysfunction in titanium dioxide nanoparticle-induced neurotoxicityToxicol Mech Methods201525535536325774534
- LeeJGiordanoSZhangJAutophagy, mitochondria and oxidative stress: cross-talk and redox signallingBiochem J2012441252354022187934
- SharmaAKSinghVGeraRPurohitMPGhoshDZinc oxide nanoparticle induces microglial death by NADPH-oxidase-independent reactive oxygen species as well as energy depletionMol Neurobiol Epub2016106
- YaoZKlionskyDJAn unconventional pathway for mitochondrial protein degradationAutophagy201612111971197227686525
- ZhangYYuCHuangGWangCWenLNano rare-earth oxides induced size-dependent vacuolization: an independent pathway from autophagyInt J Nanomedicine2010560160920856835
- DaiCQLuoTTLuoSCp53 and mitochondrial dysfunction: novel insight of neurodegenerative diseasesJ Bioenerg Biomembr201648433734727422544
- HuQWangGMitochondrial dysfunction in Parkinson’s diseaseTransl Neurodegener201651427453777
- TrempeJFSauveVGrenierKStructure of parkin reveals mechanisms for ubiquitin ligase activationScience201334061391451145523661642
- ManzanilloPSAyresJSWatsonROThe ubiquitin ligase parkin mediates resistance to intracellular pathogensNature2013501746851251624005326
- GhoshMSinhaSJothiramajayamMJanaANagAMukherjeeACyto-genotoxicity and oxidative stress induced by zinc oxide nanoparticle in human lymphocyte cells in vitro and Swiss albino male mice in vivoFood Chem Toxicol20169728629627658325
- SrikanthKTrindadeTDuarteACPereiraECytotoxicity and oxidative stress responses of silica-coated iron oxide nanoparticles in CHSE-214 cellsEnviron Sci Pollut Res Int20172422055206427807789
- LongTCSalehNTiltonRDLowryGVVeronesiBTitanium dioxide (P25) produces reactive oxygen species in immortalized brain microglia (BV2): implications for nanoparticle neurotoxicityEnviron Sci Technol200640144346435216903269
- ChoiJZhengQKatzHEGuilarteTRSilica-based nanoparticle uptake and cellular response by primary microgliaEnviron Health Perspect2010118558959520439179
- LongTCTajubaJSamaPNanosize titanium dioxide stimulates reactive oxygen species in brain microglia and damages neurons in vitroEnviron Health Perspect2007115111631163718007996
- ShinJALeeEJSeoSMKimHSKangJLParkEMNanosized titanium dioxide enhanced inflammatory responses in the septic brain of mouseNeuroscience2010165244545419892005
- Popa-WagnerAMitranSSivanesanSChangEBugaAMROS and brain diseases: the good, the bad, and the uglyOxid Med Cell Longev2013201396352024381719
- ZhaoXRenXZhuRLuoZRenBZinc oxide nanoparticles induce oxidative DNA damage and ROS-triggered mitochondria-mediated apoptosis in zebrafish embryosAquat Toxicol2016180567027658222
- WangBZhangYMaoZYuDGaoCToxicity of ZnO nanoparticles to macrophages due to cell uptake and intracellular release of zinc ionsJ Nanosci Nanotechnol20141485688569625935990
- GuoDBiHWangDWuQZinc oxide nanoparticles decrease the expression and activity of plasma membrane calcium ATPase, disrupt the intracellular calcium homeostasis in rat retinal ganglion cellsInt J Biochem Cell Biol20134581849185923764618
- WangJDengXZhangFChenDDingWZnO nanoparticle-induced oxidative stress triggers apoptosis by activating JNK signaling pathway in cultured primary astrocytesNanoscale Res Lett20149111724624962
- ChenHChanDCMitochondrial dynamics – fusion, fission, movement, and mitophagy – in neurodegenerative diseasesHum Mol Genet200918R2R169R17619808793
- IvankovicDChauKYSchapiraAHGeggMEMitochondrial and lysosomal biogenesis are activated following PINK1/parkin-mediated mitophagyJ Neurochem2016136238840226509433
- MacVicarTDMannackLVLeesRMLaneJDTargeted siRNA screens identify ER-to-mitochondrial calcium exchange in autophagy and mitophagy responses in RPE1 cellsInt J Mol Sci2015166133561338026110381
- ZhangZZhouLZhouYMitophagy induced by nanoparticle-peptide conjugates enabling an alternative intracellular trafficking routeBiomaterials201565566526142776
- PickrellAMYouleRJThe roles of PINK1, parkin, and mitochondrial fidelity in Parkinson’s diseaseNeuron201585225727325611507