
Abstract
Surface modification of titanium (Ti) implants are extensively studied in order to obtain prominent biocompatibility and antimicrobial activity, especially preventing implant-associated infection. In this study, Ti substrates surface were modified by graphene oxide (GO) thin film and silver (Ag) nanoparticles via electroplating and ultraviolet reduction methods so as to achieve this purpose. Microstructures, distribution, quantities and spectral peaks of GO and Ag loading on the Ti sheets surface were characterized. GO-Ag-Ti multiphase nanocomposite exhibited excellent antimicrobial ability and anti-adherence performance. Subsequently, morphology, membrane integrity, apoptosis and relative genes expression of bacteria incubated on the Ti samples surface were monitored to reveal the bactericidal mechanism. Additionally, the cytotoxicity of Ti substrates incorporating GO thin film and Ag nanoparticles were investigated. GO-Ag-Ti composite configuration that have outstanding antibacterial properties will provide the foundation to study bone integration in vitro and in vivo in the future.
Introduction
Titanium (Ti) and its alloys still account for a substantial percentage of clinically used functional biomaterials in the field of biomedicine to manufacture orthopedic implants, bone screws, orthopedic joints, bone plates and dental implantsCitation1 due to their biocompatibility, good fracture toughness, relatively low elastic modulus, high strength-to-weight ratio and excellent corrosion resistance.Citation1–Citation3 Nevertheless, many reasons of implant failure are still associated with peri-implantitisCitation4 and appear to be resolved. On the implant surfaces, the adsorption of the subsequent accumulation of bacteria and biomolecular pellicles are the main stimuli for inducing peri-implantitis processes.Citation4 Though the biocompatibility of Ti and its alloys has been recognized,Citation5 it remains difficult to carry out all the requirements, such as osseointergration, biocompatibility, mechanical properties and antibacterial ability. To achieve excellent implant biomaterials, the Ti and its alloys often need modifications, such as sandblasting processing,Citation6 acid treatment,Citation7 alkali treatment,Citation8 laser etching,Citation9 microarc oxidationCitation10 and anodic oxidationCitation11 and so on.
Fortunately, more and more ideas and solutions are being put into practice due to the development of novel bioactive materials and nanobiotechnology. In the research area, one of the new possibilities is based on the graphene and its derivatives, which might be used in biomedical field in biosensors, biomaterials for tissue engineering, bioimaging and photothermal therapy agents, drug and gene delivery systems, and antibacterial killing factors, etc.Citation12–Citation15 Certainly, the graphene and its derivatives are promising materials for other applications due to their cell anti-adhesive and bactericidal properties, such as textiles, additives to drugs and food, orthopedic and dental biomaterials etc. Interestingly, graphene oxide (GO) is applied widely not only due to its character as an inexpensive precursor of graphene, but also due to its unique electrical, thermal, mechanical, optical, chemical and antibacterial properties. GO is a two-dimensional carbon nanomaterial consisting of a layer of single atom thick sp2-bonded carbon atoms, which are closely packed into a hexagonal crystal structure that contains carboxyl, epoxide and hydroxyl functional groups at the edges.Citation16,Citation17 The features of GO could enhance its interactions with proteins through covalent, hydrogen bonding and electrostatic nature.Citation18–Citation20 GO could promote the differentiation of stem cells, cell growth, expansion and proliferation. Additionally, it is often used as carrier to minimize the surface energy in the preparation process.Citation21 It has been reported that GO-silver (Ag) shows excellent antibacterial properties against many bacterial species.Citation22,Citation23
Metal nanoparticles have generated wide interest and focus, and are used in diverse field of research, most importantly, in biological and medical areas,Citation24 such as titanium dioxide,Citation25 zinc oxide,Citation26 magnesium,Citation27 gold,Citation28 copperCitation29 and Ag.Citation30 Ag, a nonspecific biocidal agent, is of particular interest due to its significant antimicrobial activity against a broad spectrum of fungus, viruses and bacteria, even antibiotic-resistant strains.Citation31 Ag nanoparticles (AgNPs) have unique physical and chemical properties. For example, AgNPs are more reactive than bulk metallic materials due to the larger active surface area. Because of this, its antibacterial effects are recognized and studied abundantly.Citation32 AgNPs not only inhibit the growth of Gram-positive bacteria and Gram-negative bacteria,Citation33 but also have cytotoxicityCitation34 at different concentrations. Hence, at the appropriate concentration, AgNPs play an important role and help to overcome drug resistanceCitation35 in biomedical applications. Several studies have shown that AgNPs induce cell necrosis and apoptosisCitation36 because AgNPs get ingested and enter the cytoplasm. A series of inflammatory reactions occur in the cell, and the expression of tumor necrosis factor-αCitation37,Citation38 increases markedly. Of course, AgNPs have also been demonstrated to cause cell apoptosis in vitro, including in neuronal cells, liver cells and macrophage cells. Microorganisms are much less likely to develop resistance to metal nanoparticles, which are promising candidates for multidrug-resistant bacteria, compared with antibiotics. Metal nanoparticles are widely used for electrical, environmental, structural, medical, and everyday purposes.Citation32
In the work, we synthesized GO-Ag on the Ti surface by electroplating process and ultraviolet (UV) reduction method. Why was GO-Ag chosen to be as antimicrobial agents? Because GO-modified Ti surface did not show antibacterial properties, and instead promoted the growth and adhesion of bacteria. Gram-positive bacteria, Staphylococcus aureus, Streptococcus mutans, and Gram-negative bacteria, Porphyromonas gingivalis were chose as models to study the antibacterial activities of the GO-Ag-Ti toward different bacteria species. Antimicrobial properties under different conditions were investigated at different bactericide dosages. The antimicrobial mechanism of GO-Ag-Ti was also demonstrated by structural and morphological observation, bacterial apoptosis, bactericidal process and bactericidal species analysis, gene expression assays, and cytotoxicity, etc.
Materials and methods
Specimen preparation
Commercial pure Ti plates (Northwest Institute for Nonferrous Metal Research, Xi’an, China, 1×10×10 mm3) were polished with 400–2,000-grit sic sandpaper (Zhuhai Dali Export Co., Ltd, China), then subjected to ultrasonic cleaning with acetone, deionized water, and ethanol sequentially for 10 min each. Afterward, specimen (anode) were electroplated in an aqueous electrolyte solution containing 20, 50, 80 and 100 µg/mL of GO at room temperature for 10 min with graphite electrode (cathode) and a direct current regulated power supply at 20 V. Polished titanium (P) specimen served as the control group. Additionally, before the samples preparation, the specimen were required to be etched in acid solution (deionized water: HNO3=4:1); the pH of GO aqueous solution was also adjusted. The Ti modified with GO was soaked in 1 mol/L of AgNO3 solution for 30 min.Citation39 Subsequently, it was rinsed with deionized water and dried, and then irradiated with UV light for 30 min. Before the experiment, all the samples were required to be sterilized by UV light for 1 h.
Surface characterization
The surface topography and relevant element distribution of the samples were inspected by stereomicroscope (Leica Microsystems, Wetzlar, Germany), field-emission scanning electron microscopy (FE-SEM, S-4800, Hitachi High Technologies, Tokyo, Japan). Raman spectroscopy of the specimens were recorded using a Horiba Jobin Yvon at 633 nm laser power 17 mW ×100 objective lens and an acquisition range from 1,000 to 3,000 cm−1. X-ray photoelectron spectroscopy (Kratos Analytical Ltd, Manchester, UK) analyses of the chemical composition of the samples were carried out with monochromatic Al Ka line at a power of 100 W (10 mA, 10 KV). The hydrophilic properties of the specimens were obtained with the DSA1 system (KRÜSS GmbH, Hamburg, Germany) by analyzing deionized water drop shape. Elastic modulus and binding force of samples were evaluated by nanoindentation (Agilent Technologies, Santa Clara, CA, USA) and nano-scratch (Agilent Technologies, USA), respectively.
Bacterial strain and culture conditions
S. mutans (UA159) was cultivated in brain–heart infusion (BHI, Oxoid, Basingstoke, England) broth medium overnight at 37°C in an anaerobic atmosphere (80% N2, 10% H2, 10% CO2).Citation40 P. gingivalis (ATCC33277) was cultured in the BHI broth medium containing 10% sheep blood for 24 h at 37°C in an anaerobic atmosphere containing two AnaeroPack (Mitsubishi, Japan). The bacterial suspension was adjusted to a concentration of 106 CFU/mL by turbidity meter (SGZ-6AXJ) for further usage.
Antibacterial assay
Antibacterial and adherent rate
The antibacterial ability and adhesion rate were evaluated using S. mutans and P. gingivalis cultivated in the BHI medium. Each sample was placed in 1 mL of bacterial suspension at a concentration of 106 CFU/mL for 24 h at 37°C. After culture completion, the samples were gently rinsed three times with phosphate-buffered saline (PBS) so as to remove non-adherent bacteria, and oscillated in 1 mL of PBS for 1 min. Bacterial suspensions of 100 µL were re-cultured on BHI agar plates. The adhesion and antibacterial rate were tested by following formula. Adhesion rate (%) = CFU of Experimental Groups/CFU of Control ×100%; antibacterial rate (%) = (CFU of Control − CFU of Experimental Groups)/CFU of Control ×100%.
Field emission scanning electron microscopy (FE-SEM) observation
The specimens that were sterilized for 1 h with UV were placed in the wells of a 24-well plate, and incubated with 1 mL bacterial suspension at 37°C for 24 h. Then the Ti substrates were gently rinsed three times with PBS, fixed with 2.5% glutaraldehyde at 4°C overnight, and dehydrated with different concentrations of alcohol for 10 min. The samples that were dried and sprayed with gold were observed with FE-SEM.
Fluorescence staining
Bacterial culture method was same as above. The substrates were gently rinsed with PBS three times, stained for 15 min in the dark at room temperature with LIVE/DEAD BacLight bacterial viability kits (L13152), and observed with laser scanning confocal microscopy (Fluoview FV1000, Olympus Corporation, Tokyo, Japan). The fluorescence intensity was evaluated by ImageJ software.
Flow cytometry texting
Bacterial culture method was same as above. After the bacteria that were on the substrates were eluted into 1 mL of sterile normal saline, LIVE/DEAD BacLight bacterial viability kits was added into the solution. The dyeing method was the same as the fluorescence staining. The bacterial apoptosis rate was monitored by flow cytometry (FACS Aria II, BD Bioscience, Franklin Lakes, NJ, USA).
Real-time polymerase chain reaction (RT-PCR) assay
Bacterial culture method was the same as above. The substrates were gently rinsed with PBS three times, and the bacteria were eluted into 1 mL of sterile normal saline. The total RNA of the cultured bacteria was extracted by centrifuging, digesting, splitting, deproteinization and rinsing (RNAprep pure cell/bacteria kit, TIANGEN, Beijing, China), etc. The pure RNA was determined by UV spectrophotometer (Bibby Scientific Co., Ltd, England), and reverse-transcribed into cDNA using a PrimeScript RT reagent kit (Takara). RT-PCR was implemented (Applied Biosystems 7500 Fast Real-Time PCR System, Foster City, CA, USA) by SYBR Premix Ex Taq™ (Takara), the primers and cDNA templates. The primer sequences of the genes () were designed according to the GenBank (www.ncbi.nlm.nih.gov). The expression levels of the genes were calibrated by the 16S rRNA gene as a housekeeping gene.
Table 1 Sequences of the primers
Cytotoxicity
The samples were placed in the wells of a 24-well plate, and incubated with the density of 2.5×10⁴ cells/cm2 primary rat bone marrow mesenchymal stem cells for 24 h. After the specimens were gently rinsed with PBS three times and were transferred to a new 24-well plate, to which were added 40 µL cell kit-8 (count CCK-8) and 360 µL serum-free α-MEM medium, they were cocultured for 3 h at 37°C. Subsequently, the supernatant was tested using a spectrophotometer (Biotek, VT, USA) at 450 nm. The cell viability was assessed via three parallel experiments.
Statistical analysis
A statistical analysis of variance and Fisher’s protected least-significant difference test were applied to estimate within-group differences and inter-group differences. Statistical analyses were carried out with SPSS 17.0 software at a statistical significant level of P-value <0.05.
Results
Surface characterization
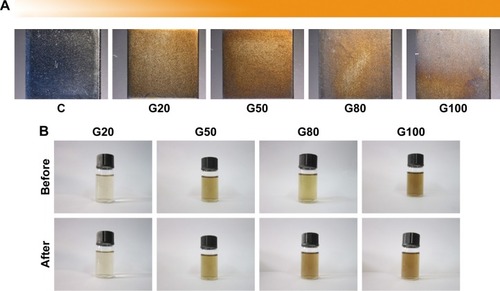
The control, 20, 50, 80 and 100 µg/mL were designated as C, G20, G50, G80, and G100, respectively. The Ti sheets that were modified by the different concentration of GO via electroplating method showed different colors (). Silvery white, yellowish, golden, light brown, and purplish brown corresponded to C, G20, G50, G80, and G100, respectively (). Before and after the reaction, the color of the aqueous solution of GO did not change in the naked eye view ().
Figure 1 Appearance changes of reaction solution and samples.
Notes: (A) Stereomicroscope morphologies of C, G20, G50, G80, G100. (B) Before and after comparison of reaction solution of G20, G50, G80, and G100. The 20, 50, 80 and 100 µg/mL are designated as G20, G50, G80, and G100, respectively.
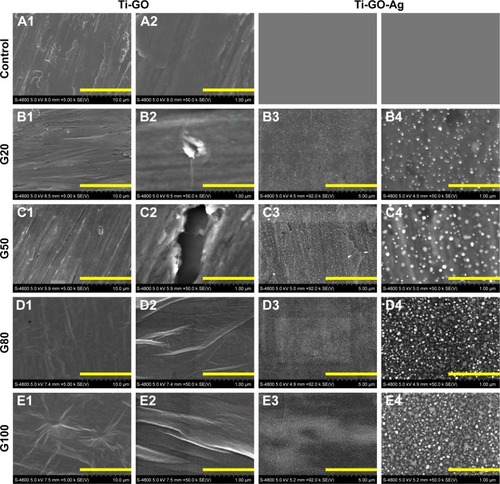
The morphologies of the Ti substrates are illustrated in . There were obvious scratches that were almost parallel and sharp on the Ti surface (). In the treatment groups, the specimens surface was relatively flat and obtuse (), and appeared as a thin film (). The higher the concentration of GO, the more the gauffer was on the Ti surface. In other words, there were more GO on the samples surface. Granular substances were observed on the Ti sheets () via the UV reduction method. At different concentrations of GO, the amount of granular materials were also different ().
Figure 2 Microstructural characterization of GO/GO-Ag coatings.
Notes: (A1/A2, B1/B2, C1/C2, D1/D2, E1/E2) SEM images of GO coatings of C, G20, G50, G80, G100. (B3/B4, C3/C4, D3/D4, E3/E4) SEM images of GO-Ag coatings of G20, G50, G80, G100. The 20, 50, 80 and 100 µg/mL are designated as G20, G50, G80, and G100, respectively.
Abbreviations: Ag, silver; GO, graphene oxide; SEM, scanning electron microscopy; C, control.
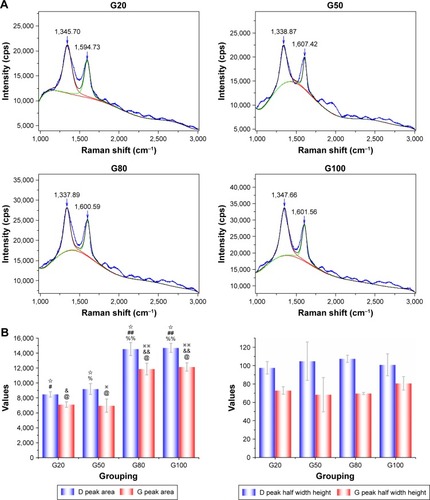
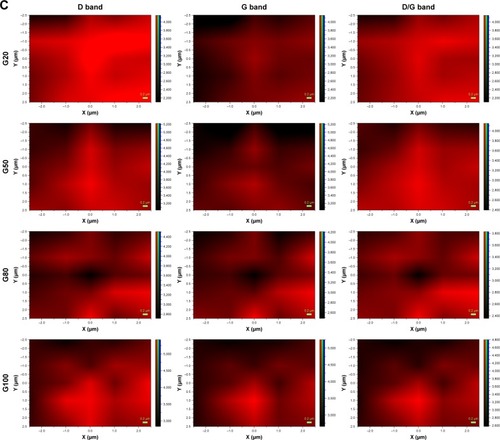
illustrates the typical Raman spectra of 20, 50, 80 and 100 µg/mL specimens obtained at an excitation wavelength of 633 nm. Two distinct peaks were shown for each substrate at (~1,345.70 cm−1, 1,594.73 cm−1), (~1,338.87 cm−1, 1,607.42 cm−1), (~1,337.89 cm−1, 1,600.59 cm−1), and (~1,347.66 cm−1, 1,601.56 cm−1) corresponding to the D and G bands, respectively. The D/G peaks area and D/G peaks half width height were obtained by fitting the four Raman peaks (). As the concentration of GO increased, the D/G peaks area values also enhanced. There were statistical differences between the four groups, except the G20 and G50. Additionally, at different concentrations, the D peak half width height value of G80 and G peak half width height value of G100 were the highest. Of course, D peak half width height value of G20 and G peak half width height value of G50 were the lowest. But there were no statistical differences between the four groups. indicates the distribution of GO on the Ti sheets surface using Raman spectra mapping, which represented the D peaks, G peaks, and D/G peaks.
Figure 3 Features of the samples characterized by Raman.
Notes: (A) D band and G band of GO of G20, G50, G80M, G100. (B) D/G peaks area and D/G peaks half width height. (C) Mapping analysis of GO coatings. The four groups are statistically significant (✰ and @). “#”, “%”, “&”, “※” are statistically significant with “##”, “%%”, “&&”, “※※”, respectively. The 20, 50, 80 and 100 µg/mL are designated as G20, G50, G80, and G100, respectively.
Abbreviation: GO, graphene oxide.
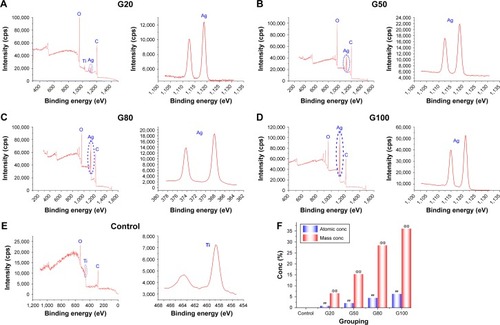
The surface compositions of the control and experimental groups were monitored by XPS. shows the analysis spectra of the control, G20, G50, G80, and G100. The XPS peaks showed that the four experimental groups contained not only Ag and Ti elements, but also some C and O elements, while the control group included mainly Ti, C and O elements. Besides the above described elements, Ti and Ag elements clearly were shown on the Ti substrates surface (). In addition, the Ag atomic and mass ratios () on the Ti sheets surface were 0, 0.87, 2.14, 4.53, 6.33, and 0, 6.63, 15.31, 28.42, 36.02 that were corresponded to the control group, G20, G50, G80, G100, respectively. And there are a significant statistical difference between the groups (P<0.001).
Figure 4 Characterization of Ag by XPS at different concentrations (A–D). Characterization of pure Ti by XPS. (E) Ag contents of C, G20, G50, G80, G100 (F). There are significant differences between the intra group and inter group (“##”, “@@”), respectively (P<0.001). The 20, 50, 80 and 100 µg/mL are designated as G20, G50, G80, and G100, respectively.
Abbreviations: Ag, silver; Conc, concentration; GO, graphene oxide; Ti, titanium; XPS, X-ray photoelectron spectroscopy.
Antibacterial and adherent rate
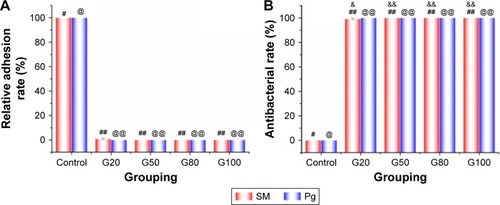
Antibacterial and relative adhesion rates against S. mutans and P. gingivalis on the samples surface for 24 h were evaluated, and the results are shown in . The relative adhesion rate () of the control group was the highest, which was close to 100% (the control group was used as reference); and the four experimental groups were 10.05%, 11.00%, 5.25%, 4.55%, which corresponded to the G20, G50, G80, G100, respectively. There are significant statistical differences between the control group and the four experimental groups (P<0.001). The best antibacterial ability () was shown by G100 (95.45%), which was followed by G80 (94.75%), G50 (89.00%), G20 (89.95%) groups (the control group was used as reference). There were no statistical differences between the four experimental groups.
Figure 5 Relative adhesion rate of C, G20, G50, G80, G100 (A). Antibacterial rate of C, G20, G50, G80, G100 (B). The control group is significantly different with the four groups. In other words, “#”, “@”, are significantly different with “##”, “@@”, respectively. G20 (“&”) is significantly different with G50, G80 and G100 (“&&”), respectively. (P<0.001). The 20, 50, 80 and 100 µg/mL are designated as G20, G50, G80, and G100, respectively.
Abbreviations: Pg, Porphyromonas gingivalis; SM, Streptococcus mutans.
Morphology of bacteria
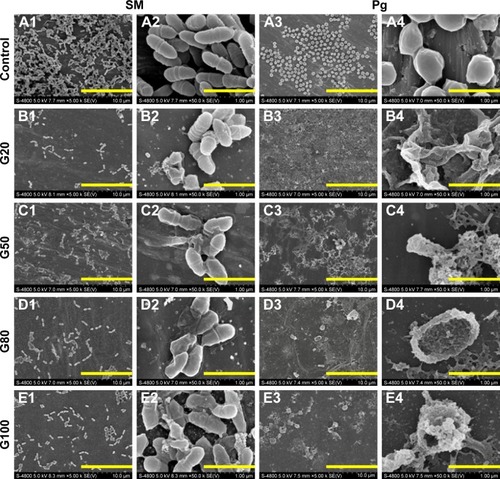
The morphology of bacterial cells that was observed by FE-SEM was a benefit to explore the antibacterial mechanism and evaluate the antibacterial ability after being exposed to Ti substrates surface.Citation41 shows the results of bacterial cells illuminating the degree and property of cells damage. The native S. mutans and P. gingivalis exhibited a typically chain-like and globular shape, respectively. The whole cells were membrane integrity (). After being exposed to G20, G50, G80, G100 groups, the bacteria cells bodies of S. mutans and P. gingivalis were badly damaged, such as shrinking (), perforating (), breaking (), and bursting (). And the number of bacteria on the experimental groups surface was significantly less than that on the control group surface.
Figure 6 SEM micrographs of bacteria on samples surface after incubation for 24 h.
Notes: (A1/A2, B1/B2, C1/C2, D1/D2, E1/E2) SEM morphologies of SM. (A3/A4, B3/B4, C3/C4, D3/D4, E3/E4) SEM images of Pg. The 20, 50, 80 and 100 µg/mL are designated as G20, G50, G80, and G100, respectively.
Abbreviations: Pg, Porphyromonas gingivalis; SEM, scanning electron microscopy; SM, Streptococcus mutans.
Membrane integrity of S. mutans and P. gingivalis
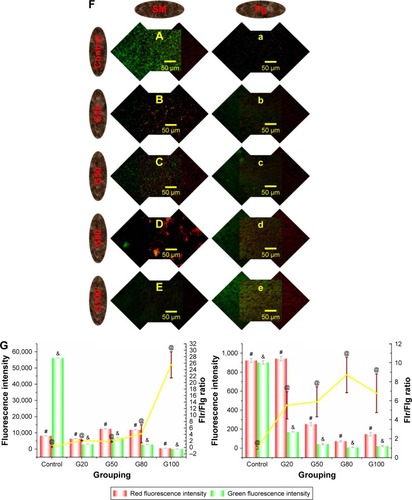
CLSM was monitored to observe the antibacterial effects of GO-Ag on S. mutans and P. gingivalis (). After fluorescence labeling, bacteria with compromised membranes were dyed red, and viable cells with integral membranes were stained green. S. mutans and P. gingivalis biofilms exhibited densely green areas on the control group surface, and the Ti substrates were not dyed (, a). As shown in , extensive red fluorescence on the specimens surface was examined. There was almost no adhesion of bacteria on the surface of sample G100 (). However, the Ti sheets were obviously stained red and green. Additionally, after the samples of G20, G50, G80, G100 were placed in P. gingivalis culture medium for 24 h, but there was almost no bacteria on the surface of samples, and fluorescence was observed (). Green fluorescence intensity (FIg), red fluorescence intensity (FIr) and FIr/FIg ratio are shown in . is the fluorescence intensity of S. mutans that adhered to the Ti substrates surface. The highest FIg and FIr were the control group and G50, respectively. The lowest FIr/FIg ratio was the control group ( left) and there are statistical differences between the 5 groups. The results of P. gingivalis were similar to the S. mutans ( right). The only difference was that the FIg and FIr were close in the control group.
Figure 7 Features of the SM and Pg characterized by CLSM.
Notes: Live cells were stained green, whereas dead cells were stained red. (A, a) Bacteria on the Ti surface. (B, b) Bacteria on the G20 surface. (C, c) Bacteria on the G50 surface. (D, d) Bacteria on the G80 surface. (E, e) Bacteria on the G100 surface. Capital letters represented SM, and lowercase letters represented Pg. (G) Fluorescence intensity values at both channels for C, G20, G50, G80, G100. The left picture is of SM, and the right picture is of Pg. There is statistical difference between the 5 groups (#, red fluorescence intensity values), (&, green fluorescence intensity values), and (@, FIr/FIg ratio). The 20, 50, 80 and 100 µg/mL are designated as G20, G50, G80, and G100, respectively. (F) Live/dead fluorescent staining images. SM staining (A–E). Pg staining (a–e).
Abbreviations: Pg, Porphyromonas gingivalis; SM, Streptococcus mutans; Ti, titanium.
Bacterial apoptosis
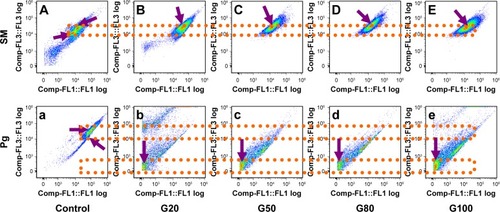
shows the results of flow cytometry analysis of S. mutans and P. gingivalis viability after treatment with pure Ti, 20, 50, 80 and 100 µg/mL of GO-Ag-Ti using LIVE/DEAD BacLight kit, which was composed of two stains, SYTO9 and PI. shows that there were two core areas that were marked by the purple arrows. After the bacteria cells were cultured with GO-Ag, there was only one fluorescent core area, which was labeled by orange dashed box and purple arrows (). The results of P. gingivalis were same as those of S. mutans. But the difference was that the fluorescent core area of four experimental groups moved to the bottom left corner ().
Figure 8 Flow cytometric detection of bacteria.
Notes: A/a is the dot plot of bacteria incubated on the pure Ti surface. B/b, C/c, D/d, E/e represent the results of G20, G50, G80, G100, respectively. Capital letters represent SM, and lowercase letters represents Pg. The 20, 50, 80 and 100 µg/mL are designated as G20, G50, G80, and G100, respectively. The arrows represent the orange core area.
Abbreviations: Comp, composite; Pg, Porphyromonas gingivalis; SM, Streptococcus mutans; Ti, titanium.
Relative gene expression
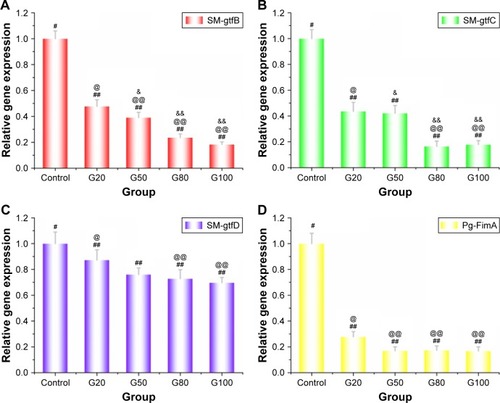
To investigate the effects of metabolites of S. mutans and P. gingivalis incubated on the pure Ti and GO-Ag-Ti surface for 24 h for the expression of the gtfB, gtfC, gtfD, and FimA genes, the RT-PCR was employed to analyze the mRNA levels of those genes. indicates the relative gene expression of gtfB, which decreased with the increase in the concentration of GO. And there were significant statistical differences (P<0.05), except for G80 and G100 (P>0.05). shows the results of gtfC, gtfD and FimA, which were similar to the results of gtfB. Additionally, there were no statistical differences, including between G20 and G50 (P>0.05, ), G80 and G100 (P>0.05, ), G20 and G50 (P>0.05, ), G50 and G80 (P>0.05, ), G50 and G100 (P>0.05, ), G80 and G100 (P>0.05, ), G50 and G80 (P>0.05, ), G50 and G100 (P>0.05, ), G80 and G100 (P>0.05, , respectively.
Figure 9 RT-PCR was employed to evaluate the effects of gene expression.
Notes: (A–C) The gtfB, gtfC, gtfD genes expression of SM were reduced significantly in comparison with those in the control group. (D) The image of FimA gene expression was shown. Its expression was reduced. The image of FimA gene expression is shown (D). The control group (#) was significantly different with the four groups (##). G20 (@) was statistical difference with G50, G80, G100 (@@), respectively. G50 (&) was statistical difference with G80, G100 (&&), respectively (P<0.05). The 20, 50, 80 and 100 µg/mL are designated as G20, G50, G80, and G100, respectively.
Abbreviations: RT-PCR, real-time polymerase chain reaction; SM, Streptococcus mutans.
Cell viability
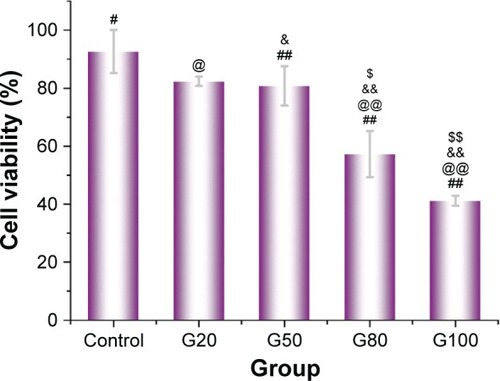
As shown in , the cell viability of pure Ti, G20, G50, G80 and G100 was examined using CCK-8. The result of the control group was the highest (92.63±7.49). The cell viability of the four experimental groups were inversely proportional to the contents of GO and Ag (82.33±1.62, 80.80±6.80, 57.30±7.98, 41.17±1.70). And there was statistical difference between the groups, including between C and G50 (P<0.05), C and G80 (P<0.001), C and G100 (P<0.001), G20 and G80 (P<0.001), G20 and G100 (P<0.001), G50 and G80 (P<0.05), G50 and G100 (P<0.001), G80 and G100 (P<0.05).
Figure 10 Cell exposed to the pure, G20, G50, G80, G100 samples surface viability were monitored by CCK-8.
Notes: These data were expressed as mean ± SD of at least three independent experiments. The control group (#) was significantly different with G50, G80, G100 (##), respectively. G20 (@) was statistically different with G80, G100 (@@), respectively. G50 (&) was statistically different with G80, G100 (&&), respectively. G80 ($) was statistically different with G100 ($$) (P<0.05). The 20, 50, 80 and 100 µg/mL are designated as G20, G50, G80, and G100, respectively.
Abbreviation: SD, standard deviation.
Discussion
The main reason for the failure of the dental implant is the bone loss caused by the inflammation around the implants.Citation4 It is generally known that bacteria are the main pathogenic factors of the peri-implantitis.Citation39 Therefore, how to improve the biocompatibility and antimicrobial activity of the dental implant to reduce or eliminate the inflammatory response has become the key to enhance the success rate of implants. The purpose of the modification is to make the material have dual properties, such as biocompatibility, and antibacterial property.Citation42–Citation44 In the study, GO-Ag coatings are produced on the Ti surface via an economical and simple method, which is electroplating and UV reduction. Although it is reportedCitation45 that the antimicrobial effect of GO is prominent, it could promote the growth of bacteria, which is consistent with the results of Ruiz et al and Hui at al.Citation46,Citation47 Ruiz et alCitation46 showed that GO does not have antimicrobial ability. It can be used as the framework of bacteria adhesion, and promote the growth, proliferation and formation of bacterial biofilm. Hui et alCitation47 indicated that the bacterial survival rate is 97.95% when the Escherichia coli incubate in 200 µg/mL of GO and LB culture medium for 3 h. This is sos because GO can adsorb the protein of LB culture medium, bovine serum albumin and tryptophan by non-covalent. Therefore, silver as a classical antibacterial agent is introduced into the experimental design.
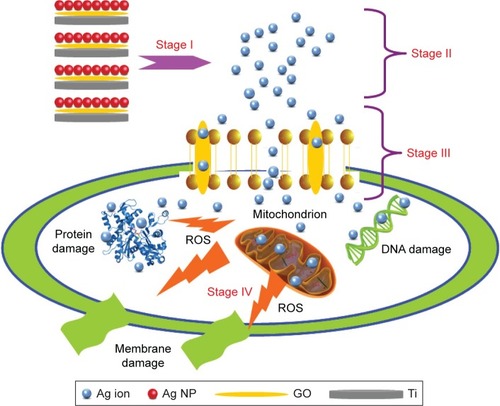
GO that is an oxide of graphene is brownish yellow. The color of its aqueous solution varies with the concentration of GO (). The Ti substrates surface show different color by electroplating, which is also due to the amount of GO (). And the results of Raman spectroscopy have demonstrated (). Although Ag also has a certain color, it cannot be distinguished by the naked eye. The results of FE-SEM indicate that the amount of Ag nanoparticles is different on the GO-Ti surface (). Because GO is negatively charged and 20, 50, 80 and 100 µg/mL of GO have different positive charge, so they can absorb different amounts of Ag nanoparticles, which has been proven by XPS (). In addition, the distribution of Ag nanoparticles is more uniform on the GO-Ti surface. In the GO structure, there are many carboxyl, hydroxyl, and carbonyl, which are negatively charged. They may be combined with positively charged Ag ions in the aqueous solution. It is reported that Ag ions are reduced by HCOONH4 in site when Ag ions combine with carboxyl, hydroxyl, and carbonyl. In our study, Ag ions are reduced by UV-light.Citation48 Many Ti surface antibacterial coatings are widely studied in the dental and orthopedic fields, including antibiotics, nonantibiotic organic antimicrobial agents, inorganic antimicrobial agents, biofunctionalization with antibacterial bioactive polymers, nitrogen monoxide, etc. An antimicrobial coating, which is doped with a proper amount of Ag nanoparticles has a good development and application prospect.Citation30–Citation33 In this study, Ag nanoparticles were deposited on the GO-Ti surface by UV reduction method ( and ). The antibacterial and relative adhesion rates against S. mutans and P. gingivalis are more obvious (), especially for S. mutans, which is an anaerobic bacteria and easily affected by environmental and operational factors. Of course, the results could also provide evidence for the antibacterial ability of GO-Ag-Ti, which is similar to the results of Song.Citation48 His findings suggest that antibacterial behavior of GO-Ag against both bacterial strains was dose and contact time dependent, and the antibacterial activity was more effective against E. coli than S. aureus. Additionally, Mei et alCitation49 revealed that Ag is a superior antimicrobial agent, promotes fibroblasts and epithelial cells to proliferate and differentiate in vitro, and causes less inflammation in vivo. Also, He et alCitation45 indicates that the antimicrobial effect of GO nanosheets is prominent against P. gingivalis. There are five explanations, including damaging DNA of bacteria, interrupting cell signal transduction,Citation50 oxidative damage of reactive oxygen species,Citation51 intracellular contents leaked outCitation52 and dehydrogenase inactivation.Citation53 The antibacterial effect could be obtained from the morphology and quantity of bacteria that adhere on the GO-Ag-Ti surface ( and ). First, Ag nanoparticles or Ag+ are easily and slowly released in solution. Second, positively charged Ag+ are attracted by the lipids, which are negatively charged on bacteria cell membranes due to electrostatic attraction. Third, because Ag+ interact with phospholipid bilayer resulting in altering cell membrane permeability.Citation54 As is known to all, the selective permeability of bacteria cell membrane is the foundation of substances transport and exchange. So, extracellular products leak in and intracellular contents leak out. In other words, the morphology and number of bacteria cells are greatly affected by GO-Ag. For example, shows that bacterial structure is destroyed. reveals that the number of bacteria cells is less than those on the control group surface.Citation55 On the other hand, when Ag+ enters the cells, it comes in contact with intracellular enzyme, such as enzymes of the respiratory chain, and destroys the mitochondrial electron transport chain. Also, catalase and superoxide dismutase are formed.Citation56 They are stronger oxidant, such as hydrogen peroxide and superoxide anion radical, etc, which are the main substances of oxidative stress reaction (reactive oxygen species [ROS]) in cells. When ROS occurs in the cell membrane, the phenomenon of denaturation, fracture, crosslinking, and death will come up (). In a word, the results not only affect the bacteria on the GO-Ag-Ti substrates surface, but also affect the planktonic bacteria in the culture medium. The results of this study are consistent with those of other scholars.Citation57–Citation60
Figure 11 Schematic mechanisms for antimicrobial ability of GO-Ag-Ti.
Notes: Blue ball, red ball, yellow sheet, and circular platform represent Ag ion, Ag nanoparticle, GO sheet, and Ti substrate, respectively. The roman numerals I, II, III and IV are the different periods of antimicrobial process. The 20, 50, 80 and 100 µg/mL are designated as G20, G50, G80, and G100, respectively.
Abbreviations: Ag, silver; GO, graphene oxide; NP, nanoparticles; ROS, reactive oxygen species; Ti, titanium.
Extracellular glucans of S. mutans are mostly synthetized by three GTFs (gtfB, gtfC, gtfD), which will influence bacteria adhesion, biofilm formation, occurrence and development of dental caries. Therefore, glucosyltransferase plays an important role in dental caries.Citation61 The water insoluble glucans are catalyzed mainly by gtfB and gtfC genes, loci of which are adjacent. The gtfD encodes, which are separate from the two genes mentioned previously, synthetise water soluble glucans. So changes in the gtfB, gtfC, gtfD genes expression will influence glucan synthesis. In the experiment, the expression of GTF genes are all subject to decrease (), especially gtfB and gtfC. KooCitation62 showed that gtfB, gtfC and gtfD expression in S. mutans are influenced by apigenin. The gtfB and gtfC genes expression of SM are reduced significantly in comparison with those in the control group. The results are the same as in Koo’s study. In contrast, the level of gtfD expression increases. This may be because the gtfD gene expression is affected by GO, Ag or pH. In KooCitation62 study, the bacteria grew in the planktonic state, and in our study, they are incubated on the Ti substrate surface. Additionally, the structure and function of fimbriae are unique, and synthetized by the FimA gene of P. gingivalis. However, it is one of the important bacteria causing the peri-implantitis.Citation4 The expression of FimA gene is significantly down-regulated (), which also explains why there are almost no bacteria on the Ti sheet’s surface ().Citation49
The cytotoxicity of carbon nanomaterials has been extensively studied and reported.Citation63 Of course, GO and graphene family materials are also without exception. Toxicity of these materials is mainly related to the exposition time, concentration and presence of other factors, such as biocompatible molecules.Citation64 In general, Ag nanomaterials have certain cytotoxicity as well as GO at high concentrations.Citation65 In this study, the cell viability of G80 and G100 is lower than the control, G20 and G50 (). The contents of GO and Ag on the Ti substrates surface of G80 and G100 are more than those in the control, G20 and G50 (, and ). In other words, more negative charges that can attract more Ag ions exist on the Ti sheet surface. Additionally, cytotoxicity is mainly caused by the Ag ions. In our previous study, after the four concentrations of GO (20, 50, 80 and 100 µg/mL) modified the Ti substrates surface, when they co-cultured with bacterials, they could promote different degrees of bacteria cell adhesion and growth. This is why we use Ag ions and GO to modify the Ti substrates surface. Although the concentration of 20, 50, 80 and 100 µm/mL of GO may induce cytotoxicity,Citation66 GO is not fully loaded onto Ti substrates surface, which has been explained by the results of .
Conclusion
In summary, GO thin film and Ag nanoparticles are loaded onto Ti substrates surface via electroplating and UV reduction methods. The amount of GO thin film and Ag nanoparticles are characterized by different laboratory apparatus. The antimicrobial activity and relative adhesion rate of GO-Ag-Ti are very prominent against S. mutans and P. gingivalis. The bactericidal mechanism of GO-Ag-Ti are revealed by microstructures, quantities, membrane integrity, apoptosis, and relative gene expression of S. mutans and P. gingivalis. Also, the cytotoxicity of samples are shown. Thus, GO-Ag-Ti multiphase nanocomposite would be a promising biomedical material due to prevention of implant-associated infection.
Acknowledgments
This work was supported financially by the National Natural Science Foundation of China (Nos 81470742 and 81530051).
Disclosure
The authors report no conflicts of interest in the work.
References
- MohseniEZalnezhadEBushroaARComparative investigation on the adhesion of hydroxyapatite coating on Ti–6Al–4V implant: a review paperInt J Adhes Adhes201448238257
- KuttyMGDeABhaduriSBYaghoubiAMicrowave-assisted fabrication of titanium implants with controlled surface topography for rapid bone healingACS Appl Mater Interfaces2014616135871359325095907
- ElahiniaMHHashemiMTabeshMBhaduriSBManufacturing and processing of NiTi implants: a reviewProg Mater Sci2012575911946
- de AvilaEDLimaBPSekiyaTEffect of UV-photofunctionalization on oral bacterial attachment and biofilm formation to titanium implant materialBiomaterials201567849226210175
- FuJYamamotoAKimHYHosodaHMiyazakiSNovel Ti-base superelastic alloys with large recovery strain and excellent biocompatibilityActa Biomater201517566725676584
- KimMHParkKChoiKHCell adhesion and in vivo osseointegration of sandblasted/acid etched/anodized dental implantsInt J Mol Sci2015165103241033625955650
- DolanmazDSaglamMInanOMonitoring bone morphogenetic protein -2 and -7, soluble receptor activator of nuclear factor-κ B ligand and osteoprotegerin levels in the peri-implant sulcular fluid during the osseointegration of hydrophilic-modified sandblasted acid-etched and sandblasted acid-etched surface dental implantsJ Periodontal Res2015501627324697526
- ButevEEsenZBorSIn vitro bioactivity investigation of alkali treated Ti6Al7Nb alloy foamsAppl Surf Sci2015327437443
- TrisiPBerardiniMColagiovanniMBerardiDPerfettiGLaser-treated titanium implants: an in vivo histomorphometric and biomechanical analysisImplant Dent201625557558027548108
- JiaZXiuPLiMBioinspired anchoring AgNPs onto micro-nanoporous TiO 2 orthopedic coatings: trap-killing of bacteria, surface-regulated osteoblast functions and host responsesBiomaterials20167520322226513414
- KulkarniMMazareAParkJProtein interactions with layers of TiO 2 nanotube and nanopore arrays: morphology and surface charge influenceActa Biomaterialia20164535736627581395
- LiJLTangBYuanBSunLWangXGA review of optical imaging and therapy using nanosized graphene and graphene oxideBiomaterials201334379519953424034502
- NotleySMCrawfordRJIvanovaEPBacterial interaction with graphene particles and surfacesAliofkhazraeiMAdvances in Graphene ScienceCroatiaInTech201399118
- YangYAsiriAMTangZDuDLinYGraphene based materials for biomedical applicationsMaterials Today20131610365373
- GoenkaSSantVSantSGraphene-based nanomaterials for drug delivery and tissue engineeringJ Control Release2014173758824161530
- DreyerDRParkSBielawskiCWRuoffRSThe chemistry of graphene oxideChem Soc Rev201039122824020023850
- Andre MkhoyanKContrymanAWSilcoxJAtomic and electronic structure of graphene-oxideNano Lett2009931058106319199476
- KalbacovaMBrozAKongJKalbacMGraphene substrates promote adherence of human osteoblasts and mesenchymal stromal cellsCarbon2010481543234329
- GaoLLiQLiRHighly sensitive detection for proteins using graphene oxide-aptamer based sensorsNanoscale2015725109031090725939390
- LiuJFuSYuanBLiYDengZToward a universal “adhesive nanosheet” for the assembly of multiple nanoparticles based on a protein-induced reduction/decoration of graphene oxideJ Am Chem Soc2010132217279728120462190
- ZhuYMuraliSCaiWGraphene and graphene oxide: synthesis, properties, and applicationsAdv Mater201022353906392420706983
- GurunathanSHanJWDayemAAEppakayalaVKimJHOxidative stress-mediated antibacterial activity of graphene oxide and reduced graphene oxide in Pseudomonas aeruginosaInt J Nanomedicine201275901591423226696
- LiuSZengTHHofmannMAntibacterial activity of graphite, graphite oxide, graphene oxide, and reduced graphene oxide: membrane and oxidative stressACS Nano2011596971698021851105
- HajipourMJFrommKMAshkarranAAAntibacterial properties of nanoparticlesTrends Biotechnol2012301049951122884769
- ElsakaSEHamoudaIMSwainMVTitanium dioxide nanoparticles addition to a conventional glass-ionomer restorative: influence on physical and antibacterial propertiesJ Dent201139958959821651955
- ZhongLYunKGraphene oxide-modified ZnO particles: synthesis, characterization, and antibacterial propertiesInternat J Nanomedicine2015107992
- Al-HazmiFAlnowaiserFAl-GhamdiAAA new large–scale synthesis of magnesium oxide nanowires: structural and antibacterial propertiesSuperlattices Microstruct201252220020924748719
- MubarakAliDThajuddinNJeganathanKGunasekaranMPlant extract mediated synthesis of silver and gold nanoparticles and its antibacterial activity against clinically isolated pathogensColloids Surf B Biointerfaces201185236036521466948
- RaffiMMehrwanSBhattiTMInvestigations into the antibacterial behavior of copper nanoparticles against Escherichia coliAnn Microbiol20106017580
- GaoAHangRHuangXThe effects of titania nanotubes with embedded silver oxide nanoparticles on bacteria and osteoblastsBiomaterials201435134223423524529392
- AgarwalAWeisTLSchurrMJSurfaces modified with nanometer-thick silver-impregnated polymeric films that kill bacteria but support growth of mammalian cellsBiomaterials2010314680als19864019
- SaifuddinNWongCWYasumiraAARapid biosynthesis of silver nanoparticles using culture supernatant of bacteria with microwave irradiationJ Chem2009616170
- ReithoferMRLakshmananAPingATChinJMHauserCAIn situ synthesis of size-controlled, stable silver nanoparticles within ultrashort peptide hydrogels and their anti-bacterial propertiesBiomaterials201435267535754224933510
- MukherjeeSGO’ClaonadhNCaseyAChambersGComparative in vitro cytotoxicity study of silver nanoparticle on two mammalian cell linesToxicol In Vitro201226223825122198051
- RamstedtMChengNAzzaroniOMossialosDMathieuHJHuckWTSynthesis and characterization of poly (3-sulfopropyl-methacrylate) brushes for potential antibacterial applicationsLangmuir20072363314332117291016
- ParkEJYiJKimYChoiKParkKSilver nanoparticles induce cytotoxicity by a Trojan-horse type mechanismToxicol In Vitro201024387287819969064
- TaheriSCavallaroAChristoSNSubstrate independent silver nanoparticle based antibacterial coatingsBiomaterials201435164601460924630091
- ParkMVNeighAMVermeulenJPThe effect of particle size on the cytotoxicity, inflammation, developmental toxicity and genotoxicity of silver nanoparticlesBiomaterials201132369810981721944826
- ZhaoLWangHHuoKAntibacterial nano-structured titania coating incorporated with silver nanoparticlesBiomaterials201132245706571621565401
- ShibataYSuzukiDOmoriSThe characteristics of in vitro biological activity of titanium surfaces anodically oxidized in chloride solutionsBiomaterials201031338546855520810162
- JinGQinHCaoHSynergistic effects of dual Zn/Ag ion implantation in osteogenic activity and antibacterial ability of titaniumBiomaterials201435277699771324947228
- ChuaPHNeohKGKangETWangWSurface functionalization of titanium with hyaluronic acid/chitosan polyelectrolyte multilayers and RGD for promoting osteoblast functions and inhibiting bacterial adhesionBiomaterials200829101412142118190959
- ZhangFZhangZZhuXKangETNeohKGSilk-functionalized titanium surfaces for enhancing osteoblast functions and reducing bacterial adhesionBiomaterials200829364751475918829101
- HarrisLGTosattiSWielandMTextorMRichardsRGStaphylococcus aureus adhesion to titanium oxide surfaces coated with non-functionalized and peptide-functionalized poly (L-lysine)-grafted-poly (ethylene glycol) copolymersBiomaterials200425184135414815046904
- HeJZhuXQiZKilling dental pathogens using antibacterial graphene oxideACS Appl Mater Interfaces2015795605561125705785
- RuizONFernandoKASWangBGraphene oxide: a nonspecific enhancer of cellular growthACS Nano20115108100810721932790
- HuiLPiaoJGAulettaJAvailability of the basal planes of graphene oxide determines whether it is antibacterialACS Appl Mater Interfaces2014615131831319025026597
- SongBZhangCZengGGongJChangYJiangYAntibacterial properties and mechanism of graphene oxide-silver nanocomposites as bactericidal agents for water disinfectionArch Biochem Biophy2016604167176
- MeiSWangHWangWAntibacterial effects and biocompatibility of titanium surfaces with graded silver incorporation in titania nanotubesBiomaterials201435144255426524565524
- ShrivastavaSBeraTRoyASinghGRamachandraraoPDashDCharacterization of enhanced antibacterial effects of novel silver nano-particlesNanotechnology20071822225103225112
- PalSTakYKJoardarJNanocrystalline silver supported on activated carbon matrix from hydrosol: antibacterial mechanism under prolonged incubation conditionsJ Nanosci Nanotechnol2009932092210319435087
- KimKJSungWSSuhBKAntifungal activity and mode of action of silver nano-particles on Candida albicansBiometals200922223524218769871
- MatsumuraYYoshikataKKunisakiSTsuchidoTMode of bactericidal action of silver zeolite and its comparison with that of silver nitrateAppl Environ Microbiol20036974278428112839814
- SuGZhouHMuQEffective surface charge density determines the electrostatic attraction between nanoparticles and cellsJ Phys Chem2012116849934998
- SondiISalopek-SondiBSilver nanoparticles as antimicrobial agent: a case study on E. coli as a model for Gram-negative bacteriaJ Colloid Interface Sci2004275117718215158396
- HoltKBBardAJInteraction of silver(I) ions with the respiratory chain of Escherichia coli: an electrochemical and scanning electrochemical microscopy study of the antimicrobial mechanism of micromolar Ag+Biochemistry20054439132141322316185089
- LambadiPRSharmaTKKumarPFacile biofunctionalization of silver nanoparticles for enhanced antibacterial properties, endotoxin removal, and biofilm controlInt J Nanomedicine20151021552117125834431
- PadaliaHMoteriyaPChandaSGreen synthesis of silver nanoparticles from marigold flower and its synergistic antimicrobial potentialArabian J Chem201585732741
- GhoshINPatilSDSharmaTKSrivastavaSKPathaniaRNavaniNKSynergistic action of cinnamaldehyde with silver nano-particles against spore-forming bacteria: a case for judicious use of silver nanoparticles for antibacterial applicationsInt J Nanomedicine201384721473124376352
- SharmaTKSapraMChopraAInteraction of bacteriocin-capped silver nanoparticles with food pathogens and their antibacterial effectInt J Green Nanotechnol20124293110
- YamashitaYBowenWHBurneRAKuramitsuHKRole of the Streptococcus mutans gtf genes in caries induction in the specific-pathogen-free rat modelInfect Immun1993619381138178359902
- KooHSeilsJAbranchesJBurneRABowenWHQuiveyRGJrInfluence of apigenin on gtf gene expression in Streptococcus mutans UA159Antimicrob Agents Chemother200650254254616436708
- SutariyaVBPathakYBiointeractions of NanomaterialsLondon, UKCRC Press2014
- ChowdhurySMLalwaniGZhangKCell specific cytotoxicity and uptake of graphene nanoribbons[J]Biomaterials201334128329323072942
- CaoHLiuXMengFBiological actions of silver nanoparticles embedded in titanium controlled by micro-galvanic effectsBiomaterials201132369370520970183
- ZhangYAliSFDervishiECytotoxicity effects of graphene and single-wall carbon nanotubes in neural phaeochromocytoma-derived PC12 cellsACS Nano2010463181318620481456