
 ?Mathematical formulae have been encoded as MathML and are displayed in this HTML version using MathJax in order to improve their display. Uncheck the box to turn MathJax off. This feature requires Javascript. Click on a formula to zoom.
Abstract
This research aimed to develop and optimize a nanoemulsion-based formulation containing ceramide IIIB using phase-inversion composition for transdermal delivery. The effects of ethanol, propylene glycol (PG), and glycerol in octyldodecanol and Tween 80 systems on the size of the nanoemulsion region in the phase diagrams were investigated using water titration. Subsequently, ceramide IIIB loading was kept constant (0.05 wt%), and the proposed formulation and conditions were optimized via preliminary screening and experimental design. Factors such as octyldodecanol/(Tween 80:glycerol) weight ratio, water content, temperature, addition rate, and mixing rate were investigated in the preliminary screening experiment. Response surface methodology was employed to study the effect of water content (30%–70%, w/w), mixing rate (400–720 rpm), temperature (20°C–60°C), and addition rate (0.3–1.8 mL/min) on droplet size and polydispersity index. The mathematical model showed that the optimum formulation and conditions for preparation of ceramide IIIB nanoemulsion with desirable criteria were a temperature of 41.49°C, addition rate of 1.74 mL/min, water content of 55.08 wt%, and mixing rate of 720 rpm. Under optimum formulation conditions, the corresponding predicted response values for droplet size and polydispersity index were 15.51 nm and 0.12, respectively, which showed excellent agreement with the actual values (15.8 nm and 0.108, respectively), with no significant (P>0.05) differences.
Introduction
Environmental changes and improper skin care affect the conditions of normal skin and may trigger various cutaneous disorders, such as common dermatitis, and may decline the barrier function of the skin.Citation1 This investigation focused on ceramide IIIB, which is known to improve water content and smoothen human skin upon topical application.Citation2
Ceramide IIIB supports renewal of the skin’s natural protective layer and forms an effective barrier against moisture loss. Therefore, this molecule, identical to human skin, is particularly suitable for long-term protection and repair of sensitive and dry skin.Citation3 At present, for ceramide IIIB to be active, at least 0.05 wt% of it should be present in cosmetic products. However, its application in cosmetics and pharmaceuticals is difficult, owing to its low solubility. Therefore, a carrier should be developed for incorporating ceramide IIIB for application in cosmetics and pharmaceuticals with the following characteristics: it should not produce skin irritation, it should dissolve ceramide IIIB well, and it should have good skin permeability and high bioavailability.
A nanoemulsion containing ceramide IIIB has been prepared by high-energy emulsification methods.Citation3 These high-energy methods require complicated equipments and high energy for industrial scale production compared to low-energy methods. Low-energy methods are advantageous because optimum establishment of the phase diagram generates the smallest nanoemulsion and low-energy methods makes scaling up easy.Citation4 These methods include phase-inversion temperature, phase-inversion composition (PIC), and spontaneous emulsification. Organic solvents are generally not recommended in most cases for use in the field of cosmetics.Citation4 It is relevant to point out that use of phase-inversion temperature is not suitable for thermosensitive active compounds. Therefore, we prepared an oil-in-water (O/W) nanoemulsion using water titration. The PIC method has great potential for scaling up applications because of its ease of formation and relatively low energy costs.Citation5 Phase transition is produced by stepwise addition of water to a mixture of the surfactant and oil for the formation of O/W nanoemulsions.Citation6
Emulsifiers are common constituents of most topical medicaments and cosmetics because they enable the solubilization of otherwise-insoluble compounds.Citation7 TW80 is an odorless and tasteless nonionic surfactant with a hydrophilic–lipophilic balance of 15±1. Due to its surface activity and chemical structure, polysorbate 80 is capable of reducing the interfacial tension of the system.Citation8 It is often used as a solubilizer and wetting agent.Citation9 The skin-friendliness of the developed nanoemulsion systems might be impaired with increasing TW80 content. Therefore, we need to add a cosur-factant to reduce the concentration of TW80.
To prepare a nanoemulsion the following aspects should be considered. It is generally believed that nanoemulsions of particle size 1–100 nm possess a large interfacial area,Citation10,Citation11 which helps to overcome the epidermal barrier that might favor skin permeation of active substances. Nanoemulsions have notable adhesive properties on the skin surface upon administration, because the water in the formulation evaporates, leaving behind a film of oil droplets. Due to capillary forces of the nanosize pores, fusion and formation of a film is promoted, and pressure can reinforce this effect. This leads to increased skin hydration, which may promote the absorption of topically applied drugs or cosmetics.Citation12 The very small droplet size greatly reduces the gravitational force,Citation13 and Brownian motion largely prevents gravitationally driven sedimentation or creaming.Citation6,Citation10,Citation14 The transparent nature of O/W nanoemul-sions, their good fluidity, and the absence of any thickeners give them a pleasant aesthetic character and skin feel.Citation13
Nanoemulsions improve the topical efficacy of active ingredients due to their small particle size. The formulation and process variables influence the particle size and polydispersity index (PDI) in different manners when interactions occur among the different variables. Response surface methodology (RSM) is a powerful and effective statistical tool for multivariate analysis of the relationships between independent variables and response variables.Citation15,Citation16
In this paper, an optimization procedure involving a preliminary screening experiment and RSM was performed. We aimed to optimize the processing conditions and formulation compositions for the preparation of ceramide IIIB-loaded nanoemulsions with the smallest particle size and lowest PDI values by RSM.
Materials and methods
Materials
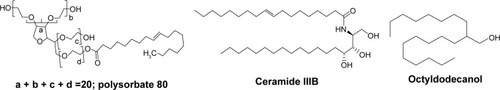
On the basis of the formulation elaborated, stable nanoemulsions were obtained. Tween 80 (polysorbate 80) was used as the emulsifier. Additionally, short-chain alcohols (ethanol, glycerol, PG) were tested as cosurfactants. The cosmetic oil Tegosoft G20 (octyldodecanol) and Tween 80 were obtained from Evonik (Essen, Germany), which also kindly provided ceramide IIIB. Ethanol was purchased from Merck (Darmstadt, Germany). PG (propylene glycol) was bought from SKC (Seoul, South Korea). Glycerol was procured from KLK Emmerich GmbH, (Emmerich am Rhein, Germany). All ingredients used in the formulation are characterized in . All ingredients used were of pharmaceutical, food, or cosmetic grade. Distilled water was used throughout the study. Structures of Tween 80, ceramide IIIB, and octyldodecanol are shown in .
Table 1 Screening of ingredient contents
Figure 1 Chemical structures of Tween 80, ceramide IIIB, and octyldodecanol used in this study (ChemDraw®, CambridgeSoft).
Construction of phase diagram
All components were weighted and mixed under magnetic stirring. Compositions are expressed in wt% ratio between components and also as w:w ratio. Phase diagrams were constructed using the aqueous titration method at ambient temperature. Figures S1 and S2 depict the phase-diagram structure, which was used to identify the maximum region of stable emulsion for formulation development.
Initially, Tween 80 was combined with three types of solubilizers as cosurfactants tested in the present investigation: PG, glycerol, and ethanol. At a fixed surfactant:cosurfactant (Smix) ratio of 1:1, oil and Smix ratio were mixed well in different mass ratios from 1:9 to 9:1 under magnetic stirring. The nanoemulsion phase was identified as the region in the phase diagram where clear, easily flowable, and transparent formulations were obtained based on visual observation. Cosurfactants that attained the maximum nanoemulsion region were selected for formulation development.Citation17
Phase diagrams were plotted using Tegosoft G20 as the oil phase and Tween 80 and glycerol as the surfactant and cosurfactant, respectively. Tween 80 was blended with glycerol at weight ratios of 1:3, 1:2, 1:1, 1:0, 2:1, and 3:1. These Smix ratios were chosen in raising the concentration of the surfactant with respect to the cosurfactant and decreasing the concentration of the cosurfactant with respect to the surfactant for meticulous research of the phase diagrams. Titration of water was conducted with various combinations in different weight ratios of oil to Smix (1:9, 1:8, 1:7, 1:6, 1:5, 1:4, 1:3, 1:2, 1:1, 6:4, 7:3, and 9:1). Stepwise addition of water was carried out on each mass ratio of oil and Smix, and visual observations were made for transparent and single-phase mixtures. When an opaque fluid system was observed, the amounts of water added were recorded to complete the phase diagrams. Three axes of the pseudo-three-component phase diagram represented water, Tegosoft G20, and a mixture of surfactant and cosurfactant at a fixed weight ratio, respectively.
Preparation of ceramide IIIB-loaded nanoemulsions
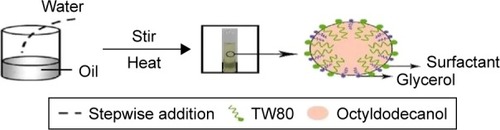
O/W nanoemulsions were formulated using Tegosoft G20 as the dispersed oil phase and Tween 80 and glycerol as the surfactant and cosurfactant, respectively. The results of pseudoternary phase analysis showed that the combined use of surfactant–cosurfactant (Tween 80–glycerol, 1:1 w:w) enlarged the self-emulsifying area. Oil was blended with surfactant and cosurfactant at weight ratios of 1:9, 2:8, and 3:7. Ceramide IIIB was dissolved in Eutanol G above 100°C and then cooled to a specified temperature. TW80 and glycerol were dissolved in the oil phase. Nanoemulsions were prepared by continuous addition of distilled water to mixtures of Eutanol G, Tween 80, and glycerol (). Each formulation was prepared by heating the mixture at different temperatures ranging from 20°C to 60°C in a thermostatic bath (Julabo F25-ME) under constant magnetic stirring (400–720 rpm) and at an addition rate of 0.3–1.8 mL/min. Then, each formulation was stirred continuously for 30 min. Nanoemulsions were prepared by varying the emulsification parameters (), in order to screen these parameters with respect to achieving small emulsions with close size distributions for high physical stability. In fast-screening studies, the influence of different variables on emulsion properties was checked. Three variables were considered: emulsification temperature, addition rate, and mixing rate. The emulsions were sampled and evaluated in terms of particle size and PDI.
Table 2 Phase-inversion composition for preliminary nanoemulsion screening
Experimental design
After the preliminary determination of desirable nanoemulsion region, a four-factor central composite design (CCD) was utilized using Design Expert software (version 8.0.6; Stat-Ease, Minneapolis, MN, USA). The independent variables and their coded levels and scheme matrix of the CCD are represented in and , respectively. CCD was employed to determine the effect of temperature (30°C–70°C, X1), addition rate (0.9–2.1 mL/min, X2), and water content (30–70 wt%, X3), as well as the effect of mixing rate (480–800 rpm, X4) on two response variables: average droplet size (Y1) and PDI (Y2) of nanoemulsions. As such, based on the CCD, a total of 30 experiments were run involving 16 factorial points, eight axial points, and six replicates of center points. Experiments were performed in randomized order, in order to minimize the effects of unexplained variability in the actual responses due to extraneous factors. The choice of CCD as the experimental design is used to estimate factor effects, to evaluate interaction effect between factors, and to permit optimization in the full factor space.Citation18
Table 3 Independent and dependent variables established based on CCD
Table 4 CCD scheme: independent and response variables
Statistical analysis
Response surface analysis was performed to obtain the desired formulation of the sphingolipid-loaded nanoemulsion carrier with respect to temperature (X1), addition rate (X2), water content (X3), and mixing rate (X4). The main objective was to determine the optimal composition and conditions of formulations for attaining minimum particle size (Y1) and lowest PDI (Y2). The responses were then analyzed jointly by conferring to them either the same importance or weight for simultaneous optimization of multiple responses.Citation19
A second-order polynomial equation effectively expressed the responses to the selected independent variables. The generalized response surface model is shown by the following equation:
where Yi is the predicted response, Xi the independent variables, a0 a constant, ai, aii, and aij the linear, quadratic, and interactive coefficients, respectively.
An appropriate polynomial model was chosen, based on the statistical significance of the model (P<0.05) and the lack-of-fit value of the model provided by Design-Expert software not being significant.Citation19 The goodness of fit of the model was evaluated by coefficient determination (R2) and analysis of variance (ANOVA).Citation20 Significant differences between independent variables were determined by ANOVA. Response surfaces and 3D contour plots of the fitted polynomial-regression equations were generated to visualize the interaction effect of the independent variables on responses better.Citation21
Verification of models
Experimental data obtained for average droplet size and PDI for ceramide IIIB nanoemulsions prepared under recommended conditions according to CCD are presented in . Verification of the final reduced models was performed by comparing the experimental values with the predicted value obtained from the response-regression equations.Citation22
Emulsion-droplet size and polydispersity-index measurement
Mean droplet size and size distribution were measured by dynamic light scattering with a Malvern Zetasizer Nano ZS90 (Malvern Instruments, Malvern, UK) by diluting 1 mL of the nanoemulsion with 20 mL of water. Each nanoemulsion was diluted with distilled water to weak opalescence.Citation23 Measurements were carried out at 25°C with a scattering angle of 90°. Size distribution was represented by PDI values. PDI values <0.25 indicated a narrow size distribution providing good stability of nanoemulsions.Citation24
Morphological analysis
Morphological examination and globular size confirmation of the nanoemulsions were performed using transmission electron microscopy (TEM). In order to perform TEM observations, the nanoemulsion containing ceramide IIIB was first diluted in water (1:10), and a drop of the diluted emulsion was then directly deposited on the holey copper grid and treated with a drop of 2% (w:v) phosphotungstic acid and left for 30 seconds at room temperature. Excess liquid was blotted with a piece of Whatman filter paper, and the sample was dried at room temperature. Photographs of the drops were obtained using TEM (H-7650; Hitachi, Tokyo, Japan) under high-voltage electricity of 80 kV.
Results and discussion
Physicochemical properties of nanoemulsion ingredients
The choice of octyldodecanol as the internal phase of the nanoemulsion was based on the following consideration. With respect to the solubility capacity of sphingolipids, octyldodecanol is considered a very high-solubility excipient suitable for use as a vehicle for incorporating ceramide IIIB. shows the results of the dissolution test for 1 wt% ceramide IIIB in different cosmetic oils. We chose octyldodecanol as the oil phase based on these advantages, which improved the pharmacokinetic activity of drugs and enhanced skin penetration.
Table 5 Dissolution-test results for 1 wt% ceramide IIIB in different cosmetic oils
Screening emulsion in phase-diagram structure
The most important criterion for the development of nanoemulsion systems is that all the excipients depend upon the requirement and fall under the category “generally regarded as safe”.Citation17 The screening of the component can be illustrated with the help of the pseudoternary phase diagram with a nanoemulsion-formation zone.
Effect of ethanol, PG, and glycerol in Tegosoft G20 and TW80 systems
For selection of cosurfactants, pseudoternary phase diagrams were plotted with different cosurfactants, ie, PG, glycerol, and ethanol (Figure S1). A distinct conversion from a slightly sticky liquid to a clear one and finally to a turbid liquid was observed. The sizes of the nanoemulsion region in the phase diagrams were compared at a fixed Smix ratio (1:1) for the same surfactant and oil phases. Incorporation of PG significantly increased the water incorporation when the chain length was increased from ethanol () to PG (). The effect of PG on the area of the nanoemulsion region was a little superior to slightly better than the effect of glycerol ().
The conversion from optically transparent liquid to slightly turbid liquid was affected by the effect of cosurfactants on particle size and the influence of cosurfactants on the optical clarity of nanoemulsions. At the same time, the stability of the system has a direct relationship with optical clarity.Citation25 The influence of PG, ethanol, and glycerol on the properties of the system would be expected to impact the tendency for small droplets to be formed by the spontaneous emulsification method, as described elsewhere.Citation26,Citation27 The difference among nanoemulsion sizes in the different systems investigated was mainly due to the nature of the cosurfactant.
PG and ethanol have similar backbone structures, consisting of H3C–(CHOH)–; however, PG has a –CH2OH group attached to the backbone, while ethanol only has a –H attached.Citation27 PG and glycerol (having one more hydroxyl group than PG), which form hydrogen bonds like water, have relatively high dielectric constants and are immiscible with hydrocarbon solvents.Citation28 This difference in their molecular properties will alter their interactions with Tegosoft G20, water, and TW80 molecules.
Cosurfactants can alter the properties of surfactants in emulsions, probably due to different physicochemical or molecular phenomena.Citation27 First, the presence of cosurfactants may modulate the solubility of surfactant monomers in aqueous solutions by altering the magnitude of the hydrophobic effect. Second, cosurfactant molecules may alter the packing and optimum curvature of the surfactant monolayers through their ability to compete with water molecules, thereby partially dehydrating the hydrophilic head groups of surfactants.Citation26,Citation27 Third, some cosurfactants change their optimum curvature and decrease the elasticity of surfactant film by penetrating the hydrophilic head-group region of surfactant monolayers.Citation29,Citation30 Glycerol affects the surfactant aggregation and its structure due to dehydration.Citation29 The other part of the cosurfactant molecules resides in the water and decreases the polarity of water by interfering with its hydrogen-bonding network.Citation31,Citation32 The mechanism of droplet formation has been partly attributed to the solubility and optimum curvature of the surfactants.Citation33 According to Shiao et al,Citation34 the mutual miscibility between the hydrophobic part of the surfactant and the oil will influence the degree of oil penetration into the amphiphilic film (the boundary between the organic phase and the aqueous phase) and will also affect spontaneous curvature.Citation31
The dependence of droplet size on the cosurfactants may be attributed to the differences between their abilities to alter the various aforementioned mechanisms, eg, surfactant solubility, density, and viscosity of aqueous solutions, and optimum curvature, interfacial rheology, thickness, interfacial tension, and flexibility.Citation26,Citation27 Nanoemulsions containing 20% ethanol appear less pellucid than those containing 30% PG, despite the former system comprising slightly smaller droplets.Citation27 Saberi et al showed that nanoemulsions with smaller droplets can be produced using higher glycerol concentrations.Citation26 It has been reported that the refractive index has a significant impact on the optical properties of emulsions,Citation35 and smaller droplets scatter light less strongly than larger ones.Citation36 An emulsion with a refractive index of 1.37 correspond to aqueous solutions with PG concentration of 30% and ethanol concentration of 20%, the corresponding refractive index of which is 1.34.Citation27 The refractive index of aqueous glycerol solutions has been reported to increase from 1.33 to 1.40 upon increasing glycerol concentration from 0% to 50%.Citation26 Although the oil phases in these experiments were different, there is a reference value in this respect compared to the trend in refractive index. Therefore, it can be speculated that light scattering from a nanoemulsion containing ethanol should be greater than that from a nanoemulsion containing PG and that the light scattering from the nanoemulsion containing PG is greater than that from the one containing glycerol, resulting in differences in the size of the phase-diagram area.
The skin-moisturizing effect depends on the amount of absorbed humectant and the physicochemical properties in the stratum corneum.Citation37 The important pharmacological properties of glycerol visually confirmed by preliminary clarity studiesCitation37–Citation39 are as follows: it is hygroscopic, has keratolytic effect by desmosome degradation, has smoothing effects, and protects emulsion systems against irritations. Additionally, treatments with glycerol in water reversed skin dryness and erythema.Citation40 Also, recent findings have proved that glycerol creates a stimulus for barrier repair and improves stratum corneum hydration.Citation41 That investigation showed that the glycerol effect persists for an extraordinarily long period. Therefore, glycerol was considered a more desirable cosurfactant compared to PG.
The interfacial equilibrium was due to the intermolecular forces among Tegosoft G20, TW80, and the three types of cosurfactants. The TW80 is a nonionic surfactant favoring van der Waals forces and hydrogen bonds.Citation42 It should be emphasized that these conjectures need to be proved by identifying the precise mechanisms involved, as a part of future endeavors.
Effect of surfactant:cosurfactant mass ratio on nanoemulsion formation
The relationship between the phase behavior of nanoemulsions and the mass ratio of surfactant:cosurfactant can be captured with the aid of a pseudoternary phase diagram.Citation43 The system underwent a transition from transparent to translucent to opaque, via rearrangements of the ingredients within the nanoemulsion phase and the light-scattering behavior of the system. Nanoemulsions containing higher or lower levels of glycerol were either optically transparent or opaque, due to varied light scattering by droplets of different sizes.Citation26 Nanoemulsion area was used as the assessment criteria for the evaluation of surfactant:cosurfactant mass ratio. The larger the area of the nanoemulsion region, the greater the nanoemulsification efficiency of the system.
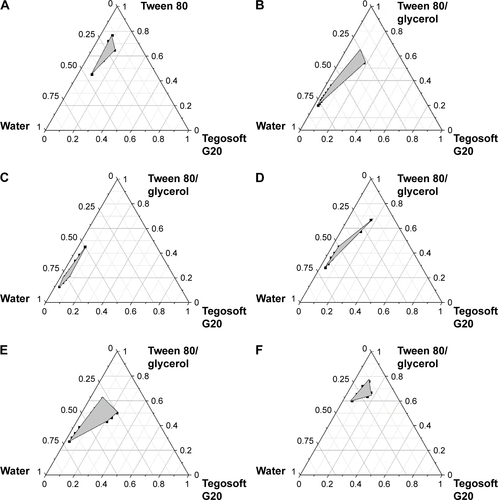
The phase diagram of the three-component system of Tegosoft G20–Tween 80–water is presented in Figure S2A. A limited microemulsion-formation zone was obtained. Alteration in the phase diagram in the presence of glycerol is shown in Figure S2B–F. Glycerol was added at a 1:1 weight ratio to Tween 80. The change in the size of the phase diagram was dramatic. Possible explanations for the increase in phase-diagram area are increased incorporation of glycerol into the surfactant film and decreased polarity of water, sufficiently reducing interfacial tension and favoring formation of O/W nanoemulsion.Citation44 On further increasing of the TW80 concentration, ie, at Smix ratio 2:1 (Figure S2E), the region increased in size compared to Smix ratio 1:0 and Smix ratio 1:1. Although TW80 concentration was further increased for the Smix ratio of 3:1 (Figure S2F), a decrease in area was noticed when compared with Smix ratio 2:1. The region of the phase diagram shrank, implying that the lowest interfacial tension and optimum curvature had been achieved. Therefore, performing the test with an Smix ratio of 4:1 was redundant. When glycerol concentration with respect to TW80 was increased to obtain Smix ratio 1:2 (Figure S2C), it was observed that the area decreased compared to Smix ratio 1:1. When glycerol concentration was further raised to make an Smix ratio of 1:3 (Figure S2D), a further decrease in the area was attained.
At relatively low glycerol concentrations, mean particle diameter increased with increasing surfactant concentration. An optimum concentration of glycerol provides an ideal balance between the dehydration rate of the polar heads of Tween 80 and the viscosity of the aqueous phase, which provides an adequate rate of insertion of the surfactant molecules into the interface.Citation45 The TW80:glycerol weight ratio was the key factor influencing the appearance of nanoemulsions and affecting the area of nanoemulsion regions. High glycerol concentrations may dehydrate the polar heads of polysorbate molecules too quickly and intensely,Citation29 leading to high reduction in the hydrophilic–lipophilic balance of the surfactant and preventing their proper accommodation in the oil–water interface.Citation46 Glycerol contains three hydroxyl groups; therefore, an increase in glycerol concentration accompanied by a reduction in TW80 concentration made spontaneous breakup of the oil–water interface more difficult without a decrease in interfacial tension. Areas of O/W nanoemulsion zones are known to be dependent on surfactant contention.Citation47 In consideration of the fact that increased surfactant amounts will irritate the skin and that glycerol is beneficial to skin, TW80:glycerol mass ratio of 1:1 (), which produced a broader nanoemulsion region in the phase diagram, was selected for further research.
Figure 2 Proposed mechanism for phase-inversion composition for production of ceramide IIIB nanoemulsion: mass ratio of TW80 to glycerol is 1:1.
Preliminary screening experiment
The influence of composition parameters, including the oil:surfactant weight ratio and the water fraction, was investigated systematically. The study was restricted to a Tegosoft G20:Tween 80/glycerol weight-ratio range of 1:9–3:7 and a water-weight range of 30–70. Moreover, the formation of nanoemulsions also depends on preparation conditions.Citation33,Citation45 The aim of the preliminary screening experiment was to screen the appropriate factors for experimental design optimization. The factors considered in preliminary screening experimentation were emulsification temperature, addition rate, and mixing rate.
Effect of emulsification temperature
In this series of experiments, we examined the influence of emulsification temperature on particle size and PDI values of the nanoemulsions produced using PIC. This information is important for the rational design of nanoemulsion-based delivery systems. The results are shown in , which shows that the smallest PDI value was produced at 50°C. It was found that reducing the emulsification temperature from 50°C to 20°C had little effect on mean droplet size. Increasing emulsification-energy input by raising the temperature from 50°C to 60°C led to a significant increase in droplet size from 14.74 to 30.19 nm. This result corresponds with a reported study,Citation48 which indicated that bigger droplet sizes were produced when the temperature was increased to 60°C. The observed changes in particle size and PDI values with increasing temperature may have occurred for a number of reasons.
Figure 3 Effect of temperature on mean droplet size and polydispersity index.
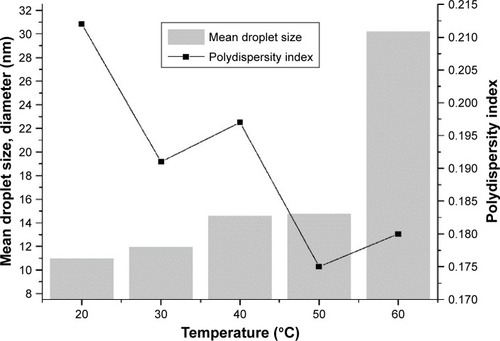
The original oil drop rapidly divided into many small oil drops at moderately high temperatures, inducing fast dispersion and high degree of dispersion of the emulsion.Citation49 The nature of the oil phase also alters phase-inversion temperature. Glycerol can modulate the properties of TW80 and influence the size of droplets and size distribution,Citation26 probably because glycerol can dehydrate the polar head groups of the nonionic surfactant molecules, thereby altering their optimum curvature and decreasing their cloud point.Citation50,Citation51 The same trend was also observed for the system based on Tween 80.Citation31 Previous research has confirmed that the effect of Tween 80 is highly dependent on temperature.Citation24 Increased temperature enhanced the solubility of TW80, making the surfactant more soluble in the oil phase and affecting the spontaneous curvature of the surfactant film. The head group of Tween 80 becomes progressively dehydrated with increasing temperature.Citation52 In addition, head-group dehydration means that the packing parameters of surfactant molecules tend toward unity, producing an ultralow interfacial tension, which in turn promotes the formation of O/W nanoemulsions.Citation52 However, high temperatures decrease the solubility of the hydrophilic surfactant by dehydration of the polar head group of the nonionic surfactant molecules, probably leading to leakage of TW80 from the oil–water interface,Citation24 thereby allowing aggregation of droplets. These factors may have facilitated the formation of smaller droplets and closer size distribution at 50°C, leading to a lower extent of Ostwald ripening. In our study, 50°C was selected as the optimum temperature because it gave relatively uniform emulsion droplets.
Effect of addition rate
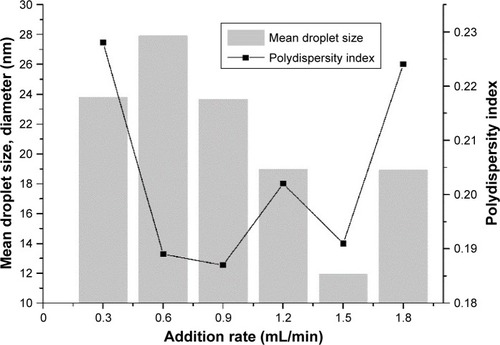
The purpose of these experiments was to examine the influence of addition rate on nanoemulsion characteristics by PIC. The overall composition of the different systems was kept constant, but addition rate was varied. There were appreciable differences in droplet size and PDI values that could be produced by the low-energy method, depending on addition rate (). We found that the smallest droplets were formed at an addition rate of 1.5 mL/min: diameter 11.93 nm and PDI value 0.191. Nanoemulsions with narrow size distributions were also produced at addition rates of 0.6 mL/min (diameter 27.92 nm and PDI value 0.189) and 0.9 mL/min (diameter 23.65 nm and PDI value 0.187), but the droplets formed were appreciably larger than those produced at an addition rate of 1.5 mL/min. The addition rate is an important factor and should be adjusted to ensure it is slow enough for the O/W phase to be formed. Low addition rates allow the system time to equilibrate. If addition time is very long, these relatively unstable samples start to destabilize, leading to increased droplet size.Citation53
Figure 4 Effect of addition rate on mean droplet size and polydispersity index.
Effect of mixing rate
The effect of mixing rate on the formation of small droplets and PDI values was investigated by preparing a series of emulsions of fixed composition (). The smallest mean droplet size was observed at a stirring speed of 640 rpm for the emulsions prepared. Droplet size was effectively reduced from 83.96 nm to 11.93 nm upon an increase in mixing rate from 320 rpm to 640 rpm, which corresponded to previous results.Citation54 The width of the particle-size distribution was not strongly influenced by mixing rate, as described by Saberi et al.Citation55
Figure 5 Effect of mixing rate on mean droplet size and polydispersity index.
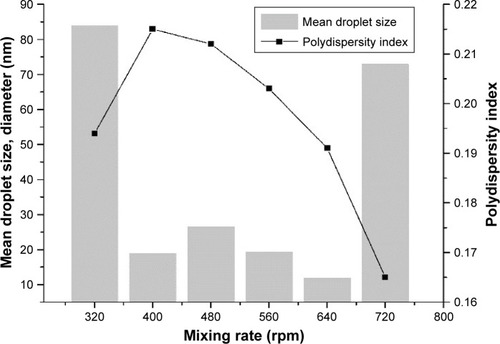
Similar results were observed for emulsion-droplet size and mixing rate for emulsification of nanoemulsions.Citation53,Citation56 Previous studiesCitation55,Citation57 suggested that gentle mixing was needed to form very fine droplets, highlighting the importance of controlling this parameter. Mixing had to be more vigorous to obtain phase transitions. Droplet size was reduced upon an increase in mixing rate, because the applied mechanical energy broke up and ensured an even distribution of the surfactant–oil phase in the aqueous phase.Citation58 If the mixing rate was too high, it promotes destabilization mechanisms like coalescence and sedimentation, resulting in larger final droplets.Citation53
Effect of Tegosoft G20:Tween 80/glycerol weight ratio
In this series of experiments, we investigated the influence of oil:(surfactant:cosurfactant) ratio (OSR) on droplet size and particle-size distribution of nanoemulsions produced by PIC (). Both mean particle diameter and PDI values reduced upon a decrease in OSR. This variation agrees with earlier reports on nanoemulsions prepared by PIC.Citation33,Citation45
Figure 6 Effect of oil:surfactant ratio on mean droplet size and polydispersity index.
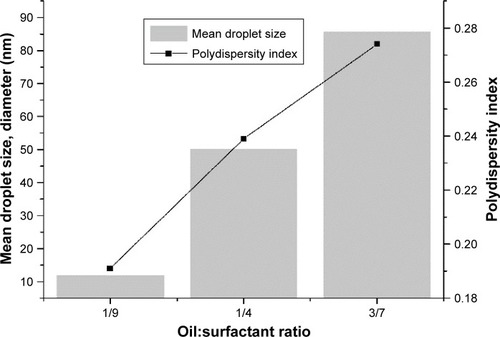
There was a rapid decrease in interface pressure with decreasing molecular volume of the surfactant and cosurfactant. The presence of glycerol strongly influenced the formation of nanoemulsions by PIC.Citation46 Upon addition of water, the normal tendency of Tween 80 molecules was to migrate to a water-rich environment and to accommodate themselves in an oil–water interface. The presence of glycerol lowered the solubility of Tween 80 in the aqueous phase.Citation59 Control of the migration rate of Tween 80 molecules from the oil to aqueous phase was also controlled by the influence of glycerol on their solubility, as well as by the increase in viscosity of the aqueous phase with greater amounts of glycerol.Citation46
Formation of emulsions was influenced by an equivalence between the two main mechanisms: droplet disruption and droplet coalescence. The surfactants play major roles in the deformation and breakup of droplets. Surfactants allow the existence of interfacial tension gradients, which is crucial for the formation of stable droplets.Citation13 The rate of droplet coalescence was determined by the ability of the emulsifier to form an absorbed monolayer rapidly onto the newly formed interface,Citation22 mainly governed by emulsifier concentration. In fact, the emulsifier played a vital role in the formation of emulsions by lowering interfacial tension.Citation22 Surfactant concentration controls the total surface area of the droplets, rate of droplet dispersion, and coalescence.Citation58 The concentration of glycerol increases, affecting the properties of TW80 and forcing the glycerol to penetrate the interfacial region, accounting for the observed decrease in droplet size and particle-size distribution.
Effect of water content
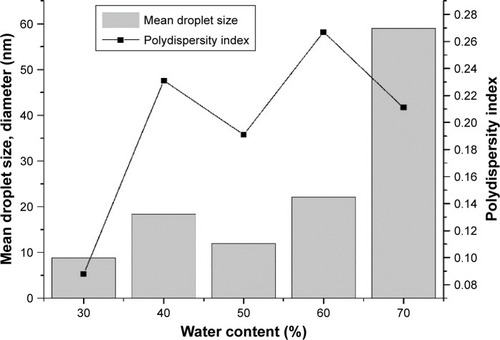
The effects of water content on mean droplet size and size distribution of microemulsions are shown in . There were distinct differences in the amount of water required to achieve the smallest droplets. At a constant OSR, decreasing water concentration from 70% to 30% had a tendency to produce smaller droplets and narrower size distribution. The smallest droplets (diameter ~8.861 nm) and minimum size distribution (PDI 0.088) were formed at 30% water concentration. The mean particle diameter decreased slightly from 40% to 30% water, remained relatively low from 40% to 50% water, increased slightly from 50% to 60% water, and finally increased steeply from 60% to 70% water. The width of PDI values increased with increasing water concentration (from 30% to 40% water), but the trend was similar to that obtained for size distribution between 40% and 70% water. Our results are consistent with research showing that particle size increases with increasing water content.Citation60 Increasing water content eliminates rigid film, leading to coalescence of droplets and increased particle size.Citation58
Figure 7 Effect of water content on mean droplet size and polydispersity index.
Fitting response surface models
shows the experimental data for each response variable under different independent variables, according to the CCD matrix. Response surface models allow for the prediction of variations in particle size and PDI values in terms of nanoemulsion composition. The estimated regression coefficients, R2, adjusted R2, regression (P-value and F-value), and standard deviation related to the effect of the three independent variables are presented in . The ANOVA in indicates that quadratic polynomial models were adequate for the prediction. The models showed no lack of fit because P-values for the particle size and PDI (0.1592 and 0.7885, respectively) were >0.05. Insignificant lack of fit, together with the high R2 and Ra2 values, indicated that the quadratic equation was capable of representing the system under the given experimental domain.
Table 6 ANOVA for the model
The response surface analysis indicated that the second-order polynomial response model for particle size had higher coefficient value (R2=0.9731) than the response surface model for PDI (R2=0.9901). Observations showed that more than 90% of response variations of independent variables (particle size and PDI) were able to be adequately explained by the RSM model. It should be mentioned that nonsignificant (P<0.05) linear terms were included in the final reduced model if quadratic or interaction terms containing these variables were found to be significant (P<0.05).Citation61 The significance of the model and each coefficient was determined using F-test values and corresponding P-values (). Larger F-values and smaller P-values showed more pronounced effects on the respective response variables.Citation20,Citation62,Citation63 In this study, taking F-values (38.80 and 23.37 for particle size and PDI, respectively) into consideration, two models were found to be significant ().
Table 7 Regression coefficients in final reduced second-order polynomial models
Upon closer observation, the particle-size model showed that all linear term coefficients (X1, X2, X3, X4), quadratic-term coefficients (X12, X22), and interaction parameters (X1X3, X2X4, X3X4) were significant (P<0.05). Water content was the most significant single parameter, and influenced the size of the microemulsion, followed by mixing rate and temperature. The interaction of water amount and mixing rate (X3X4) had a more significant effect than other interactions on the droplet size of the nanoemulsions.
For PDI response, the results showed that the linear term and quadratic term coefficient effects of temperature, addition rate, and water content were significant, as was evident from their respective F- and P-values (). Based on the F-value obtained from the ANOVA (), interaction parameters (X2X3, X2X4, and X3X4) showed high levels of significance compared to other terms. However, no significant difference (P>0.05) was observed on the interaction parameters (X1X4) or quadratic term coefficient of mixing rate (X42). Apparently, the proportion of water content was of overriding importance in evaluating the response variations of droplet size and PDI in the studied range. For emulsification by low-energy methods, composition variables have much higher influence than preparation variables.Citation64 Our results agreed with other studies,Citation58,Citation60 which showed that increased water fraction resulted in an increase in particle sizes.
Response surface analysis
3D graphs of the ANOVA were plotted to understand the effect of the independent variables on the response variables. Graphs of the response surface for particle size and size distribution were used to interpret significant interactions (P<0.05) of the models.
Particle size
Generally, production of nanoemulsions with smaller droplet size is highly desirable in pharmaceutical and cosmetic industries because it provides extremely low surface tension for the whole system and the interfacial tension of O/W droplets.Citation22 Particle size is a crucial characteristic of nanoemulsions, influencing bioactive release rate and absorption.Citation65
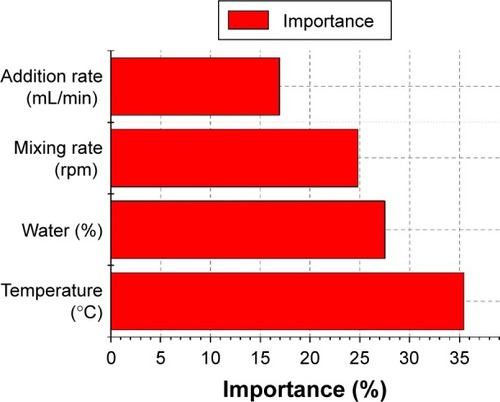
reveals the importance of effective parameters on the particle size of nanoemulsions. Variables with the largest effect on droplet size of nanoemulsions were the linear term of water content and the interaction terms of water content and mixing rate, followed by the linear terms of mixing rate, temperature, and addition rate. Water content was one of the important factors affecting droplet size. The response surface graph () indicates that droplet size significantly decreased with decreasing water content. The trend was consistent with those observed in earlier studies that droplet size was degraded at elevated emulsifier content. This could be due to the incomplete coverage of the fixed amount of emulsifier molecules on the newly formed droplets, leading to an increase in the particle size of an emulsion.Citation21,Citation66,Citation67 Moreover, an increase in mixing rate (P<0.05) slightly decreased droplet size (). These results were in good agreement with reports that the influence of mixing rate is more pronounced at high addition rates and that low addition rates and high mixing rates favor the formation of emulsions with small droplet size.Citation53 The mechanism may be partly attributed to the rapid diffusion of surfactant molecules from oil to water.
Figure 8 Importance of effective parameters on particle size of nanoemulsion.
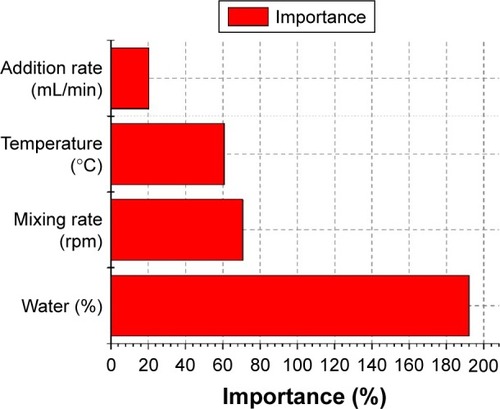
Figure 9 Response surface plots showing significant (P<0.05) interaction effects.
Notes: Droplet size (A–C) and polydispersity index (D–G) as a function of temperature, addition rate, water content, and mixing rate. Variables not shown in each plot were kept constant at the center levels.
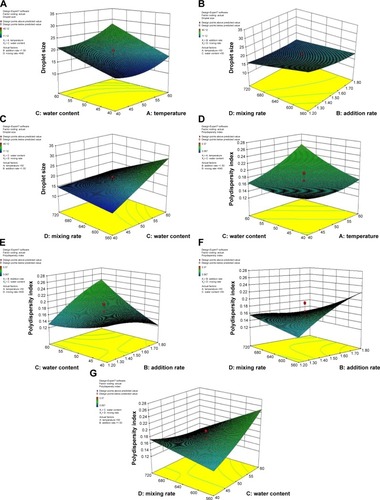
With increasing temperature, droplet size first decreased and then increased (). Temperature played a significant role in affecting the emulsifying properties of nonionic TW80. The thermal deterioration of the emulsifier caused aggregation of neighboring droplets and increased mean droplet size.Citation68 The result was as expected and coincided with the results obtained by Yu et al,Citation45 who found that with increased preparation temperature, interfacial tension decreases due to relatively low interfacial tension and low viscous resistance of the oil phase.
Polydispersity index
As indicated in , interaction effects between addition rate and water content, between addition rate and mixing rate, and between water content and mixing rate exhibited significant (P<0.0001) effects on the PDI, except the interaction effect between temperature and water content, which had the least significant influence on PDI. Response surface graphs () show that PDI was significantly affected by water content, temperature, mixing rate, and addition rate. indicates the importance of the effective parameters on the PDI value of nanoemulsions. shows that the PDI was hardly affected by the combined effect of water content and temperature. shows that the combination of increased mixing rate and water content and the combination of increased mixing rate and addition rate widened the droplet-size distribution of the final emulsion. These results are well supported by previous reportsCitation18,Citation24 on high-pressure emulsification processes. Conversely, shows that the combination of increased water content and addition rate narrow droplet-size distribution.
Figure 10 Importance of effective parameters on polydispersity index of nanoemulsion.
Optimization of nanoemulsion formulation
A nanoemulsion would be considered an optimum formulation if the applied optimization criteria resulted in smallest average droplet size and narrow PDI-value range in the presence of the lowest amount of emulsifier.Citation22 Optimum processing conditions leading to the desired response goals were determined via superimposition of 3D response surfaces and contour plots. After analysis of various interaction effects from different angles and evaluation of optimization constraints, the optimum formulation with the most desirable properties was determined to be 41.49°C temperature, 1.74 mL/min addition rate, 55.08% water content, and 720 rpm mixing rate. Under optimum conditions, the corresponding predicted response value for average droplet size and PDI value were estimated to be 15.51 nm and 0.12, respectively.
Verification of the models
shows the comparison between the experimental and predicted data obtained from the CCD final reduced models. However, the adequacy of the final reduced models in predicting optimum response values was tested by performing the experiment under the recommended optimum conditions.Citation22 Three nanoemulsions were prepared according to the recommended optimal combination levels, and the corresponding values of average emulsion-droplet size and PDI were 15.8 nm and 0.108, respectively. Experimental and predicted values were then compared to verify the validity of the response surface model. Intriguingly, response values from experimental data obtained from a freshly prepared emulsion sample were found to be slightly higher or slightly smaller than predicted, within 10% of predicted error. No significant differences were observed between predicted and actual values, indicating the suitability and sufficiency of the corresponding response-regression equations for relating the responses to independent variables.
Table 8 Experimental and predicted values for response variables obtained from CCD final reduced models
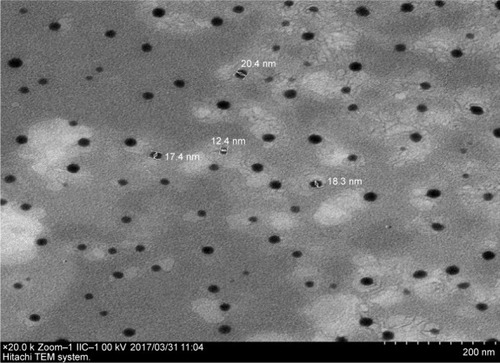
Transmission electron microscopy
TEM () shows that nanoemulsion droplets (black spots on a white background) were spherical and uniform in size, with a large population of smaller droplets of 10–30 nm, similar to the results of droplet-size measurement, which revealed that the experimental values for average emulsion-droplet size and PDI value were 15.80 nm and 0.108, respectively.
Figure 11 Transmission electronic microscopy image of nanoemulsion containing 0.05 wt% of ceramide IIIB.
Note: Magnification 20,000×.
Conclusion
Control of formulation and process parameters in the preparation of nanoemulsions containing ceramide IIIB is crucial for obtaining desirable attributes for effective transdermal delivery. This study showed that RSM was effectively applied to explain and predict the responses of particle size and PDI value of ceramide IIIB-loaded nanoemulsions. Due to the promising results of the present study, we have planned to carry out future studies that evaluate major factors influencing the encapsulation efficiency and stability of ceramide IIIB-containing nanoemulsions and the use of this formulation for dermal delivery of ceramide IIIB.
Acknowledgments
The authors wish to thank Core Facilities for Life Science, Jilin University, for their technical support.
Disclosure
The authors report no conflicts of interest in this work.
Supplementary materials
Figure S1 Pseudoternary phase diagrams of nanoemulsion composed of Tegosoft G20, Tween 80, water, and different cosurfactants.
Notes: (A) Ethanol; (B) propylene glycol; (C) glycerol at Smix ratio of 1:1.
Abbreviation: Smix, surfactant:cosurfactant.
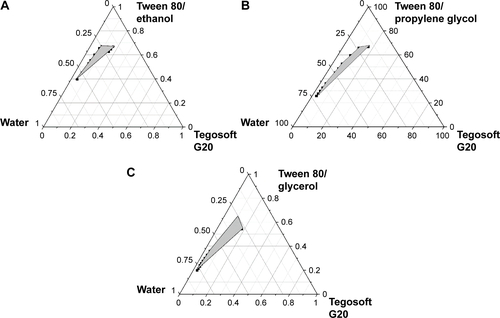
Figure S2 Pseudoternary phase diagrams indicating oil-in-water nanoemulsion regions.
Notes: Tegosoft G20 (oil), water, Tween 80 (surfactant), and glycerol (cosurfactant) at different Smix ratios: (A) 1:0; (B) 1:1; (C) 1:2; (D) 1:3; (E) 2:1; (F) 3:1.
Abbreviation: Smix, surfactant:cosurfactant.
References
- DendaMInfluence of dry environment on epidermal functionJ Dermatol Sci200024Suppl 1S22S2811137392
- LambersJWRoehlELinventorsGist-Brocades BV, assigneeTopical application of ceramidesUnited States patentUS600137519991214
- SondariDHaryonoAHarmamiSBRandyAInfluence of palmitoyl pentapeptide and ceramide III B on the droplet size of nanoemulsionProc SPIE Int Soc Opt Eng2010774377430D
- YukuyamaMNGhisleniDDPintoTJBou-ChacraNANanoemulsion: process selection and application in cosmetics – a reviewInt J Cosmet Sci2016381132426171789
- JafariSMPaximadaPMandalaIAssadpourEMehrniaMAEncapsulation by nanoemulsionsJafariSMNanoencapsulation Technologies for the Food and Nutraceutical IndustriesLondonElsevier20173564
- MasonTGWilkingJNMelesonKChangCBGravesSMNanoemulsions: formation, structure, and physical propertiesJ Phys Condens Matter20061841R635R666
- Luisa Benassi GBaSSIn vitro testing of tensides employing monolayer cultures: a comparison with results of patch tests on human volunteersContact Dermatitis199940138449928803
- MorenoMABallesterosMPFrutosPLecithin-based oil-in-water microemulsions for parenteral use: pseudoternary phase diagrams, characterization and toxicity studiesJ Pharm Sci20039271428143712820147
- ThorsteinssonMVRichterJLeeALDePhillipsP5-Dodecanoylam-inofluorescein as a probe for the determination of critical micelle concentration of detergents using fluorescence anisotropyAnal Biochem2005340222022515840494
- BouchemalKBriançonSPerrierEFessiHNano-emulsion formulation using spontaneous emulsification: solvent, oil and surfactant optimisationInt J Pharm20042801–224125115265563
- Sonneville-AubrunOSimonnetJTL’AlloretFNanoemulsions: a new vehicle for skincare productsAdv Colloid Interface Sci2004108–109145149
- ZhouHYueYLiuGPreparation and characterization of a lecithin nanoemulsion as a topical delivery systemNanoscale Res Lett20095122423020652152
- TadrosTIzquierdoPEsquenaJSolansCFormation and stability of nano-emulsionsAdv Colloid Interface Sci2004108–109303318
- FernandezPAndréVRiegerJKühnleANano-emulsion formation by emulsion phase inversionColloids Surf A Physicochem Eng Asp20042511–35358
- NganCLBasriMLyeFFComparison of process parameter optimization using different designs in nanoemulsion-based formulation for transdermal delivery of fullereneInt J Nanomedicine201494375438625258528
- YolmehMJafariSMApplications of response surface methodology in the food industry processesFood Bioprocess Technol2017103413433
- AzeemARizwanMAhmadFJNanoemulsion components screening and selection: a technical noteAAPS PharmSciTech2009101697619148761
- ZainolSBasriMBasriHBFormulation optimization of a palm-based nanoemulsion system containing levodopaInt J Mol Sci20121310130491306423202937
- TaibSHGaniSSRahmanMZBasriMIsmailAShamsudinRFormulation and process optimizations of nano-cosmeceuticals containing purified swiftlet nestRSC Adv20155534232242328
- KaradagAYangXOzcelikBHuangQOptimization of preparation conditions for quercetin nanoemulsions using response surface methodologyJ Agric Food Chem20136192130213923330985
- MusaSHBasriMMasoumiHRFormulation optimization of palm kernel oil esters nanoemulsion-loaded with chloramphenicol suitable for meningitis treatmentColloids Surf B Biointerfaces201311211311923974000
- TangSYManickamSWeiTKNashiruBFormulation development and optimization of a novel Cremophore EL-based nanoemulsion using ultrasound cavitationUltrason Sonochem201219233034521835676
- HoellerSSpergerAValentaCLecithin based nanoemulsions: a comparative study of the influence of non-ionic surfactants and the cationic phytosphingosine on physicochemical behaviour and skin permeationInt J Pharm20093701–218118619073240
- YilmazEBorchertHHDesign of a phytosphingosine-containing, positively-charged nanoemulsion as a colloidal carrier system for dermal application of ceramidesEur J Pharm Biopharm2005601919815848061
- YaronPNScottAJReynoldsPAMataJPWhiteJWHigh internal phase emulsions under shear: co-surfactancy and shear stabilityJ Phy Chem B20111151957755784
- SaberiAHFangYMcClementsDJEffect of glycerol on formation, stability, and properties of vitamin-E enriched nanoemulsions produced using spontaneous emulsificationJ Colloid Interface Sci201341110511324050638
- SaberiAHFangYMcClementsDJFabrication of vitamin E-enriched nanoemulsions by spontaneous emulsification: effect of propylene glycol and ethanol on formation, stability, and propertiesFood Res Int2013541812820
- NagarajanRWangCCSolution behavior of surfactants in ethylene glycol: probing the existence of a CMC and of micellar aggregatesJ Colloid Interface Sci1996178471482
- AramakiKOlssonUYamaguchiYKuniedaHEffect of water-soluble alcohols on surfactant aggregation in the C12EO8 systemLangmuir1999151962266232
- GradzielskiMEffect of the cosurfactant structure on the bending elasticity in nonionic oil-in-water microemulsionsLangmuir1998142160376044
- YaghmurAAserinAGartiNPhase behavior of microemulsions based on food-grade nonionic surfactants: effect of polyols and short-chain alcoholsColloids Surf A Physicochem Eng Asp200220917181
- MillardJWAlvarez-NúñezFAYalkowskySHSolubilization by cosolvents: establishing useful constants for the log-linear modelInt J Pharm20022451–215316612270252
- SolèIMaestroAGonzalezCSolansCGutiérrezJOptimization of nano-emulsion preparation by low-energy methods in an ionic surfactant systemLangmuir200622208326833216981744
- ShiaoSYChhabraVPatistAChain length compatibility effects in mixed surfactant systems for technological applicationsAdv Colloid Interface Sci1998741–3129
- ChantrapornchaiWClydesdaleFMMcClementsDJInfluence of relative refractive index on optical properties of emulsionsFood Res Int2001349827835
- WoosterTJGoldingMSanguansriPImpact of oil type on nano-emulsion formation and Ostwald ripening stabilityLangmuir20082422127581276518850732
- FluhrJWDarlenskiRSurberCGlycerol and the skin: holistic approach to its origin and functionsBr J Dermatol20081591233418510666
- FluhrJWMao-QiangMBrownBEGlycerol regulates stratum corneum hydration in sebaceous gland deficient (asebia) miceJ Invest Dermatol2003120572873712713573
- RawlingsAHardingCWatkinsonABanksJAckermanCSabinRThe effect of glycerol and humidity on desmosome degradation in stratum corneumArch Dermatol Res19952865457464
- GloorMHow do dermatological vehicles influence the horny layer?Skin Pharmacol Physiol200417626727315528956
- FluhrJWGloorMLehmannLLazzeriniSDistanteFBerardescaEGlycerol accelerates recovery of barrier function in vivoActa Derm Venereol199979641842110598752
- Díaz-BlancasVMedinaDIPadilla-OrtegaEBortolini-ZavalaROlvera-RomeroMLuna-BárcenasGNanoemulsion formulations of fungicide tebuconazole for agricultural applicationsMolecules20162110E127127681721
- LawrenceMJReesGDMicroemulsion-based media as novel drug delivery systemsAdv Drug Deliv Rev20004518912111104900
- ZhangHFengFLiJFormulation of food-grade microemulsions with glycerol monolaurate: effects of short-chain alcohols, polyols, salts and nonionic surfactantsEur Food Res Technol20072263613619
- YuLLiCXuJHaoJSunDHighly stable concentrated nanoemulsions by the phase inversion composition method at elevated temperatureLangmuir20122841145471455222985401
- BorrinTRGeorgesELMoraesICFPinhoSCCurcumin-loaded nanoemulsions produced by the emulsion inversion point (EIP) method: an evaluation of process parameters and physico-chemical stabilityJ Food Eng201616919
- AjithSRakshitKStudies of mixed surfactant microemulsion systems: Brij 35 with Tween 20 and sodium dodecyl sulfateJ Phys Chem199599401477814783
- PrasertWGohtaniSEffect of temperature on low-energy nanoemulsification and phase behavior in water/polyoxyethylene sorbitan fatty acid ester (Tweens)/vegetable oil systemsJ Food Eng2016180101109
- YuanYQZouXWXiongPFEffects of temperature on the emulsification in surfactant-water-oil systemsInt J Mod Phys B2003171427732780
- MagdassiSFrankSGFormation of oil-in-glycerol/water emulsions: effect of surfactant ethylene oxide contentJ Dispers Sci Technol1990115519528
- MagdassiSFrankSGFormation of oil-in-glycerol/water emulsionsJ Dispers Sci Technol198675599612
- McClementsDJRaoJFood-grade nanoemulsions: formulation, fabrication, properties, performance, biological fate, and potential toxicityCrit Rev Food Sci Nutr201151428533021432697
- PeyCMMaestroASoléIGonzálezCSolansCGutiérrezJMOptimization of nano-emulsions prepared by low-energy emulsification methods at constant temperature using a factorial design studyColloids Surf A Physicochem Eng Asp20062881–3144150
- MayerSWeissJMcClementsDJVitamin E-enriched nanoemulsions formed by emulsion phase inversion: factors influencing droplet size and stabilityJ Colloid Interface Sci201340212213023660020
- SaberiAHFangYMcClementsDJFabrication of vitamin E-enriched nanoemulsions: factors affecting particle size using spontaneous emulsificationJ Colloid Interface Sci20133919510223116862
- RezaeeMBasriMRahmanRNSallehABChaibakhshNMasoumiHRA multivariate modeling for analysis of factors controlling the particle size and viscosity in palm kernel oil esters-based nanoemulsionsInd Crops Prod201452506511
- MaaliAMosavianMTHPreparation and application of nanoemulsions in the last decade (2000–2010)J Dispers Sci Technol201334192105
- LiPHChiangBHProcess optimization and stability of D-limonene-in-water nanoemulsions prepared by ultrasonic emulsification using response surface methodologyUltrason Sonochem201219119219721680223
- ChanasattruWDeckerEAMcClementsDJModulation of thermal stability and heat-induced gelation of β-lactoglobulin by high glycerol and sorbitol levelsFood Chem20071032512520
- RezaeeMBasriMRahmanRNSallehABChaibakhshNKarjibanRAFormulation development and optimization of palm kernel oil esters-based nanoemulsions containing sodium diclofenacInt J Nanomedicine2014953954824531324
- MirhosseiniHTanCPTaherianARBooHCModeling the physico-chemical properties of orange beverage emulsion as function of main emulsion components using response surface methodologyCarbohydr Polym2009753512520
- YetilmezsoyKDemirelSVanderbeiRJResponse surface modeling of Pb (II) removal from aqueous solution by Pistacia vera L.: Box-Behnken experimental designJ Hazard Mater20091711–355156219577844
- KhajehMResponse surface modelling of lead pre-concentration from food samples by miniaturised homogenous liquid-liquid solvent extraction: Box-Behnken designFood Chem2011129418321838
- GutiérrezJMGonzálezCMaestroASolèIPeyCMNollaJNano-emulsions: new applications and optimization of their preparationCurr Opin Colloid Interface Sci2008134245251
- ChoHJLeeDWMarasiniNOptimization of self-microemulsifying drug delivery system for telmisartan using Box-Behnken design and desirability functionJ Pharm Pharmacol201365101440145024028611
- KentishSWoosterTJAshokkumarMBalachandranSMawsonRSimonsLThe use of ultrasonics for nanoemulsion preparationInnov Food Sci Emerg Technol200892170175
- JafariSMHeYBhandariBEffectiveness of encapsulating biopolymers to produce sub-micron emulsions by high energy emulsification techniquesFood Res Int2007407862873
- JafariSMAssadpoorEHeYBhandariBRe-coalescence of emulsion droplets during high-energy emulsificationFood Hydrocoll200822711911202