
Abstract
Background
Graphene and graphene-related materials have gained substantial interest from both academia and industry for the development of unique nanomaterials for biomedical applications. Graphene oxide (GO) and silver nanoparticles (AgNPs) are a valuable platform for the development of nanocomposites, permitting the combination of nanomaterials with different physical and chemical properties to generate novel materials with improved and effective functionalities in a single platform. Therefore, this study was conducted to synthesize a graphene oxide–silver nanoparticle (GO-AgNPs) nanocomposite using the biomolecule quercetin and evaluate the potential cytotoxicity and mechanism of GO-AgNPs in human neuroblastoma cancer cells (SH-SY5Y).
Methods
The synthesized GO-AgNPs were characterized using various analytical techniques. The potential toxicities of GO-AgNPs were evaluated using a series of biochemical and cellular assays. The expression of apoptotic and anti-apoptotic genes was measured by quantitative real-time reverse transcription polymerase chain reaction. Further, apoptosis was confirmed by caspase-9/3 activity and a terminal deoxynucleotidyl transferase dUTP nick end labeling assay, and GO-AgNPs-induced autophagy was also confirmed by transmission electron microscopy.
Results
The prepared GO-AgNPs exhibited significantly higher cytotoxicity toward SH-SY5Y cells than GO. GO-AgNPs induced significant cytotoxicity in SH-SY5Y cells by the loss of cell viability, inhibition of cell proliferation, increased leakage of lactate dehydrogenase, decreased level of mitochondrial membrane potential, reduced numbers of mitochondria, enhanced level of reactive oxygen species generation, increased expression of pro-apoptotic genes, and decreased expression of anti-apoptotic genes. GO-AgNPs induced caspase-9/3-dependent apoptosis via DNA fragmentation. Finally, GO-AgNPs induced accumulation of autophagosomes and autophagic vacuoles.
Conclusion
In this study, we developed an environmentally friendly, facile, dependable, and simple method for the synthesis of GO-AgNPs nanocomposites using quercetin. The synthesized GO-AgNPs exhibited enhanced cytotoxicity compared with that of GO at very low concentrations. This study not only elucidates the potential cytotoxicity against neuroblastoma cancer cells, but also reveals the molecular mechanism of toxicity.
Introduction
Neuroblastoma is a childhood cancer, and it is the single most common tumor that occurs primarily in children younger than 5 years. It is also the most common extracranial solid tumor in children and accounts for 15% of pediatric cancer deaths.Citation1 There are ~700 new cases of neuroblastoma each year in the United States.Citation2,Citation3 It is one of the most common and deadly tumors in children.Citation2 Neuroblastoma accounts for 7%–10% of childhood cancers with an annual incidence of 8 per million children younger than 15 years.Citation4–Citation6 Human neuroblastoma SH-SY5Y cells seem to be one of the best in vitro model systems for neuronal studies due to their lack of contamination and capability of proliferating in culture for long periods, a prerequisite for the development of an in vitro cell model. The cells can also be maintained in an undifferentiated state.Citation7–Citation9 SH-SY5Y cells exhibit properties of stem cells and differentiate upon treatment with a variety of agents, including retinoic acid and silver nanoparticles (AgNPs).Citation7,Citation10,Citation11 Consequently, the SH-SY5Y cell line has been widely used in analyses of neuronal differentiation, metabolism, neurodegenerative and neuro-adaptive processes, neurotoxicity, and neuroprotection.Citation6,Citation10,Citation12 Therefore, the selection of classical cellular models is critical to dissect the functional aspects and molecular mechanisms of action of new molecules, potential toxins, or cytotoxic agents.Citation13 Although highly advanced technologies are being developed for many types of cancers, including childhood oncological disorders, children with metastatic neuroblastoma have only a 5%–15% chance of long-term survival.Citation14 Until now, this miserable long-term prognosis has not changed in the past 2 decades. Clearly, neuroblastoma is a tumor for which new treatment approaches are needed. Although a wide spectrum of toxicity studies have been performed in various cancer cell lines with anticancer drugs and different types of nanoparticles, so far no studies have reported the effects of graphene oxide–silver nanoparticles (GO-AgNPs) nanocomposites on human neuroblastoma cells.
Recently, nanotechnology has become an essential and important field tool to develop various kinds of nanoparticles with high surface area to volume ratios and unique properties.Citation15 Among several nanoparticles, AgNPs are the most frequently used nanoparticles in a variety of biomedical applications, including diagnostics, drug delivery, biomarkers, and distinct antibacterial, antifungal, and anti-biofilm agents.Citation16–Citation18 In addition, AgNPs exhibited an anticancer property in various cancer cell lines, such as Dalton’s lymphoma ascites (DLA) cell lines,Citation19 human lung cancer cells,Citation17 human breast cancer cells,Citation20 and human ovarian cancer cells,Citation21 and an antiangiogenic property in endothelial cells.Citation22,Citation23 Similarly, graphene and graphene-related nanomaterials have attracted much interest due to their unique physical and chemical properties, such as their exceptionally large surface area, high electrical conductivity, good thermal stability, and excellent mechanical strength and elasticity,Citation24 and they have been used as anticancer agents and in other biomedical applications, including bio-imaging, gene delivery, tissue engineering, and drug delivery.Citation15 In the development of graphene-related materials for biomedical applications under in vivo conditions, cytotoxicity and biocompatibility studies are indispensable. Therefore, many studies have been dedicated to examining the effects of graphene, GO, and graphene-related nanomaterials in various cell culture systems. For instance, Mullick Chowdhury et alCitation25 reported the toxicity of oxidized graphene nanoribbons in four different cell lines, including HeLa, MCF-7, SKBR3, and NIH3T3, using six different biochemical and cellular assays. The results indicated that the cytotoxicity differs in a dose- and time-dependent manner and also depends on cell type. Similarly, our studies have shown the toxicity of GO and biomolecule-functionalized reduced graphene in various types of cancer and non-cancer cells, including mouse embryonic fibroblast cells,Citation26 human breast cancer cells,Citation27 and human ovarian cancer cells.Citation28 GO induced cytotoxicity in human neuroblastoma SH-SY5Y cells at higher concentrations of 80 μg/mL at 96 h in a dose- and time-dependent manner,Citation29 and GO nanoribbons induced toxicity by generation of reactive oxygen species (ROS), impairment of mitochondrial membrane potential (MMP), and formation of autophagosomes (APs),Citation30 which also depends on the size, charge, surface chemistry, and physical and chemical nature of the synthesized graphene.Citation27,Citation28,Citation31,Citation32 On the other hand, the biocompatibility was analyzed using a variety of chemically and biologically functionalized graphene in several cell lines. For example, GO composites containing Tween-20 and chemically reduced GO showed excellent stability in water and were non-toxic to three different mammalian cell lines, including Vero cells, embryonic bovine cells, and Crandell–Rees feline kidney cells.Citation33 GO reduced with dextran showed significant biocompatibility with HeLa cells.Citation34 Lee et alCitation35 demonstrated that graphene- and GO-coated substrates accelerated mesenchymal stem cell (MSC) adhesion, proliferation, and differentiation. Biologically functionalized graphene showed excellent biocompatibility in various cell lines, such as mouse embryonic fibroblast cells,Citation26 human breast cancer cells,Citation31 and human embryonic kidney (HEK) 293 cells.Citation36
Although both AgNPs and graphene are widely known for their outstanding antimicrobial and anticancer activity in a variety of bacteria and cell lines, respectively, the disadvantage of AgNPs is their strong tendency to aggregate in aqueous solutions and susceptibility to aggregation into large particles owing to their high surface energy, resulting in deterioration of their unique chemical properties and loss of their antibacterial activities.Citation37 However, surfactants can maintain the colloidal stability of AgNPs and also hinder the particles’ surface oxidation.Citation38 This leads to a reduced toxicity to bacterial cells that might be a result of the decreased rate of AgNPs+ ion release.Citation38 Therefore, many researchers are interested in developing distinct and effective antimicrobial, anticancer, or cytotoxic molecules, and GO seems to be an attractive platform for building novel nanocomposites. GO sheets act as support layers to allow the combination of nanomaterials with different properties to produce novel materials with improved or new functionalities, such as increased stability. For example, attachment of AgNPs on the surface of GO sheets can prevent AgNPs from aggregating, allowing a more controlled release of AgNPs+ ions, which eventually can increase antibacterial and anticancer activity.Citation21,Citation37,Citation39–Citation42
Recent studies on basic and translational cancer have been focused on development of novel therapeutic agents targeting multidimensional aspects that contribute to the development and progression of cancers and the resistance of tumors to conventional therapies.Citation43,Citation44 Although several studies have addressed the molecular mechanism of cancer pathogenesis, the process of understanding remains extremely complex, and much is still unknown because of intrinsic resistance and loss of sensitivity to a therapeutic agent.Citation45 Generally, neuroblastoma is sensitive to chemotherapy but eventually develops resistance to chemotherapy. Therefore, developing a novel nanoparticle-mediated therapy is essential and necessary. For instance, nanoparticle-mediated cancer therapy could target cancer stem cells, but it may be linked to treatment resistance of cancer stem cells.Citation46 Considering the available literature, we designed our work with the following objectives. The first objective of this study was to synthesize and characterize the GO–silver nanocomposite using the biomolecule quercetin. The second objective was to evaluate the potential cytotoxicity of GO-AgNP nanocomposites in the human neuroblastoma (SH-SY5Y) cell line, which is commonly used in studies related to neurotoxicity, oxidative stress, and neurodegenerative diseases. The final objective of this study was to determine the mechanism of toxicity of GO-AgNP nanocomposites in the human neuroblastoma cancer cell line (SH-SY5Y).
Materials and methods
Materials
Penicillin–streptomycin solution, trypsin–ethylenediaminetetraacetic acid (EDTA) solution, Dulbecco’s Modified Eagle’s Medium (DMEM), and 1% antibiotic–antimycotic solution were obtained from Life Technologies (Thermo Fisher Scientific, Waltham, MA, USA). Fetal bovine serum (FBS), CCK-8, and an in vitro cell-counting assay kit were purchased from Dojindo (ck04; Rockville, MD, USA). Quercetin, AgNO3, FBS, and the in vitro toxicology assay kit were purchased from Sigma-Aldrich (St Louis, MO, USA). Graphite (Gt) powder, NaOH, KMnO4, NaNO3, anhydrous ethanol, 98% H2SO4, 36% HCl, 30% H2O2 aqueous solution, acetaminophen, and all other chemicals were purchased from Sigma-Aldrich unless otherwise stated.
Synthesis of GO
GO was synthesized as described previously with suitable modifications.Citation26,Citation28,Citation31 In a typical synthesis process, 2 g natural Gt powder was added to 350 mL H2SO4 at 0°C; 8 g KMnO4 and 1 g NaNO3 were added gradually while stirring. The mixture was transferred to a 40°C water bath and stirred for 60 min. Deionized water (250 mL) was slowly added, and the temperature was increased to 98°C. The mixture was maintained at 98°C for 30 min; the reaction was terminated by the addition of 500 mL deionized water and 40 mL 30% H2O2 solution. The color of the mixture changed to brilliant yellow, indicating the oxidation of pristine Gt to Gt oxide. The mixture was filtered and washed with diluted HCl to remove metal ions. The product was washed repeatedly with distilled water until a pH of 7.0 was achieved; the synthesized Gt oxide was further sonicated for 120 min.
Synthesis and characterization of GO-AgNPs nanocomposite
Synthesis and characterization of the GO-AgNPs nanocomposite was followed as described previously.Citation21,Citation37 Synthesized GO-AgNPs nanocomposites were prepared using quercetin. Aqueous solutions of 100 mg GO and 1 mM AgNO3 were used as precursors for the GO-AgNPs nanocomposites. Initially, 100 mg GO was dispersed in 60 mL water by 60 min of sonication. The reaction mixture was prepared in a 250 mL round-bottom flask by dissolving 1 mM AgNO3 in 30 mL water. To this solution, 60 mL of the GO dispersion was added, followed by a quick addition of 10 mL of aqueous 1 mM quercetin. The mixture was stirred at 90°C for 12 h. After 12 h, the reaction was stopped, and the resultant mixture was washed three times with water using centrifugation. The product was obtained as a black powder and used for further experiments.
Cell culture and exposure of SH-SY5Y cells to GO-AgNPs nanocomposite
SH-SY5Y human neuroblastoma cells were obtained from the American Type Culture Collection and were maintained in DMEM supplemented with 2 mM glutamine, 10% FBS, and 1% antibiotic–antimycotic solution.Citation7,Citation8 Cells were grown to confluence at 37°C in a 5% CO2 atmosphere. All experiments were performed in 96-well plates and 100 mm cell culture dishes. The cells were prepared in 100 μL aliquots at a density of 1×10⁵ mL and plated in 96-well plates. After the cells were cultured for 24 h, the medium was replaced with a medium containing GO (0–50 μg/mL) or GO-AgNPs (0–10 μg/mL). After incubation for an additional 24 h, the cells were analyzed for viability. The cells that were not exposed to GO or GO-AgNPs served as controls.
Cell viability assay
The cell viability was measured with a CCK-8 cell-counting assay kit. Briefly, the SH-SY5Y cells were plated on to 96-well flat-bottom culture plates with various concentrations of GO or GO-AgNPs. All cultures were incubated for 24 h at 37°C in a humidified incubator. After 24 h of incubation (37°C and 5% CO2 in a humid atmosphere), 10 μL of CCK-8 reagent was added to each well, and then the plates were incubated for a further 1 h at 37°C. The resulting formazan absorbance was measured at 450 nm with an ELISA reader (Spectra MAX; Molecular Devices LLC, Sunnyvale, CA, USA). The results were expressed as the mean of three independent experiments. Concentrations of GO and GO-AgNPs that showed a 50% reduction in cell viability (ie, IC50 values) were then calculated.
Trypan blue exclusion assay
A trypan blue exclusion assay was performed according to the method described earlier.Citation27 The SH-SY5Y cells were plated in 96-well plates. The cells were treated with various concentrations of GO (10–50 μg/mL) or GO-AgNPs (2–10 μg/mL) for 24 h. After treatment, cells attached to the 96-well plate were washed using phosphate-buffered saline (PBS, pH 7.4) once, trypsinized for 1 min in a 37°C incubator, and then neutralized with FBS-supplemented growth media. The cells were stained using 4% trypan blue to determine live cell numbers. The cell count was performed manually with a hemocytometer.
Membrane integrity
The membrane integrity of SH-SY5Y cells was evaluated according to the manufacturer’s instructions (LDH Cytotoxicity Detection Kit; Takara, Tokyo, Japan). Briefly, cells were exposed to IC50 concentrations of GO (25 μg/mL), GO-AgNPs (5 μg/mL), or doxorubicin (DOX) (1 μg/mL) for 24 h, and 100 μL per well of cell-free supernatant was transferred in triplicate into 96-well plates. Then, 100 μL of the LDH reaction mixture was added to each well. After 3 h incubation under standard conditions, the optical density of the color generated was determined at a wavelength of 490 nm using a microplate reader.
Assessment of dead-cell protease activity
A dead-cell protease activity assay was performed according to the method described earlier.Citation47 The cytotoxicity assay was employed to evaluate the cytotoxicity effects of GO (25 μg/mL), GO-AgNPs (5 μg/mL), or DOX (1 μg/mL) for 24 h on SH-SY5Y cells. The cytotoxicity was determined by association of intracellular protease with a luminogenic peptide substrate (alanyl-alanylphenylalanyl-aminoluciferin). The degree of protease reaction can measure dead-cell protease activity. As a control, we treated cells with 1% Triton X-100 to exclude the background value of the medium color. Luminogenic peptide substrate (5 μL) was added to each well, and luminescence was measured to determine the number of dead cells. The peptide substrate was incubated for 15 min at 37°C. The luminescence was measured with a luminescence counter (PerkinElmer Inc., Waltham, MA, USA).
Analysis of mitochondrial dysfunction
The cells were exposed to GO (25 μg/mL), GO-AgNPs (5 μg/mL), or DOX (1 μg/mL) for 24 h, and then MMP was measured as described previouslyCitation17,Citation46 using the cationic fluorescent indicator JC-1 (Molecular Probes, Eugene, OR, USA). JC-1 is a lipophilic cation, which, in a reaction driven by ΔΨm in normal polarized mitochondria, assembles into a red fluorescence-emitting dimer, forming JC-1-AgNPs aggregates. Cells were incubated with 10 μM JC-1 at 37°C for 15 min, washed with PBS, resuspended in PBS, and then the fluorescence intensity was measured. MMP was expressed as the ratio of the fluorescence intensity of the JC-1 aggregates to that of the monomers.
A mitochondrial dysfunction analysis was also carried out by determining the mitochondria copy number using real-time polymerase chain reaction (PCR) amplification. The cells were treated with GO (25 μg/mL), GO-AgNPs (5 μg/mL), or DOX (1 μg/mL) for 24 h. To determine the copy number, the following primers were used: mitochondrial DNA (mtDNA) forward primer, CCTATCACCCTTGCCATCAT; mtDNA reverse primer, AGNPSGCTGTTGCTTGTGTGAC. To quantify the nuclear DNA, we used a primer set that detects the PECAM gene on chromosome 6 of nuclear DNA: forward primer, ATGGAAAGNPSCCTGCCATCATG; reverse primer, TCCTTGTTGTTCAGNPSCATCAC.Citation48
Determination of ROS
ROS was estimated according to a method described previously.Citation17 Intracellular ROS was measured based on the intracellular peroxide-dependent oxidation of 2′,7′-dichlorodihydrofluorescein diacetate (DCFH-DA; Molecular Probes) to form the fluorescent compound 2′,7′-dichlorofluorescein (DCF), as previously described. The cells were seeded on to 24-well plates at a density of 5×10⁴ cells per well and cultured for 24 h. After washing twice with PBS, fresh medium containing GO (25 μg/mL), GO-AgNPs (5 μg/mL), or DOX (1 μg/mL) was added and incubated for 24 h. The cells were then supplemented with 20 μM DCFH-DA, and the incubation continued for 30 min at 37°C. The cells were rinsed with PBS, and 2 mL of PBS was added to each well. The fluorescence intensity was determined using a spectrofluorometer (Gemini EM; Molecular Devices LLC) with excitation at 485 nm and emission at 530 nm.
Determination of malondialdehyde (MDA)
MDA was measured according to the method described earlier.Citation49 The SH-SY5Y cells were seeded into 6-well microplates at 2.0×10⁶ cells per well. The cells were treated with GO (25 μg/mL), GO-AgNPs (5 μg/mL), or DOX (1 μg/mL) for 24 h. After incubation, the cells were harvested and washed twice with an ice-cold PBS solution. The cells were collected and disrupted by ultrasonication for 5 min on ice. The cell extract (100 μL) was used to detect MDA according to the procedure recommended by the manufacturer of the MDA assay kit. The concentration of MDA was measured on a microplate reader at a wavelength of 530 nm. The protein concentration was determined using the Bio-Rad protein assay kit (Bio-Rad Laboratories Inc., Hercules, CA, USA).
Quantitative reverse transcription polymerase chain reaction (qRT-PCR) assay
Total RNA was extracted from the cells treated with GO (25 μg/mL), GO-AgNPs (5 μg/mL), or DOX (1 μg/mL) for 24 h using the Arcturus PicoPure RNA isolation kit (Arcturus Bioscience, Mountain View, CA, USA), and then samples were prepared according to the manufacturer’s instructions. Real-time RT-PCR was conducted using a Vill7 (Thermo Fisher Scientific) and SYBR Green as the double-stranded DNA-specific fluorescent dye (Thermo Fisher Scientific). Target gene expression levels were normalized to GAPDH expression, which was unaffected by treatment. The RT-PCR primer sets are shown in . Real-time qRT-PCR was performed independently in triplicate for each of the different samples; the data are presented as the mean values of gene expression measured in treated samples versus control.
Table 1 Primers used for quantitative real-time PCR for the analysis of apoptotic, and anti-apoptotic, gene expression
Measurement of caspase-9/3 activity
The measurement of caspase-9/3 activity was performed according to the method described earlier.Citation21 The samples were collected from the cells that were treated with GO (25 μg/mL), GO-AgNPs (5 μg/mL), or DOX (1 μg/mL) for 24 h with and without caspase-3/9 inhibitor for 24 h. The activity of caspase-9/3 was measured in the cancer cells using a kit from Sigma-Aldrich according to the manufacturer’s instructions.
TUNEL assay
Apoptosis induced by GO (25 μg/mL), GO-AgNPs (5 μg/mL), or DOX (1 μg/mL) was determined using the TUNEL assay. Apoptotic cells were determined using a DNA fragmentation imaging kit (Hoffman-La Roche Ltd., Basel, Switzerland) following the manufacturer’s instructions. Briefly, SH-SY5Y cells were cultured in 6-well plates (1.5×10⁶ per well) to study the apoptosis in adherent cells. Cells were treated with GO (25 μg/mL), GO-AgNPs (5 μg/mL), or DOX (1 μg/mL) for 24 h. After the incubation period, the culture medium was aspirated off, and the cell layers were trypsinized. The trypsinized cells were reattached on 0.01% polylysine-coated slides, fixed with 4% methanol-free formaldehyde solution, and stained according to the manufacturer’s instructions for the TUNEL protocol. The stained cells were observed with a Carl Zeiss (Axiovert) epifluorescence microscope using a triple bandpass filter.
Transmission electron microscopy (TEM) analysis of intracellular organelles
TEM analysis was performed to determine the structural integrity of cellular organelles in SH-SY5Y cell lines. The cells were treated with GO (25 μg/mL), GO-AgNPs (5 μg/mL), or DOX (1 μg/mL) for 24 h, harvested, fixed with a mixture of 2% paraformaldehyde and 2.5% glutaraldehyde in 0.2 M PBS for 8 h at pH 7.2, washed six times in PBS, and then post-fixed in 1.33% osmium tetroxide in the same buffer for 1 h at room temperature. After fixation, the cells were incubated with 1% osmium tetroxide in PBS for 2 h. The fixed cells were dehydrated in ascending concentrations of ethanol (70%, 80%, 90%, 95%, and 100%) and embedded in EMbed 812 resins (EMS, Hatfield, PA, USA) via propylene oxide. Ultrathin sections were obtained using an ultramicrotome (Leica Microsystems, Wetzlar, Germany) and were double stained with uranyl acetate and lead citrate. The stained sections on the grids were then examined with an H7000 TEM (Hitachi Ltd., Tokyo, Japan) at 80 kV.
Statistical analyses
All assays were conducted in triplicate, and each experiment was repeated at least three times. The results are presented as mean ± standard deviation. All the experimental data were compared using the Student’s t-test. A P-value <0.05 was considered statistically significant.
Results and discussion
Synthesis and characterization of GO-AgNPs nanocomposite
The large surface area of GO and the direct growth of AgNPs on the GO surface allow synergistic action of the two molecules in a single platform, which is extremely important for antibacterial and anticancer activity. Therefore, we synthesized a GO-AgNPs nanocomposite in the presence of quercetin as a reducing and stabilizing agent. The synthesized GO-AgNPs nanocomposite was characterized by UV-visible spectroscopy. The UV-vis absorption spectrum of the GO sample showed a characteristic band at 230 nm, which corresponds to the electronic π–π* transitions of C–C aromatic bonds and a shoulder at 300 nm, which can be assigned to the n–π* transitions of C=O bonds.Citation37,Citation50 GO-AgNPs nanocomposites exhibited a plasmon absorption band at 230 nm and 420 nm, indicating the presence of AgNPs in the GO dispersion (). As a positive control, we used pure AgNPs, which show emblematic characteristic absorption band at 420 nm. The presence of a band at 420 nm in the GO-AgNPs dispersion is attributed to the surface plasmon resonance of silver nanoparticles in the composite.Citation22,Citation37 The new absorbance peak for AgNPs was near 420 nm and appeared after decoration with AgNPs on the surface of GO, which suggested that the change in the curve at 420 nm for the GO and AgNPs mixture was indicative of successful silver nitrate reduction to AgNPs and their decoration on the surface of GO nanosheets.Citation39,Citation41 This is the characteristic feature of AgNPs due to the plasmon absorption of GO-AgNPs.Citation21 In the case of GO-AgNPs nanocomposites, both types of absorption signals were observed for AgNPs and GO (), and the presence of AgNP and GO peaks within the composite clearly indicated the successful synthesis of GO-AgNPs nanocomposites. Furthermore, UV-vis analysis was performed to demonstrate the spectrum of quercetin, and the spectra of quercetin showed presence of a bathochromic shift of the absorption peaks of the aromatic region of quercetin from 280 nm to 380 nm ().
Figure 1 Characterization of GO and GO-AgNP nanocomposite using UV-visible spectroscopy.
Notes: (A) GO spectra exhibited a maximum absorption peak at ~230 nm corresponding to the π–π transitions of aromatic C–C bonds. A new peak at 420 nm was observed after deposition of AgNPs on the GO surface; the band at 420 nm in the absorption spectrum of the GO-AgNPs is attributed to the surface plasmons and presence of AgNPs. (B) XRD patterns of GO and GO-AgNPs. In the XRD pattern of GO, a strong, sharp peak at 2θ=11.7° corresponds to an interlayer distance of 7.6 Å. The GO-AgNPs showed distinct reflections in the XRD pattern at 31.8 corresponding to the (111) plane of face-centered cubic Ag. (C) FTIR spectra of GO and GO-AgNPs. Dried powders of GO and GO-AgNPs were diluted with KBr to perform FTIR spectroscopy and spectrum GX spectrometry within the range of 500–4,000 cm−1. (D) SEM images of GO and GO-AgNP dispersions at 500 μg/mL. (E) TEM images of GO and GO-AgNPs. (F) Raman spectroscopy analyses of GO and GO-AgNP nanocomposite. Raman spectra of GO and GO-AgNPs were obtained using a laser excitation wavelength of 532 nm at a power of 1 mW after the removal of background fluorescence. At least three independent experiments were performed for each sample, and reproducible results were obtained.
Abbreviations: AgNP, silver nanoparticle; FTIR, Fourier transform infrared; GO, graphene oxide; SEM, scanning electron microscopy; TEM, transmission electron microscopy; XRD, X-ray diffraction.
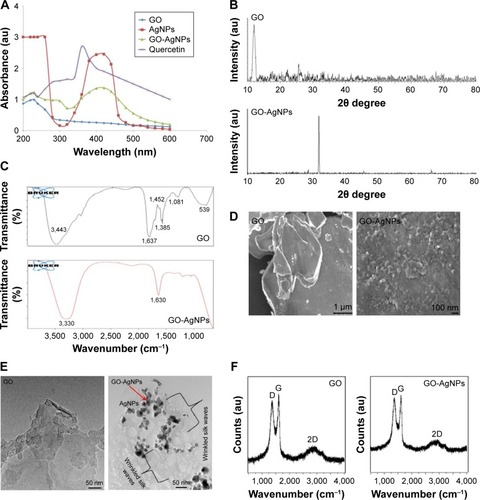
The decoration of AgNPs on the surface of GO was confirmed by X-ray diffraction (XRD) analysis. As shown in , the XRD patterns confirmed the presence of AgNPs on the surface of GO. The broad XRD reflection peak at 11.7° corresponds to an interlayer distance of 7.6 Å (d002) and could be attributed to the diffraction of amorphous GO structures and related to the exfoliation of graphite.Citation51,Citation52 The composite containing AgNPs showed diffraction peaks at 31.8°, which could be indexed to the (111) diffractions of metallic silver, suggesting the formation of metallic silver particles.Citation20 The data obtained from the quercetin-mediated synthesis of GO-AgNPs were consistent with that of pepsin-assisted synthesis of GO-AgNPs.Citation37 Altogether, the results from the XRD data confirmed the presence of AgNPs on the surface of GO sheets. The results are consistent with those of GO-AgNPs produced by other methods, including reduction of AgNO3 with the chemiluminescent reagent luminol in the presence of GO,Citation53 microwave-assisted green synthesis of Ag/reduced GO nanocomposite,Citation54 the solvo-thermal method,Citation55 and pepsin-assisted synthesis of GO-AgNPs.Citation37
Fourier transform infrared (FTIR) spectroscopy was used to analyze the involvement of biomolecules in the synthesis of the GO-AgNPs composite. As shown in , the presence of an absorption band at ~1,637 cm−1 corresponded to the C=C bonding of the aromatic rings of the GO carbon skeleton structure.Citation37 The presence of other oxygenated functional groups was also detected, including OH at ~3,443 cm−1 and 1,385 cm−1 and C–O at 1,081 cm−1. In contrast, there was a significant decrease in the intensity of the absorption bands of the oxygenated functional groups at ~3,330 cm−1 and 1,081 cm−1 for the GO-AgNPs sample. This is probably due to the existence of AgNPs on the surface of GO. These data suggested that the synthesized GO-AgNPs composite is stabilized by a number of quercetin residues through their amine functional groups. Variation of the peak between GO and GO-AgNPs demonstrated the interaction between silver ions and carboxylate groups on the edge of the GO sheets through the formation of a coordination bond or through simple electrostatic attraction.Citation56 Further, we observed that some of the bands were slightly shifted because of the change in the hydrophobic nature of the deoxygenated sample compared with those of the initial GO. Further analysis showed that although the functional group GO was observed in the GO-AgNPs nanocomposite, the peak positions of the functional groups were significantly reduced; particularly, the intensity of C=O carbonyl stretching (1,637 cm−1) and hydroxy-OH (3,443 cm−1) was decreased, and this change proves that there was an interaction between AgNPs and GO.
The surface morphology of GO and the deposition of AgNPs on its surface was confirmed by scanning electron microscopy (SEM) analysis. GO sheets showed a well-packed, folded (with a silky wave-like) morphology formed by the stacking of exfoliated nanosheets.Citation27 The surface morphology resembled a strongly folded curtain, and GO flakes overlapped rather than aggregated. A significant morphological difference was observed between GO and GO-AgNPs (). Distinct, spherical AgNPs were uniformly spread on the surface of the composite nanosheets. The distribution of AgNPs on the GO sheets suggested a homogeneous distribution of AgNPs on the GO sheets. The results obtained from this study indicated significant exfoliation of graphite during the oxidation process and efficient reduction of GO and AgNO3 to GO-AgNPs by quercetin (). Our results are consistent with structural arrangements of GO/silver nanoparticle composites formed by the reduction of AgNO3 and GO in the presence of luminolCitation53 and pepsin.Citation37
TEM analysis was performed to confirm the surface and structural morphology of the successfully prepared GO-AgNPs composites and measure the uniform distribution of AgNPs on the GO sheets.Citation21,Citation37 GO-AgNPs images clearly showed transparent, single-layer sheets containing flake-like wrinkles (), whereas images of AgNPs-decorated GO surfaces showed AgNPs deposited evenly on the GO sheets with an average size of 15±3.0 nm. The presence of wrinkled silk waves on the GO sheets was also observed, which can be attributed to the deposition of AgNPs on the surface of the GO sheets.Citation52 The TEM images of GO-AgNPs showed that the interaction between the AgNPs and GO was significant because most of the AgNPs were distributed uniformly within the GO sheets with an average size of 15 nm.Citation53 Moreover, the GO-AgNPs composite exhibited a flat, smooth surface due to the presence of metallic nanoparticles, and the structure of GO-AgNPs had a thin and smooth surface (). Our findings are consistent with previously reported studies on green synthesis of GO-AgNPs nanocomposites using various molecules, including luminol and tryptophan.Citation53,Citation57 Altogether, our results suggest that biomolecules serve as suitable reducing agents for the synthesis of GO-AgNPs nanocomposites with high solubility and no aggregation. The TEM image of the GO-AgNPs nanocomposite suggested strong interactions between the AgNPs and GO.Citation58 It was clearly demonstrated that AgNPs were anchored around the surface of the GO, and it was concluded that the presence of quercetin catalyzed the reduction of AgNO3 to AgNPs on the GO surface.
Finally, we confirmed the structural property of GO-AgNP nanocomposites by Raman spectroscopy, which is a valuable technique to characterize the structural and electronic properties of GO nanosheets and has previously been used to characterize the disorder, crystal structure, defects, and doping levels of graphite, GO, and graphene-based materials and nanocomposites.Citation59,Citation60 shows that the Raman spectra of GO before and after AgNPs were adsorbed on its surface. Two characteristic D and G bands around 1,374 cm−1 and 1,596 cm−1 were observed, and after the reduction by quercetin, the D and G bands were observed around 1,370 cm−1 and 1,593 cm−1. The D band provides information on the breathing mode of the κ-point, and the G band relates to the tangential stretching mode of the E2g phonon of the sp2 carbon atom.Citation59,Citation60 Interestingly, the ID/IG ratio between GO and GO-AgNPs increased from 1.4 to 1.7 after the decoration of AgNPs on the surface of GO. This indicated that the reduction of GO and AgNO3 in the presence of quercetin was successful. The relative intensity of the two main Raman peaks, D and G, indicated the efficient reduction of GO by quercetin.
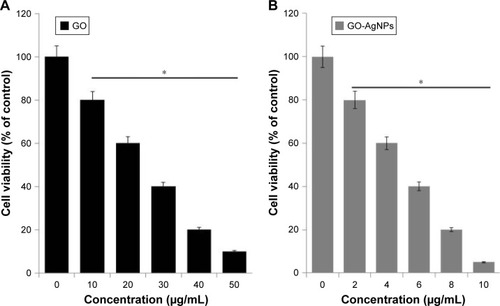
Effect of GO-AgNPs on SH-SY5Y cell viability
In order to evaluate the effect of GO-AgNPs on SH-SY5Y cell viability, cells were treated with various concentrations of GO (10–50 μg/mL) or GO-AgNPs (2–10 μg/mL) for 24 h, and the percentage of cell viability is presented in , respectively. The results showed that both GO and GO-AgNPs reduced the percentage of cell viability in human SH-SY5Y neuroblastoma cells at 24 h in a dose-dependent manner. On the other hand, at a higher IC50 concentration, the GO (25 μg/mL) showed relatively less cytotoxic effects compared to that of GO-AgNPs (5 μg/mL) at 24 h, suggesting that GO requires at least a fivefold higher concentration to cause a reduced percentage of viability similar to that of GO-AgNPs (5 μg/mL). Therefore, the results from our investigation suggested that neuroblastoma cancer cells are more sensitive to GO-AgNPs than GO and that both GO and GO-AgNPs decrease the cell viability in a dose-dependent manner and significantly decrease the number of viable cells with an IC50 of 25 μg/mL and 5 μg/mL, respectively. Similarly, plant extract-assisted synthesized graphene–silver nanocomposites performed significantly better than GO in human ovarian cancer cells,Citation28 and the GO-AgNP nanocomposite was more toxic than pristine GO and pristine AgNPs to both tumoral line macrophages (J774) and peritoneal macrophages.Citation40 Previously, several studies suggested that GO and AgNPs independently and effectively inhibit the cell viability in various types of cancer cells, including human breast cancer cellsCitation20 and human ovarian cancer cells.Citation28 Akhavan et alCitation61 reported the size-dependent toxicity of reduced graphene oxide nanoplatelets (rGONPs) in MSCs. They concluded that the significant loss of cell viability was observed by exposure to 1.0 μg/mL rGONPs with average lateral dimensions (ALDs) of 11±4 nm, while the rGO sheets with ALDs of 3.8±0.4 μm could exhibit a significant cytotoxic effect only at a high concentration of 100 μg/mL after a 1-h exposure time. The loss of cell viability by exposure to graphene materials depends on the size, surface chemistry, charge, and physicochemical properties of the materials. The results from our studies suggested that the stronger cytotoxic effect of GO-AgNPs is due to the synergistic action of both GO and AgNPs in a single platform.
Figure 2 Effects of GO and GO-AgNPs on cell viability of human ovarian cancer cells.
Notes: (A) The viability of human neuroblastoma cancer cells was determined after 24 h exposure to different concentrations of GO (0–50 μg/mL). (B) The viability of human neuroblastoma cancer cells was determined after 24 h exposure to different concentrations of GO-AgNPs (0–10 μg/mL) using the CCK-8 assay. The results are expressed as the mean ± standard deviation of three independent experiments. The treated groups showed statistically significant differences from the control group by the Student’s t-test. *P<0.05.
Abbreviations: AgNP, silver nanoparticle; CCK, cell counting kit; GO, graphene oxide.
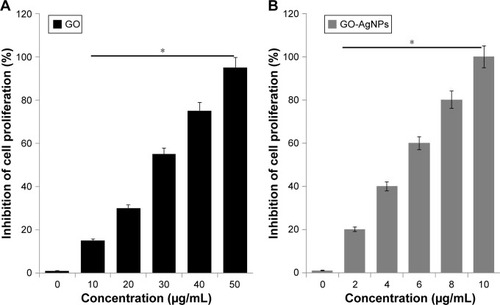
GO-AgNPs influence the proliferation of SH-SY5Y cells
To corroborate the results obtained from the cell viability assay, we performed a trypan blue assay to assess the effect of GO-AgNPs on cell proliferation. The SH-SY5Y cells were treated with increasing doses of GO (25 μg/mL) and GO-AgNPs (5 μg/mL) for 24 h. A concentration-dependent response from GO and GO-AgNPs was observed in the SH-SY5Y cells. As shown in , GO-AgNPs inhibited 50% cell growth even at a low dose of 5 μg/mL. The cell proliferation was significantly reduced to 50% at 25 μg/mL by GO. It was concluded that although both GO and GO-AgNPs inhibited cell growth in a dose-dependent manner, the greatest potential toxicity was observed with GO-AgNPs. Moreover, the trypan blue assay confirmed that GO-AgNPs markedly inhibited cell proliferation in SH-SY5Y cells. Similarly, GO nanoribbons significantly reduced the cell number in the presence of GO (2 μg/mL) after 72 h of incubation.Citation30 In contrast, one study has shown that low concentrations of GO could support embryonic stem cell (ESC) growth, while graphene inhibited the differentiation of ESCs to endoderm, GO promoted their differentiation to endoderm.Citation62 In addition, GO induced neuronal differentiation of neuroblastoma SH-SY5Y cells.Citation29 Our findings suggest that GO-AgNPs composites were able to inhibit proliferation and would not promote proliferation. Therefore, the mechanism of GO on cell proliferation merely depends on the concentration and type of cells, as well as the size, surface charge, surface chemistry, oxidation time, and several other factors. Since the IC50 of GO and GO-AgNPs significantly reduced neuroblastoma viability and growth in cell viability and proliferation assays, this particular concentration of 25 μg/mL and 5 μg/mL was selected to perform further experiments to elucidate the mechanism of toxicity.
Figure 3 Effect of GO-AgNPs on proliferation of human neuroblastoma cancer cells.
Notes: (A) Cell proliferation was observed in the cells treated with GO (25 μg/mL) for 24 h by a trypan blue exclusion assay. (B) Cell proliferation was observed in the cells treated with GO-AgNPs (5 μg/mL) for 24 h by a trypan blue exclusion assay. The results are expressed as the mean ± standard deviation of three independent experiments. The treated groups showed statistically significant differences from the control group by the Student’s t-test. *P<0.05.
Abbreviations: AgNP, silver nanoparticle; GO, graphene oxide.
Cytotoxic effect of GO-AgNPs on SH-SY5Y cells
Cytotoxicity is caused by the adverse actions of nanomaterials on cells. LDH and dead-cell protease activity were used to assess cytotoxicity through comparison of cellular function and/or integrity in control cells and those exposed to GO and GO-AgNPs. We also used a well-known anticancer drug for neuroblastoma cancer, DOX, as a positive control in the following experiments. In order to determine the effect of GO-AgNPs on SH-SY5Y human neuroblastoma cytotoxicity, cells were treated with GO (25 μg/mL), GO-AgNPs (5 μg/mL), and DOX (1 μg/mL) for 24 h. The percentage of LDH released to the culture medium (% LDH released) was measured as indices of cellular death. Cells treated with GO-AgNPs showed an increased percentage of LDH compared with that of untreated cells. Although GO induced LDH leakage, it was not at the level of GO-AgNPs-induced LDH leakage. Similarly, DOX induced an increase in the percentage of LDH released compared with that of control cells. GO-AgNPs treatment caused a loss of cell viability, determined as % LDH released, ranging from 40% to ~50% 24 h after treatment with GO-AgNPs (5 μg/mL) (). Similarly, single-walled carbon nanotubes and GOs induced LDH leakage in a concentration-dependent manner in murine peritoneal macrophages.Citation63
Figure 4 Effect of GO and GO-AgNPs on cytotoxicity in human neuroblastoma cancer cells.
Notes: (A) The cells were treated with GO (25 μg/mL), GO-AgNPs (5 μg/mL), and DOX (1 μg/mL) for 24 h, and LDH activity was measured at 490 nm using the LDH cytotoxicity kit (B) The cells were treated with GO (25 μg/mL), GO-AgNPs (5 μg/mL), and DOX (1 μg/mL) for 24 h, and the dead-cell protease levels were determined by a CytoTox-Glo™ cytotoxicity assay. The results are expressed as the mean ± standard deviation of three independent experiments. The treated groups showed statistically significant differences from the control group by the Student’s t-test. *P<0.05.
Abbreviations: AgNP, silver nanoparticle; Con, control; DOX, doxorubicin; GO, graphene oxide; LDH, lactate dehydrogenase.
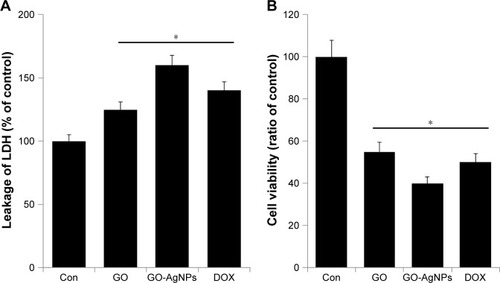
Next, to support the results of the LDH assay, we measured cytotoxicity by dead-cell protease activity. To determine dead-cell protease activity in GO-AgNPs-treated SH-SY5Y cells, the cytotoxicity was represented as a cell viability ratio. The results from this assay showed that the viability of SH-SY5Y treated with GO (25 μg/mL), GO-AgNPs (5 μg/mL), and DOX (1 μg/mL) significantly declined to 45%, 60%, and 50%, respectively (). The result from this cytotoxicity assay confirmed that GO-AgNPs could induce significant toxic effects more effectively than GO in SH-SY5Y cells.
Effect of GO-AgNPs on mitochondrial dysfunction
Mitochondria are essential to maintain physiology, cellular energy balance, synthesis of ATP, and modulation of calcium signaling. Hence, the mitochondria play crucial roles in the induction of cell death.Citation64 Recently, Zhou et alCitation65 found that graphene and graphene-related nanomaterials can interact with the mitochondria, modulating their morphology and function. Therefore, we examined the effect of GO-AgNPs on mitochondrial dysfunction. Among several parameters, determination of MMP is one of the vital factors. Mitochondrial alterations after GO, GO-AgNPs, or DOX treatment were assessed by measuring changes in MMP (Δψm) in the SH-SY5Y cells using the fluorescence probe JC-1. Upon incubation with GO, GO-AgNPs, or DOX, a profound decrease in membrane potential, which was reflected by a decrease in the JC-1 aggregate level and increase in the JC-1 monomer level, was observed in all reagents tested compared with that of the control. We found that the membrane potential reduction caused by GO-AgNPs was comparable with that of DOX. After 24 h of incubation, Δψm was collapsed with GO (35%), GO-AgNPs (65%), and DOX (60%) (). The data showed that both GO-AgNPs and GO treatment caused a remarkable decrease of the aggregate ratio compared with that of the control, which suggested a reduction in MMP. Previously, several studies have reported that AgNPs have a potential impact on various types of cancer cells, including human lung cancer cellsCitation17,Citation66 and male germ cells.Citation67 Other studies showed that exposing cells to GO results in the perturbation of the mitochondrial structure and function, as characterized by a decrease in the MMP and the dysregulation of mitochondrial Ca2+ homeostasis.Citation68,Citation69 Similarly, nano-sized GO, pristine graphene, and graphene quantum dots caused time- and concentration-dependent decreases in the MMP.Citation70,Citation71 Altogether, the data from our findings clearly indicate that GO-AgNPs could cause mitochondrial dysfunction through loss of MMP.
Figure 5 Effect of GO and GO-AgNPs on mitochondrial dysfunction in human neuroblastoma cancer cells.
Notes: (A) The cells were treated with GO (25 μg/mL), GO-AgNPs (5 μg/mL), and DOX (1 μg/mL) for 24 h, and the mitochondrial membrane potential was determined using the cationic fluorescent indicator JC-1. (B) The cells were treated with GO (25 μg/mL), GO-AgNPs (5 μg/mL), and DOX (1 μg/mL) for 24 h, and the mitochondria copy number was determined by real-time PCR. *P<0.05.
Abbreviations: AgNP, silver nanoparticle; Con, control; DOX, doxorubicin; GO, graphene oxide; PCR, polymerase chain reaction.
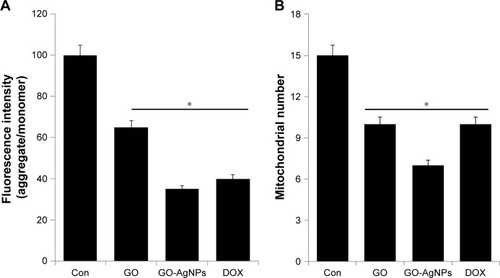
Further, we examined whether GO-AgNPs could influence the number of mitochondria, which could influence the physiology of cells. In order to determine the abnormality and function of mitochondria, the cells were treated with GO (25 μg/mL), GO-AgNPs (5 μg/mL), and DOX (1 μg/mL) for 24 h, and then the mitochondrial abnormality and mtDNA copy number were assessed. Surprisingly, we found that GO-AgNPs-treated cells had lower mtDNA copy numbers compared with that of GO-treated and untreated cells (). The positive control cells that were treated with DOX also showed decreased numbers of mitochondria comparable to that of GO cells. The decreased mtDNA copy number in GO-, GO-AgNPs-, and DOX-treated cells suggested that ROS could be a major player.Citation72 The intracellular ROS could partly regulate mitochondrial network dynamics, which is critical for mitochondrial distribution, density, activity, and size.Citation73 Therefore, we investigated the role of GO-AgNPs on ROS generation.
GO-AgNPs enhance the generation of ROS in SH-SY5Y cells
To determine the correlation between mitochondrial dysfunction and ROS generation in the presence of GO-AgNPs, we measured the level of ROS in GO-AgNPs-treated SH-SY5Y cells. ROS generation has been demonstrated to be responsible for AgNPs- and GO-induced ROS generation.Citation20,Citation28 To determine whether ROS is the mediator of GO-AgNPs-induced apoptosis in SH-SY5Y cells, the cells were treated with GO (25 μg/mL), GO-AgNPs (5 μg/mL), and DOX (1 μg/mL) for 24 h, and ROS levels were measured by DCFH2-DA as described previously.Citation28 As shown in , treatment of cells with GO-AgNPs or DOX stimulated a significant increase of ROS. As we reported earlier, AgNPs are likely to induce ROS generation in various types of cancer cells, including human breast cancer cells, lung cancer cells, ovarian cancer cells, germ cells, and spermatogonial stem cells.Citation17,Citation27,Citation28,Citation67,Citation74 A similar phenomenon was also observed in GO-AgNPs-, and DOX-treated SH-SY5Y cells. Lin et alCitation75 reported that DOX extensively promoted ROS generation in SH-SY5Y cells. Several studies supported that the mechanism of ROS generation is due to the loss of mitochondrial function by graphene toxicity. Li et alCitation76 reported that pristine graphene caused a decrease in the MMP and, consequently, increased levels of intracellular ROS, which activate the mitochondria-dependent apoptotic pathway. On the other hand, GO-AgNPs could target the impairment of ATP production and the overproduction of ROS by decreasing the membrane potential of mitochondria. The evidence from previous studies suggested that GO might act as an electron donor, which increases the supply of electrons to complexes I and II of the electron transport chain (ETC) and accelerates the generation of ROS as a byproduct of mitochondrial respiration.Citation65,Citation77 For instance, mitochondrial depolarization is associated with mitochondrial dysfunction and the overproduction of ROS.Citation68,Citation78 Recently, Mari et alCitation30 reported that GO nanoribbons induced toxicity in human neuroblastoma cancer cell lines such as SK-N-BE(2) and SH-SY5Y. Altogether, the combination of GO and AgNPs in a single platform such as GO-AgNPs could modulate the regulation of mitochondria and increase the generation of ROS.
Figure 6 Effect of GO and GO-AgNPs on ROS generation and MDA levels in human neuroblastoma cancer cells.
Notes: (A) The cells were treated with GO (25 μg/mL), GO-AgNPs (5 μg/mL), and DOX (1 μg/mL) for 24 h. Relative fluorescence of DCF was measured at the excitation wavelength of 485 nm and emission wavelength of 530 nm using a spectrofluorometer. (B) The cells were treated with GO (25 μg/mL), GO-AgNPs (5 μg/mL), and DOX (1 μg/mL) for 24 h. After incubation, the cells were harvested and washed twice with an ice-cold PBS solution. The cells were collected and disrupted by ultrasonication for 5 min on ice. The concentration of MDA was measured on a microplate reader at a wavelength of 530 nm. The results are expressed as the mean ± standard deviation of three independent experiments. The treated groups showed statistically significant differences from the control group by the Student’s t-test. *P<0.05.
Abbreviations: AgNP, silver nanoparticle; Con, control; DCF, 2′,7′-dichlorofluorescein; DOX, doxorubicin; GO, graphene oxide; MDA, malondialdehyde; PBS, phosphate-buffered saline; ROS, reactive oxygen species.
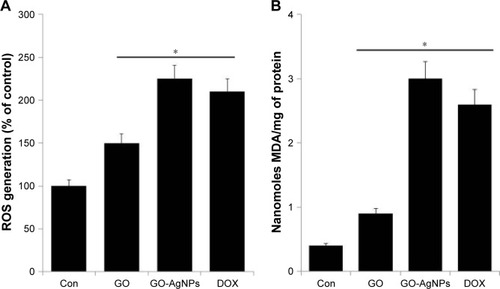
ROS is thought to be a major player in the alteration of macromolecules such as lipids through reactive intermediates that are produced by oxidative stress and can alter the membrane bilayers and cause the lipid peroxidation of polyunsaturated fatty acids (PUFAs).Citation79 The lipid peroxidation and the breakage of lipids with the formation of reactive compounds can lead to changes in the permeability and fluidity of the membrane lipid bilayer and can dramatically alter cell integrity.Citation79,Citation80 The measurement of MDA was used as an important indicator of lipid peroxidation, and it is known as a gauge of carbonyl stress in a variety of cells. To determine the level of MDA, the cells were treated with GO (25 μg/mL), GO-AgNPs (5 μg/mL), and DOX (1 μg/mL) for 24 h, and MDA levels were measured.Citation28 As we expected, the levels of MDA were significantly higher in cells treated with GO-AgNPs than in untreated cells as well as GO-treated cells. The GO-AgNPs nanocomposite increased the level of MDA from 0.5 nmol/mg protein to 3.0 nmol/mg protein, whereas GO and DOX increased the level from 0.4 to 0.9 and 0.4 to 2.6 nmol/mg protein, respectively (). These results suggested that the GO-AgNPs nanocomposite significantly increases the intracellular production of MDA. Wang et alCitation81 reported that MDA in human RPMI 8226 cells increased from 1.6 to 3.1 nmol/mg protein with exposure to 10–200 mg/L GO. Similarly, MCF-7 cells and human ovarian cells treated with AgNPs showed significantly increased levels of MDA.Citation49,Citation82 The combination of GO and AgNPs strongly induced the breakdown of lipids and subsequently increased the level of MDA in SH-SY5Y cells. Collectively, the increased level of MDA could induce carbonyl stress in the cells, which can influence the cell cycle and proliferation of SH-SY5Y cells.
Effect of GO-AgNPs on pro- and anti-apoptotic gene expression
ROS is one of the key players for mitochondria-regulated intrinsic apoptosis. The protection of the integrity of the mitochondrial membrane is afforded by the complex of Bcl-2 proteins, the expression of which regulates the intrinsic apoptosis route.Citation83 It is known that the Bcl-2 family has a key role in determining cell death through mitochondria by activation of Bcl-2 family members, including Bcl-2 and Bcl-xL, and pro-apoptotic proteins such as Bax and Bak. Alteration of membrane permeability is the major responsible factor for mitochondria-mediated apoptosis by activation of caspases, such as caspases-9, -8, and -3.Citation83 Further, several studies strongly suggested that graphene and AgNPs induce apoptosis in p53 and p21 in a dose-dependent manner.Citation49,Citation84 Collec tively, to measure the expression of various genes responsible for GO-AgNPs-induced apoptosis, the SH-SY5Y cells were treated with GO (25 μg/mL), GO-AgNPs (5 μg/mL), and DOX (1 μg/mL) for 24 h, and then we measured the expression using qRT-PCR.
The tumor suppressor p53 is known to play an important role in cell cycle arrest, apoptosis, or senescence and eventually induces DNA damage.Citation85 One of the transcriptional targets of p53 is p21, which can act as a cell cycle inhibitor and functions independently in response to a variety of stresses, including DNA damage.Citation86 Therefore, we chose to investigate the p53-mediated pro-apoptotic effect of GO-AgNPs. The p53 messenger RNA (mRNA) expression levels were significantly higher in GO-AgNPs-treated cells than in untreated cells and GO-treated cells (). Similarly, GO-AgNPs induced the expression of p21 when compared with untreated and GO-treated cells. DOX was used as a positive control, and the results of DOX exposure also suggested that p53 plays an important role in DOX-induced apoptosis. However, the p21 expression level was not significantly higher in GO- and DOX-treated groups compared with that of GO-AgNP-treated groups. This indicates that GO-AgNPs strongly induced apoptosis in SH-SY5Y cells by the activation of both p53 and p21. Cytotoxic agents such as AgNPs, graphene–silver nanocomposites, and DOX could induce p53, and the activation of p53 can upregulate the pro-apoptotic proteins, such as Bax, Bak, or BH3 family members, with direct targeting of mitochondria and neutralization of anti-apoptotic members of the Bcl-2 family, such as Bcl-2 and Bcl-xL3.Citation87
Figure 7 Effect of GO and GO-AgNPs on expression of apoptotic and anti-apoptotic genes in human neuroblastoma cancer cells.
Notes: The cells were treated with GO (25 μg/mL), GO-AgNPs (5 μg/mL), and DOX (1 μg/mL) for 24 h. Relative mRNA expression was analyzed by qRT-PCR in human neuroblastoma cancer cells after the treatments. The results are expressed as the mean ± standard deviation of three independent experiments. The treated groups showed statistically significant differences from the control group by the Student’s t-test. *P<0.05.
Abbreviations: AgNP, silver nanoparticle; Con, control; DOX, doxorubicin; GO, graphene oxide; mRNA, messenger RNA; qRT-PCR, quantitative reverse transcription polymerase chain reaction.
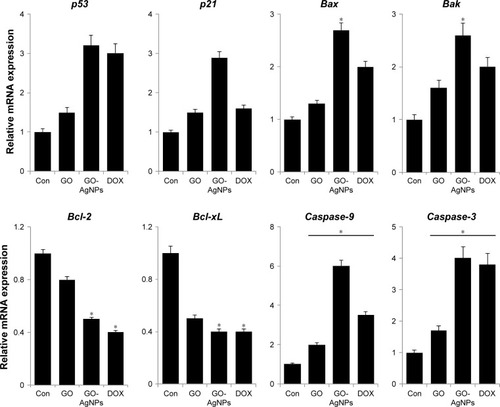
Bax and Bak genes are essential for mitochondrial dysfunction and apoptosis in response to multiple death signals.Citation88 Next, we measured the expression of Bax and Bak. The results suggested that GO-AgNPs significantly upregulate both Bax and Bak (2.7- and 2.6-fold, respectively) compared with untreated cells (). Altogether, these results suggested that Bax/Bak act as a central player in GO-AgNPs-induced apoptosis, which is supported by evidence that the higher Bax/Bak expression level successfully triggered apoptosis via an intrinsic route. Further, to assess the correlation between pro- and anti-apoptotic gene expression, we measured the expression of two candidate genes, Bcl-2 and Bcl-xL. The results suggest that Bcl-2 and Bcl-xL genes were expressed in significantly lower levels in GO- and GO-AgNPs-treated cells than in control cells (). Finally, it was determined whether cell death is mediated by caspases because activation of caspases and apoptosis is tightly regulated in various cellular levels. The results from the expression analysis showed that caspase-9 and caspase-3 levels in the cells exposed to GO (25 μg/mL), GO-AgNPs (5 μg/mL), and DOX (1 μg/mL) were significantly higher than in the control. However, the expression levels of caspase-9/3 were remarkably higher in GO-AgNP-treated cells than in GO-treated cells (). Similarly, graphene and AgNPs induce caspase-3 activity in various types of cancer cells, including human breast cancer cells and human ovarian cancer cells.Citation28,Citation89 Altogether, these results suggest that GO-AgNPs induced apoptosis via a mitochondria-dependent intrinsic pathway as does DOX.
GO-AgNPs activate caspase-9/3
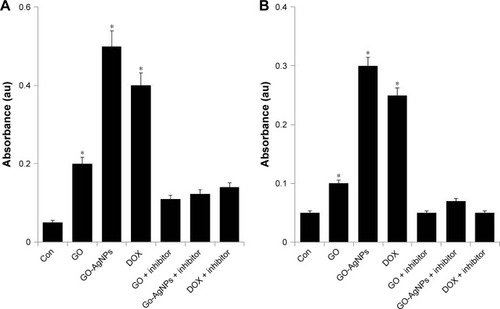
ROS can activate mitochondria- and caspase-dependent apoptotic cell death signaling pathways in both neuronal and non-neuronal cells.Citation90 Several studies reported that caspases (cysteine aspartate-specific proteases) are the molecular initiators of apoptosis.Citation91,Citation92 Previous studies have shown that caspase-9 is activated in response to cytochrome c due to clustering of caspase-9 by Apaf-1 and that this results in activation of caspase-3,Citation93,Citation94 which is the main initiator of caspases. Caspase-3 is a representative cysteine protease that mediates both mitochondria-dependent and -independent apoptotic cell death in response to oxidative stress.Citation95,Citation96 It is generally known that the majority of cytotoxins, anticancer drugs, and nanoparticles induce apoptosis by an intrinsic pathway. Therefore, we examined activation of caspase-9/3 using protein extracts from the SH-SY5Y cells treated with GO (25 μg/mL), GO-AgNPs (5 μg/mL), and DOX (1 μg/mL) for 24 h. As shown in , exposure to GO-AgNPs for 24 h resulted in tenfold increases in caspase-9 enzyme activity compared with that of untreated cells. GO induced fourfold higher caspase-9 enzyme activity compared with that of untreated cells, whereas the caspase-3 activity of GO-AgNPs was sixfold higher than in untreated cells, and GO-induced caspase-3 activity was twofold higher than that of untreated cells (). However, the cells treated with caspase inhibitor completely blocked the activation of caspase-9/3 in the presence of GO, GO-AgNPs, and DOX. Collectively, the caspase-9/3 activity was relatively higher in GO-AgNP-treated cells than in untreated or GO-treated cells, and it induced apoptosis through a caspase-9/3-dependent manner. Similarly, caspase-9/3 activity in DOX-treated cells was significantly higher than in untreated cells and comparable with that of GO- or GO-AgNP-treated cells. Morishima et alCitation97 reported that caspase-9 can also be activated by mechanisms involving neither cyt c release nor Apaf-1 activation, whereas the release of cytochrome c from mitochondria to the cytosol is essential for caspase-3 activation.Citation98 Previously, we have shown that GO and graphene nanocomposites could induce caspase-3 activation in a variety of cancer cell lines, including human breast cancer cellsCitation49 and human ovarian cancer cells.Citation28 Caspase-9 plays an important role in activating effector caspases in response to a variety of death stimuli and mitochondrial cytochrome c release. A previous study also demonstrated that caspase-9 is essential for the apoptotic function of p53 in SH-SY5Y neuroblastoma cells and that p53 mediates DNA-damaging drug-induced apoptosis in SH-SY5Y cells through the mitochondrion/caspase-9 pathway.Citation99 It is well known that DOX induces caspase-3 activation through ROS-mediated regulation in SH-SY5Y cells.Citation75 Collectively, these results suggested that GO-AgNPs could induce the caspase-9/3-dependent pathway in SH-SY5Y cells, which leads to a mitochondria-centered cell death that is mediated by mitochondrial outer membrane permeabilization (MOMP) and results in apoptosome formation, activation of caspase-9, and subsequent activation of effector caspases.Citation100
Figure 8 Effect of GO and GO-AgNPs on caspase-9/3 activity in human neuroblastoma cancer cells.
Notes: (A) The cells were treated with GO (25 μg/mL), GO-AgNPs (5 μg/mL), and DOX (1 μg/mL) for 24 h with and without caspase-9 inhibitor. The concentration of p-nitroanilide released from the substrate was calculated from the absorbance at 405 nm. (B) The cells were treated with GO (25 μg/mL), GO-AgNPs (5 μg/mL), and DOX (1 μg/mL) for 24 h with and without caspase-3 inhibitor. The concentration of p-nitroanilide released from the substrate was calculated from the absorbance at 405 nm. The results are expressed as the mean ± standard deviation of three independent experiments. The treated groups showed statistically significant differences from the control group by the Student’s t-test. *P<0.05.
Abbreviations: AgNP, silver nanoparticle; Con, control; DOX, doxorubicin; GO, graphene oxide.
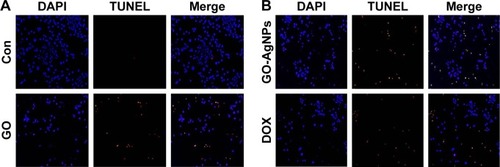
GO-AgNPs induce DNA fragmentation
A variety of stimuli induces apoptosis in multicellular organisms. The apoptotic process is regulated by upstream (initiator) caspases and downstream (effector) caspases. Effector caspases play an important role in initiating the hallmarks of the degradation phase of apoptosis, including DNA fragmentation, cell shrinkage, and membrane blebbing.Citation101,Citation102 The data from previous experiments suggested that ROS play a crucial role in mitochondrial dysfunction and caspase-9/3 activation, and we were interested in examining the role of GO-AgNPs in the final destination of cell death known as DNA fragmentation, which is a parameter to assess cell death. To that end, the SH-SY5Y cells were treated with GO (25 μg/mL), GO-AgNPs (5 μg/mL), and DOX (1 μg/mL) for 24 h. The results indicated that GO-treated cells showed a moderate level of TUNEL-positive cells () when compared with that of GO-AgNPs and DOX-treated cells and significantly higher than control (). However, treatment with GO-AgNPs causes the appearance of a significant higher number of TUNEL-positive cells () when compared to GO and untreated cells, and DOX-treated cells showed almost an equivalent level of TUNEL-positive cells such as GO-AgNPs (). However, it is well known that graphene could induce genotoxicity as reported by Akhavan et al;Citation61 for instance, rGO with a diameter of 11±4 nm could enter the nucleus of the human mesenchymal stem cells (hMSCs) and cause chromosomal aberrations and DNA fragmentation at very low concentrations of 0.1 and 1.0 mg/mL in 1 h. However, rGO sheets with diameters of 3.8±0.4 nm exhibited no notable genotoxicity in hMSCs, even at a high dose of 100 mg/mL after 24 h. Subsequently, Akhavan et alCitation103 observed that reduced GO nanoribbons caused DNA fragmentation and chromosomal aberrations in hMSCs. Previously, we have also shown that reduced GO–silver nanocomposites induced a remarkably higher level of DNA fragmentation compared with that of other nanomaterials tested, such as GO, reduced GO, and AgNPs, in human ovarian cancer cells.Citation21 Collectively, these results suggested that a combination of GO and AgNPs effectively induces apoptosis in SH-SY5Y cells.
Figure 9 Effect of GO and GO-AgNPs on apoptosis in human neuroblastoma cancer cells.
Notes: The cells were treated with GO (25 μg/mL) (A), GO-AgNPs (5 μg/mL), and DOX (1 μg/mL) (B) for 24 h. Apoptosis of human neuroblastoma cancer cells after a 24-h treatment was assessed by the TUNEL assay; the nuclei were counterstained with DAPI. Representative images show apoptotic (fragmented) DNA (red staining) and the corresponding cell nuclei (blue staining). The images are ×100 magnification.
Abbreviations: AgNP, silver nanoparticle; Con, control; DAPI, 4′,6-diamidino-2-phenylindole; DOX, doxorubicin; GO, graphene oxide; TUNEL, terminal deoxynucleotidyl transferase dUTP nick end labeling.
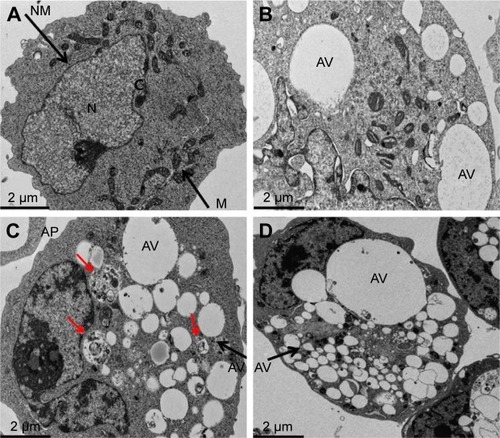
GO-AgNPs induces autophagy
The connection between autophagy and apoptosis is an interesting aspect of nanomaterial use in cancer therapy because both processes are essential to maintain the whole organism and cellular homeostasis, respectively. Therefore, we were interested to study how autophagy acts as an executioner of cell death by ROS production induced by GO-AgNPs. ROS seems to be one of the important factors for induction of autophagy.Citation104,Citation105 Autophagy is an evolutionarily conserved catabolic process involving the formation of APs that engulf cellular macromolecules and organelles, leading to their breakdown following fusion with lysosomes.Citation106–Citation109 The characteristic features of autophagy-mediated cell death, which involves multilayer or double-layer intracellular membrane structures enclosing a bulk of cytoplasmic materials or subcellular organelles, were investigated in the GO-AgNPs-treated cells. The SH-SY5Y cells were treated with GO (25 μg/mL), GO-AgNPs (5 μg/mL), and DOX (1 μg/mL) for 24 h and observed under electron microscopy. The control cells showed nuclei with a regular shape, clear nuclear membranes, and normal, intact mitochondria with significant numbers (). Treatment with GO produced intensive vacuolization of cytoplasm along with significant numbers of mitochondria (), whereas GO-AgNPs-treated cells showed autophagic vacuoles and intensive vacuolization of cytoplasm along with APs, which contain partially digested cytoplasmic material and reduced numbers of mitochondria that were consistent with quantitative determination of mitochondrial number by RT-PCR. In addition, when compared with the unexposed control cells, the GO-AgNPs-treated cells showed many multi-vesicular and membrane-rich APs and significant accumulation of autophagic vacuoles compared with that of GO (). The results of the DOX-treated cells indicated that DOX could induce accumulation of lysosomes at the ultrastructural level (). Similarly, treatment with DOX also produced intensive vacuolization of cytoplasm along with autophagic vacuoles.Citation110 Previously, we have shown that AgNPs were internalized and produced significant cellular morphological changes in human lung cancer cells through generation of ROS.Citation111 Furthermore, another study on the combination of AgNPs and salinomycin also resulted in extensive ROS generation in human ovarian cancer cells, and eventually, the combination induced accumulation of APs and autolysosomes/autophagic vacuoles.Citation81 Consistent with our results, previous studies also reported that GO can enter the cells by interacting with the plasma membrane and probably temporarily disrupting the phospholipid bilayer or causing plasma membrane invagination in HepG2 cells and neuroblastoma cell lines, including SK-N-BE(2) and SH-SY5Y.Citation30,Citation112 Mari et alCitation30 further demonstrated that GO nanoribbons at low concentrations and within 72 h of exposure induced autophagy in neuroblastoma cell lines. Evidence from the presence of cytoplasmic vacuoles, especially in treated SK-N-BE(2) cells, and the induction of the lysosomal proteins LC3 and beclin, which are markers of autophagy, also confirmed that the autophagy is mainly due to ROS induced by GO.Citation63 As described previously, GO could induce dysfunction of autophagy by the accumulation of damaged organelles, such as mitochondria, that can then induce oxidative stress, inflammation, and DNA damage.Citation63,Citation113 Altogether, the data from previous studies and our studies showed that in neuroblastoma SH-SY5Y cells, GO-AgNPs potentially induce initial oxidative stress and mitochondrial damage to which cells respond by activating the autophagy process in order to remove damaged proteins and mitochondria.Citation30 Collectively, our studies suggested that GO-AgNPs cause stronger toxicity than that of GO, which is due to different physical and chemical properties of GO-AgNPs and the synergistic effect of GO and AgNPs in a single platform. Our studies clearly suggested that the accumulation of APs and autophagic or enlarged vacuoles may be due to the oxidative stress induced by GO-AgNPs. These preliminary data also suggested that GO-AgNPs may interrupt the autophagic pathway and may have important effects in biomedical applications. Although these studies have indicated that GO-AgNPs could induce autophagy and impair the normal functions of cells, further studies are warranted to detail the mechanism of oxidative stress-mediated autophagy in SH-SY5Y cells.
Figure 10 GO- and GO-AgNP-induced accumulation of APs and autophagic vacuoles.
Notes: The cells were treated with (A) control, (B) GO (25 μg/mL), (C) GO-AgNPs (5 μg/mL), and (D) DOX (1 μg/mL) for 24 hours and processed for TEM. GO-AgNPs-treated cells in C showed many multi-vesicular and membrane-rich APs and significant accumulation of autophagic vacuoles compared with that of GO and Con (red arrows).
Abbreviations: AgNP, silver nanoparticle; AP, autophagosome; AV, autophagic vacuoles; C, cytoplasm; Con, control; DOX, doxorubicin; GO, graphene oxide; M, mitochondria; N, nucleus; TEM, transmission electron microscopy.
Conclusion
In this study, we developed a simple, dependable, facile, and green approach for the synthesis of a GO–silver nanocomposite using quercetin to provide efficient toxicity against human neuroblastoma cancer cells. The cytotoxic potential of the successfully prepared GO-AgNPs nanocomposite was evaluated in neuroblastoma cancer cells (SH-SY5Y) using various biochemical assays, including cell viability, proliferation, LDH leakage, and dead-cell protease activity. Furthermore, the mechanism of cytotoxicity was confirmed by measurements of MMP, ROS generation, and expression of pro- and anti-apoptotic genes. The results suggested that the GO-AgNPs induce remarkable cytotoxicity with high apoptotic performance by loss of cell viability and proliferation, enhanced ROS generation, increased expression of pro-apoptotic genes, and decreased levels of anti-apoptotic genes at lower concentrations compared with that of GO, which could be attributed to the synergistic effect of combining GO and AgNPs in a single platform. Interestingly, the results showed that the decoration of AgNPs on GO nurtures a synergistic effect and enhances cytotoxicity with dramatically reduced concentrations required to inhibit cell viability and enhance cytotoxicity. The combined nanomaterials yielded an efficient synergistic effect, which was higher than the sum of the efficacies of the individual nanomaterials. This novel formulation may aid the development of better anticancer therapeutics and could provide an alternative treatment approach for neuroblastoma that does not require chemotherapy, which causes undesired side effects. Moreover, the synthesis method for this composite is simple and can be extended for large-scale synthesis. Furthermore, this graphene-based composite offers unique advantages as an efficient anticancer agent.
Acknowledgments
This work was supported by the KU-Research Professor Program of Konkuk University. Dr Sangiliyandi Gurunathan was supported by a Konkuk University KU-full-time professorship. This project was funded by the Priority Academic Program Development of Jiangsu Higher Education Institutions (PAPD) and China Postdoctoral Science Foundation (2015M571827/1402001C).
Disclosure
The authors report no conflicts of interest in this work.
References
- WelchCChenYStallingsRLMicroRNA-34a functions as a potential tumor suppressor by inducing apoptosis in neuroblastoma cellsOncogene200726345017502217297439
- SchorNFNeuroblastoma as a neurobiological diseaseJ Neurooncol199941215916610222436
- WagnerLMDanksMKNew therapeutic targets for the treatment of high-risk neuroblastomaJ Cell Biochem20091071465719277986
- AmbrosPFAmbrosIMBrodeurGMInternational consensus for neuroblastoma molecular diagnostics: report from the International Neuroblastoma Risk Group (INRG) Biology CommitteeBr J Cancer200910091471148219401703
- HeckJERitzBHungRJHashibeMBoffettaPThe epidemiology of neuroblastoma: a reviewPaediatr Perinat Epidemiol200923212514319159399
- PosadasISantosPCenaVAcetaminophen induces human neuroblastoma cell death through NFKB activationPLoS One2012711e5016023166834
- DayemAAKimBGurunathanSBiologically synthesized silver nanoparticles induce neuronal differentiation of SH-SY5Y cells via modulation of reactive oxygen species, phosphatases, and kinase signaling pathwaysBiotechnol J20149793494324827677
- ParkJHGurunathanSChoiY-JHanJWSongHKimJ-HSilver nanoparticles suppresses brain-derived neurotrophic factor-induced cell survival in the human neuroblastoma cell line SH-SY5YJ Ind Eng Chem2017476273
- XieHRHuLSLiGYSH-SY5Y human neuroblastoma cell line: in vitro cell model of dopaminergic neurons in Parkinson’s diseaseChin Med J201012381086109220497720
- AgholmeLLindstromTKagedalKMarcussonJHallbeckMAn in vitro model for neuroscience: differentiation of SH-SY5Y cells into cells with morphological and biochemical characteristics of mature neuronsJ Alzheimers Dis20102041069108220413890
- SinghJKaurGTranscriptional regulation of polysialylated neural cell adhesion molecule expression by NMDA receptor activation in retinoic acid-differentiated SH-SY5Y neuroblastoma culturesBrain Res2007115482117499225
- LopesFMSchroderRda FrotaMLJrComparison between proliferative and neuron-like SH-SY5Y cells as an in vitro model for Parkinson disease studiesBrain Res20101337859420380819
- AlberioTLopianoLFasanoMCellular models to investigate biochemical pathways in Parkinson’s diseaseFEBS J201227971146115522314200
- BonillaMACheungNKClinical progress in neuroblastomaCancer Invest19941266446537994599
- GurunathanSKimJHSynthesis, toxicity, biocompatibility, and biomedical applications of graphene and graphene-related materialsInt J Nanomedicine2016111927194527226713
- GurunathanSHanJWKwonDNKimJHEnhanced antibacterial and anti-biofilm activities of silver nanoparticles against Gram-negative and Gram-positive bacteriaNanoscale Res Lett20149137325136281
- GurunathanSJeongJKHanJWZhangXFParkJHKimJHMultidimensional effects of biologically synthesized silver nanoparticles in Helicobacter pylori, Helicobacter felis, and human lung (L132) and lung carcinoma A549 cellsNanoscale Res Lett2015103525852332
- RaiMKDeshmukhSDIngleAPGadeAKSilver nanoparticles: the powerful nanoweapon against multidrug-resistant bacteriaJ Appl Microbiol2012112584185222324439
- SriramMIKanthSBKalishwaralalKGurunathanSAntitumor activity of silver nanoparticles in Dalton’s lymphoma ascites tumor modelInt J Nanomedicine2010575376221042421
- GurunathanSHanJWDayemAAGreen synthesis of anisotropic silver nanoparticles and its potential cytotoxicity in human breast cancer cells (MCF-7)J Ind Eng Chem201319516001605
- GurunathanSHanJWParkJHReduced graphene oxide-silver nanoparticle nanocomposite: a potential anticancer nanotherapyInt J Nanomedicine2015106257627626491296
- GurunathanSLeeKJKalishwaralalKSheikpranbabuSVaidyanathanREomSHAntiangiogenic properties of silver nanoparticlesBiomaterials200930316341635019698986
- KalishwaralalKBanumathiERam Kumar PandianSSilver nanoparticles inhibit VEGF induced cell proliferation and migration in bovine retinal endothelial cellsColloids Surf B Biointerfaces2009731515719481908
- GeimAKNovoselovKSThe rise of grapheneNat Mater20076318319117330084
- Mullick ChowdhurySLalwaniGZhangKYangJYNevilleKSitharamanBCell specific cytotoxicity and uptake of graphene nanoribbonsBiomaterials201334128329323072942
- GurunathanSHanJWEppakayalaVDayemAAKwonDNKimJHBiocompatibility effects of biologically synthesized graphene in primary mouse embryonic fibroblast cellsNanoscale Res Lett20138139324059222
- GurunathanSHanJWEppakayalaVKimJHGreen synthesis of graphene and its cytotoxic effects in human breast cancer cellsInt J Nanomedicine201381015102723687445
- GurunathanSHanJWKimESParkJHKimJHReduction of graphene oxide by resveratrol: a novel and simple biological method for the synthesis of an effective anticancer nanotherapeutic moleculeInt J Nanomedicine2015102951296925931821
- LvMZhangYLiangLEffect of graphene oxide on undifferentiated and retinoic acid-differentiated SH-SY5Y cells lineNanoscale20124133861386622653613
- MariEMardenteSMorganteEGraphene oxide nanoribbons induce autophagic vacuoles in neuroblastoma cell linesInt J Mol Sci20161712E199527916824
- GurunathanSHanJWParkJHEppakayalaVKimJHGinkgo biloba: a natural reducing agent for the synthesis of cytocompatible grapheneInt J Nanomedicine2014936337724453487
- LiaoKHLinYSMacoskoCWHaynesCLCytotoxicity of graphene oxide and graphene in human erythrocytes and skin fibroblastsACS Appl Mater Interfaces2011372607261521650218
- ParkSMohantyNSukJWBiocompatible, robust free-standing paper composed of a TWEEN/graphene compositeAdv Mater201022151736174020496406
- KimYKKimMHMinDHBiocompatible reduced graphene oxide prepared by using dextran as a multifunctional reducing agentChem Commun (Camb)201147113195319721286628
- LeeWCLimCHShiHOrigin of enhanced stem cell growth and differentiation on graphene and graphene oxideACS Nano2011597334734121793541
- GurunathanSWoong HanJKimEKwonDNParkJKKimJHEnhanced green fluorescent protein-mediated synthesis of biocompatible grapheneJ Nanobiotechnology2014124125273520
- SangiliyandiGJung HyunPYun-JungCJae WoongHJin-HoiKSynthesis of graphene oxide-silver nanoparticle nanocomposites: an efficient novel antibacterial agentCurr Nanosci2016126762773
- LokCNHoCMChenRProteomic analysis of the mode of antibacterial action of silver nanoparticlesJ Proteome Res20065491692416602699
- de FariaAFMartinezDSMeiraSMAnti-adhesion and antibacterial activity of silver nanoparticles supported on graphene oxide sheetsColloids Surf B Biointerfaces201411311512424060936
- de LunaLAde MoraesACConsonniSRComparative in vitro toxicity of a graphene oxide-silver nanocomposite and the pristine counterparts toward macrophagesJ Nanobiotechnology2016141226912341
- LiCWangXChenFThe antifungal activity of graphene oxide-silver nanocompositesBiomaterials201334153882389023465487
- XuJSahuSCaoLCarbon nanoparticles as chromophores for photon harvesting and photoconversionChemphyschem201112183604360821997901
- NageshwaranSMajumdarKRussellSHypergammaglobulinemia, normal serum albumin and hypercalcaemia: a case of systemic sarcoidosis with initial diagnostic confusionBMJ Case Rep20122012 pii: bcr0120125478
- RaoVHKandelALynchDA positive feedback loop between HER2 and ADAM12 in human head and neck cancer cells increases migration and invasionOncogene201231232888289821986939
- EdiriwickremaASaltzmanWMNanotherapy for cancer: targeting and multifunctionality in the future of cancer therapiesACS Biomater Sci Eng201512647825984571
- ChoiYJKimEHanJKimJHGurunathanSA novel biomolecule-mediated reduction of graphene oxide: a multifunctional anti-cancer agentMolecules201621337526999102
- JoHJYona KimYParkHWThe unreliability of MTT assay in the cytotoxic test of primary cultured glioblastoma cellsExp Neurobiol201524323524526412973
- ChenHVermulstMWangYEMitochondrial fusion is required for mtDNA stability in skeletal muscle and tolerance of mtDNA mutationsCell2010141228028920403324
- GurunathanSParkJHHanJWKimJHComparative assessment of the apoptotic potential of silver nanoparticles synthesized by Bacillus tequilensis and Calocybe indica in MDA-MB-231 human breast cancer cells: targeting p53 for anticancer therapyInt J Nanomedicine2015104203422226170659
- McAllisterMJLiJ-LAdamsonDHSingle sheet functionalized graphene by oxidation and thermal expansion of graphiteChem Mater2007191843964404
- EdaGLinYYMatteviCBlue photoluminescence from chemically derived graphene oxideAdv Mater201022450550920217743
- StankovichSDikinDAPinerRDSynthesis of graphene-based nanosheets via chemical reduction of exfoliated graphite oxideCarbon200745715581565
- HeYCuiHSynthesis of highly chemiluminescent graphene oxide/silver nanoparticle nano-composites and their analytical applicationsJ Mater Chem2012221890869091
- HsuKCChenDHMicrowave-assisted green synthesis of Ag/reduced graphene oxide nanocomposite as a surface-enhanced Raman scattering substrate with high uniformityNanoscale Res Lett20149119324808800
- HuangLJWangYXTangJGSynthesis of graphene/metal nanocomposite film with good dispersibility via solvothermal methodInt J Electrochem Sci20127111106811075
- BaoQZhangDQiPSynthesis and characterization of silver nanoparticle and graphene oxide nanosheet composites as a bactericidal agent for water disinfectionJ Colloid Interface Sci2011360246347021628064
- YangBLiuZGuoZIn situ green synthesis of silver–graphene oxide nanocomposites by using tryptophan as a reducing and stabilizing agent and their application in SERSAppl Surf Sci20143162227
- HuCLiuYQinJFabrication of reduced graphene oxide and sliver nanoparticle hybrids for Raman detection of absorbed folic acid: a potential cancer diagnostic probeACS Appl Mater Interfaces20135114760476823629451
- FerrariACMeyerJCScardaciVRaman spectrum of graphene and graphene layersPhys Rev Lett2006971818740117155573
- NiyogiSBekyarovaEItkisMESpectroscopy of covalently functionalized grapheneNano Lett201010104061406620738114
- AkhavanOGhaderiEAkhavanASize-dependent genotoxicity of graphene nanoplatelets in human stem cellsBiomaterials201233328017802522863381
- ChenGYPangDWHwangSMTuanHYHuYCA graphene-based platform for induced pluripotent stem cells culture and differentiationBiomaterials201233241842722014460
- WanBWangZXLvQYSingle-walled carbon nanotubes and graphene oxides induce autophagosome accumulation and lysosome impairment in primarily cultured murine peritoneal macrophagesToxicol Lett2013221211812723769962
- ZhangXFLiuZGShenWGurunathanSSilver nanoparticles: synthesis, characterization, properties, applications, and therapeutic approachesInt J Mol Sci2016179E153427649147
- ZhouHZhangBZhengJThe inhibition of migration and invasion of cancer cells by graphene via the impairment of mitochondrial respirationBiomaterials20143551597160724290441
- JeongJKGurunathanSKangMHHypoxia-mediated autophagic flux inhibits silver nanoparticle-triggered apoptosis in human lung cancer cellsSci Rep201662168826867977
- HanJWJeongJKGurunathanSMale- and female-derived somatic and germ cell-specific toxicity of silver nanoparticles in mouseNanotoxicology201610336137326470004
- LammelTBoisseauxPFernandez-CruzMLNavasJMInternalization and cytotoxicity of graphene oxide and carboxyl graphene nanoplatelets in the human hepatocellular carcinoma cell line Hep G2Part Fibre Toxicol2013102723849434
- LiYWuQZhaoYResponse of microRNAs to in vitro treatment with graphene oxideACS Nano2014832100211024512264
- ChatterjeeNEomHJChoiJA systems toxicology approach to the surface functionality control of graphene-cell interactionsBiomaterials20143541109112724211078
- QinYZhouZWPanSTGraphene quantum dots induce apoptosis, autophagy, and inflammatory response via p38 mitogen-activated protein kinase and nuclear factor-kappaB mediated signaling pathways in activated THP-1 macrophagesToxicology2015327627625446327
- SalvioliSBonafeMCapriMMontiDFranceschiCMitochondria, aging and longevity – a new perspectiveFEBS Lett20014921–291311248228
- ParkJLeeJChoiCMitochondrial network determines intracellular ROS dynamics and sensitivity to oxidative stress through switching inter-mitochondrial messengersPLoS One201168e2321121829717
- ZhangXFChoiYJHanJWDifferential nanoreprotoxicity of silver nanoparticles in male somatic cells and spermatogonial stem cellsInt J Nanomedicine2015101335135725733828
- LinXLiQWangYJMorphine inhibits doxorubicin-induced reactive oxygen species generation and nuclear factor kappaB transcriptional activation in neuroblastoma SH-SY5Y cellsBiochem J2007406221522117542780
- LiYLiuYFuYThe triggering of apoptosis in macrophages by pristine graphene through the MAPK and TGF-beta signaling pathwaysBiomaterials201233240241122019121
- DuchMCBudingerGRLiangYTMinimizing oxidation and stable nanoscale dispersion improves the biocompatibility of graphene in the lungNano Lett201111125201520722023654
- HuFWeiFWangYWuBFangYXiongBEGCG synergizes the therapeutic effect of cisplatin and oxaliplatin through autophagic pathway in human colorectal cancer cellsJ Pharmacol Sci20151281273426003085
- BarreraGOxidative stress and lipid peroxidation products in cancer progression and therapyISRN Oncol2012201213728923119185
- DixTAAikensJMechanisms and biological relevance of lipid per-oxidation initiationChem Res Toxicol1993612188448344
- WangFLiuSShenYProtective effects of N-acetylcysteine on cisplatin-induced oxidative stress and DNA damage in HepG2 cellsExp Ther Med2014861939194525371760
- El-SonbatySMFungus-mediated synthesis of silver nanoparticles and evaluation of antitumor activityCancer Nanotechnol201344–5737926069502
- KrishnaSLowICPervaizSRegulation of mitochondrial metabolism: yet another facet in the biology of the oncoprotein Bcl-2Biochem J2011435354555121486225
- ZhangXFGurunathanSCombination of salinomycin and silver nanoparticles enhances apoptosis and autophagy in human ovarian cancer cells: an effective anticancer therapyInt J Nanomedicine2016113655367527536105
- VogelsteinBLaneDLevineAJSurfing the p53 networkNature2000408681030731011099028
- XiaYYangQGongXYeFLiouYCDose-dependent mutual regulation between Wip1 and p53 following UVC irradiationInt J Biochem Cell Biol201143453554421163364
- SchulerMGreenDRTranscription, apoptosis and p53: catch-22Trends Genet200521318218715734577
- WeiMCZongWXChengEHProapoptotic BAX and BAK: a requisite gateway to mitochondrial dysfunction and deathScience2001292551772773011326099
- GurunathanSHanJWEppakayalaVJeyarajMKimJHCytotoxicity of biologically synthesized silver nanoparticles in MDA-MB-231 human breast cancer cellsBiomed Res Int2013201353579623936814
- CarvourMSongCKaulSAnantharamVKanthasamyAKanthasamyAChronic low-dose oxidative stress induces caspase-3-dependent PKCdelta proteolytic activation and apoptosis in a cell culture model of dopaminergic neurodegenerationAnn N Y Acad Sci2008113919720518991865
- SleeEAHarteMTKluckRMOrdering the cytochrome c-initiated caspase cascade: hierarchical activation of caspases-2, -3, -6, -7, -8, and -10 in a caspase-9-dependent mannerJ Cell Biol199914422812929922454
- YuanJShahamSLedouxSEllisHMHorvitzHRThe C. elegans cell death gene ced-3 encodes a protein similar to mammalian interleukin-1 beta-converting enzymeCell19937546416528242740
- LiPNijhawanDBudihardjoICytochrome c and dATP- dependent formation of Apaf-1/caspase-9 complex initiates an apoptotic protease cascadeCell19979144794899390557
- PanGHumkeEWDixitVMActivation of caspases triggered by cytochrome c in vitroFEBS Lett199842611511549598997
- KanthasamyAGKitazawaMKanthasamyAAnantharamVRole of proteolytic activation of protein kinase Cdelta in oxidative stress-induced apoptosisAntioxid Redox Signal20035560962014580317
- UedaSMasutaniHNakamuraHTanakaTUenoMYodoiJRedox control of cell deathAntioxid Redox Signal20024340541412215208
- MorishimaNNakanishiKTakenouchiHShibataTYasuhikoYAn endoplasmic reticulum stress-specific caspase cascade in apoptosis. Cytochrome c-independent activation of caspase-9 by caspase-12J Biol Chem200227737342873429412097332
- SkulachevVPCytochrome c in the apoptotic and antioxidant cascadesFEBS Lett199842332752809515723
- CuiHSchroeringADingHFp53 mediates DNA damaging drug-induced apoptosis through a caspase-9-dependent pathway in SH-SY5Y neuroblastoma cellsMol Cancer Ther20021967968612479364
- BrentnallMRodriguez-MenocalLDe GuevaraRLCeperoEBoiseLHCaspase-9, caspase-3 and caspase-7 have distinct roles during intrinsic apoptosisBMC Cell Biol2013143223834359
- ShiZOFischerMJDe SanctisGTSchuylerMRTesfaigziYIFN-gamma, but not Fas, mediates reduction of allergen-induced mucous cell metaplasia by inducing apoptosisJ Immunol200216894764477111971027
- WooMHakemRSoengasMSEssential contribution of caspase 3/CPP32 to apoptosis and its associated nuclear changesGenes Dev19981268068199512515
- AkhavanOGhaderiEEmamyHAkhavanFGenotoxicity of graphene nanoribbons in human mesenchymal stem cellsCarbon N Y201354419431
- DengYNShiJLiuJQuQMCelastrol protects human neuroblastoma SH-SY5Y cells from rotenone-induced injury through induction of autophagyNeurochem Int20136311923619395
- KiffinRBandyopadhyayUCuervoAMOxidative stress and autophagyAntioxid Redox Signal200681–215216216487049
- GumpJMThorburnAAutophagy and apoptosis: what is the connection?Trends Cell Biol201121738739221561772
- KunduMThompsonCBAutophagy: basic principles and relevance to diseaseAnnu Rev Pathol2008342745518039129
- MizushimaNAutophagy: process and functionGenes Dev200721222861287318006683
- YangZKlionskyDJMammalian autophagy: core molecular machinery and signaling regulationCurr Opin Cell Biol201022212413120034776
- ManovIPollakYBroneshterRIancuTCInhibition of doxorubicin-induced autophagy in hepatocellular carcinoma Hep3B cells by sorafenib – the role of extracellular signal-regulated kinase counteractionFEBS J2011278183494350721790999
- HanJWGurunathanSJeongJKOxidative stress mediated cytotoxicity of biologically synthesized silver nanoparticles in human lung epithelial adenocarcinoma cell lineNanoscale Res Lett20149145925242904
- YuanJGaoHSuiJDuanHChenWNChingCBCytotoxicity evaluation of oxidized single-walled carbon nanotubes and graphene oxide on human hepatoma HepG2 cells: an iTRAQ-coupled 2D LC-MS/MS proteome analysisToxicol Sci2012126114916122157353
- WhiteEDiPaolaRSThe double-edged sword of autophagy modulation in cancerClin Cancer Res200915175308531619706824