
Abstract
Given the novel applications of graphene materials in biomedical and electronics industry, the health hazards of these particles have attracted extensive worldwide attention. Although many studies have been performed on graphene material-induced toxic effects, toxicological data for the effect of graphene materials on the nervous system are lacking. In this study, we focused on the biological effects of graphene oxide (GO) and reduced graphene oxide (rGO) materials on PC12 cells, a type of traditional neural cell line. We found that GO and rGO exerted significant toxic effects on PC12 cells in a dose- and time-dependent manner. Moreover, apoptosis appeared to be a response to toxicity. A potent increase in the number of PC12 cells at G0/G1 phase after GO and rGO exposure was detected by cell cycle analysis. We found that phosphorylation levels of ERK signaling molecules, which are related to cell cycle regulation and apoptosis, were significantly altered after GO and rGO exposure. In conclusion, our results show that GO has more potent toxic effects than rGO and that apoptosis and cell cycle arrest are the main toxicity responses to GO and rGO treatments, which are likely due to ERK pathway regulation.
Introduction
In recent years, the understanding of graphene materials has facilitated their applications in the biomedical field, where they are used as biosensors and delivery carriers, and in gene therapy.Citation1,Citation2 Moreover, graphene oxide (GO), which is chemically exfoliated from oxidized graphite, is a promising material for biological applications. In addition to GO, reduced graphic oxide (rGO), the product obtained by treating GO under reducing conditions to reduce its oxygen content, is also utilized.Citation3 rGO has attracted significant interest in the fields of tissue engineering, molecular imaging, drug/gene delivery,Citation4 and neural interfaces.Citation5,Citation6 Due to the increase in wide applications of GO materials, more safety information should be obtained in an effort to clearly understand how cells respond on exposure to graphene derivatives.
Recent studies have focused on the graphene-induced toxicological profile. An in vivo study showed that after intravenous administration, GO mainly localized in the lung, liver, and spleen, where significant toxic damage was observed.Citation7 Moreover, oxidative stress is believed to be a major toxic response to GO at toxic doses, and the generation of reactive oxygen species (ROS) is considered its main factor.Citation2,Citation8–Citation10 The blood–brain barrier (BBB) has an intricate physical and molecular structure that provides the proper microenvironment for neuronal cell activity to withstand the penetration of foreign matter, including graphene materials. However, in recent decades, the penetration of materials through the BBB, especially nanomaterials, has become possible due to their tiny size. Graphene materials are also believed to translocate into the brain through the BBB.Citation11
Although some toxicological information on graphene materials has been obtained in vitro and in vivo, these data are limited and partial. Moreover, as neurotoxicological information on GO and rGO remains obscure, more research is required. In this study, PC12 cells, a traditional cell line for neuroscience studies, were selected for toxicological analysis. To examine the effects of oxidation state on the toxic response to GO, we detected toxicological differences in GO and rGO materials. Moreover, we found that other biological processes, such as the cell cycle, were impacted by the exposure to GO and rGO, and related molecular mechanisms were explored.
Materials and methods
Material preparation and characterization
GO was purchased from Sigma-Aldrich (CAS Number 763713; St Louis, MO, USA), and rGO was purchased from XFNANO (CAS Number 7440-44-0; Nanjing, People’s Republic of China). GO and rGO nanosheets were characterized by atomic force microscopy (AFM, MFP-3D-S; Asylum Research, Santa Barbara, CA, USA), Raman spectroscopy (Dimension Edge; Bruker Nano Surfaces, Santa Barbara, CA, USA), and zeta-potential and particle size analysis (performed using dynamic light scattering [DLS]) measurements (Zetasizer Nano ZS; Malvern Instruments, Malvern, UK). GO and rGO were dispersed in ultrapure water to prepare stock solutions (500 µg/mL). The stock solution was sonicated for 2 h (40 kHz) and diluted to different concentrations with complete culture medium just prior to cell exposure.
Cell culture
The immortalized PC12 cell line (The Cell Bank of the Shanghai Infrastructure for Public Research and Development of the Chinese Academy of Medical Sciences, Shanghai, People’s Republic of China) was cultured in Dulbecco’s Modified Eagle’s Medium (Thermo Fisher Scientific, Waltham, MA, USA) containing 10% fetal bovine serum (Thermo Fisher Scientific) and 1% antibiotic/antimycotic solution (Thermo Fisher Scientific). Cells were incubated at 37°C with 5% CO2 in a 95% humidified atmosphere, and the culture medium was replaced every other day.
Cell proliferation assay
Cell viability was determined using the cell counting kit-8 (CCK-8) assay (Dojindo Molecular Technologies, Kumamoto, Japan). Cells were seeded in 96-well plates at a density of 5,000 cells/well. GO and rGO nanoparticles (NPs) were added at concentrations of 5, 10, 20, 40, 60, 80, and 100 µg/mL, and the plates were incubated for 6, 12, 24, and 48 h at 37°C with 5% CO2. The control group was left untreated. For the CCK-8 test, 110 µL detection reagent was added to each well, and the 96-well plates were incubated for an additional 2 h at 37°C. To prevent NPs from interfering in this analytical assay, an empty 96-well plate was prepared. The optical density of each well was measured at 450 nm using a microplate reader (SpectraMax M5; Molecular Devices, Sunnyvale, CA, USA). There were six replicates for each treatment.
Annexin V analysis by flow cytometry
Cells were cultured in a 12-well plate at a density of 30,000 cells/well to reach confluency. After treatments with GO and rGO NPs, the cells were washed with 1X phosphate-buffered saline (PBS) and collected using ethylenediaminetetraacetic acid (EDTA)-free trypsin. The cells were resuspended in 1X PBS at a concentration of 25,000 cells/mL and centrifuged at 1,000× g. The cells were then stained with 5 µL fluorescein isothiocyanate-Annexin V and 1 µL propidium iodide (PI; 100 µg/mL) (Invitrogen, Carlsbad, CA, USA) protected from light at room temperature. Finally, the cells were mixed with 400 µL of 1X binding buffer and analyzed immediately by flow cytometry (BD FACSAria III; BD, Franklin Lakes, NJ, USA).
Cell cycle analysis
The Cell Cycle Detection Kit (KeyGen Biotech, Nanjing, People’s Republic of China) was used to detect the DNA content of each cell. PC12 cells were starved for 12 h before treatments with GO and rGO NPs. At the end of the treatment, the cells were collected using 0.25% EDTA/trypsin and washed twice with 1X PBS. Then, 70% ethanol was used to fix the cells at 4°C for 12 h. The cells were incubated with 100 µL of RNase for 30 min at 37°C, and then 400 µL PI was added, followed by incubation at room temperature protected from light for 30 min. Fluorescence values were analyzed by flow cytometry (BD FACSAria III; BD), and the percentage of cells in each phase of the cell cycle (G0/G1, S, and G2/M) was calculated using Modifit.
Confocal microscopy
Cells were seeded on glass coverslips and cultured in the presence of GO and rGO NPs for 24 h. At the end of the treatment, the cells were washed twice with 1X PBS, fixed with 3.7% paraformaldehyde in PBS, permeabilized with 0.1% Triton X-100, and preincubated with PBS containing 5% bovine serum albumin. Then, cells were incubated for 1 h with rhodamine-phalloidin (1:4,000) in the dark, and the cell nuclei were stained with Hoechst 33342 for 20 min and examined using an FV10i confocal microscope (Olympus, Tokyo, Japan).
Western blot analysis
After treatments with GO and rGO NPs, cells were washed twice with PBS, and then lysis buffer (KeyGen Biotech) containing a protease inhibitor and phosphatase inhibitors was added on ice. The cells were scraped and collected into centrifuge tubes, the supernatant was transferred to another tube after centrifugation, and the protein concentration was determined using the bicinchoninic acid (BCA) protein assay (Pierce BCA Protein Assay Kit; Thermo Fisher Scientific). An equal amount of protein (20 µg/well) was separated by 10% sodium dodecyl sulfate polyacrylamide gel electrophoresis. The proteins were transferred to polyvinylidene difluoride membranes (Merck Millipore, Darmstadt, Germany), which were then washed with tris buffered saline, with tween-20 (TBST) (20 mM Tris–HCl, 500 mM NaCl [pH 7.5], and 0.01% Tween-20). The membrane was blocked with TBST containing 5% skim milk for 1 h at room temperature and then incubated overnight with primary antibodies from the ERK pathway kit (No #9911; Cell Signaling Technology, Danvers, MA, USA), including antibodies against p-c-Raf (Ser338), p-MEK1/2 (Ser217/221), p-p44/42 MAPK (Thr202/Tyr204), p-p90RSK (Ser380), and GAPDH, at 4°C. The secondary antibody, IRDye 800CW-conjugated anti-rabbit/mouse IgG, was incubated with the membranes for 1 h at 37°C protected from light. Immunoreactive proteins were detected using the Odyssey infrared imaging system (Li-Cor, Lincoln, NE, USA).
Statistical analysis
Results are represented as the means ± SEM. All data were statistically analyzed by analysis of variance. A homogeneity-of-variance test was performed, and Bonferroni and Dunnett’s T3 tests were used when equal variance was assumed and when there was no homogeneity, respectively. P-values less than 0.05 were considered significant.
Results
Characterization of GO and rGO nanosheets
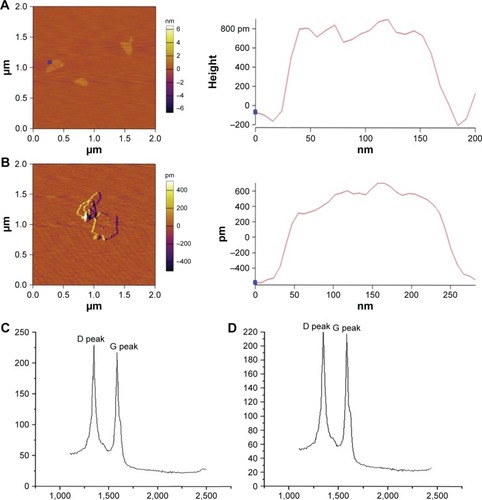
shows the representative AFM images of the GO and rGO samples. Most GO sheets exist as a single layer or as a few layers. The thickness of the GO layer was approximately 0.6 nm, as indicated by AFM measurements, while rGO was thicker (approximately 0.9 nm; ). The GO surface had sags and crests, while rGO surface was more fluent when compared with GO (). The Raman spectra of the GO/rGO materials used in the present study are shown in . The D peak of GO can be located at 1,356.96 cm−1 and that of rGO at 1,345.46 cm−1, while the G peaks of GO and rGO are observed at 1,590.29 and 1,583.45 cm−1, respectively. The dispersity of GO and rGO was determined by zeta potential and DLS measurements. As shown in , the zeta potentials of GO and rGO were −14.3±11.1 and −17.7±7.99 mV, respectively. The average size distributions of these two nanomaterials were 219 and 122.4 nm, respectively.
Table 1 Particle size and zeta potential measurements of GO and rGO
Figure 1 Characterization of GO and rGO nanosheets.
Notes: AFM characterization of the surface topography of (A) GO and (B) rGO. Raman spectroscopy of (C) GO and (D) rGO.
Abbreviations: GO, graphene oxide; rGO, reduced graphene oxide; AFM, atomic force microscopy.
GO and rGO inhibited PC12 proliferation and induced apoptosis
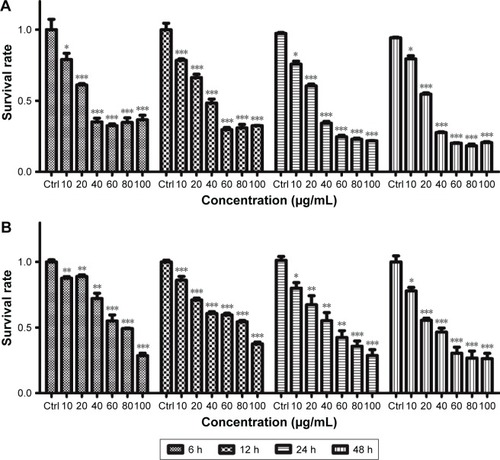
PC12 cell viability was also examined after GO and rGO (0, 10, 20, 40, 60, 80, and 100 µg/mL) treatments (). GO and rGO nanosheets resulted in dose- and time-dependent toxicity in PC12 cells, with GO being more cytotoxic than rGO. The cell viability was dramatically decreased following treatment with 20 µg/mL GO and rGO, and more than 50% of the PC12 cells died when the concentration of GO and rGO increased to 40 and 60 µg/mL.
Figure 2 GO and rGO nanosheets-induced alterations in PC12 cell viability.
Notes: PC12 cells were treated with GO and rGO nanosheets at doses of 0, 10, 20, 40, 60, 80, or 100 µg/mL for 6, 12, 24, or 48 h. Cell viability was determined using the CCK-8 assay: (A) GO NPs and (B) rGO NPs. The results are presented as the mean ± SEM from three independent experiments. *P<0.05, **P<0.01, and ***P<0.001.
Abbreviations: Ctrl, control; GO, graphene oxide; rGO, reduced graphene oxide; CCK-8, cell counting kit-8; NPs, nanoparticles.
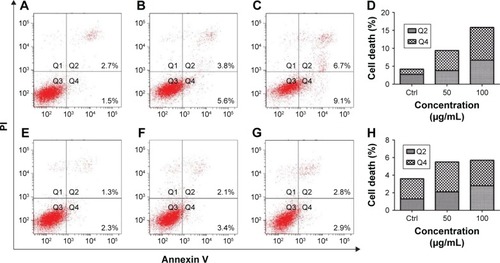
Apoptosis levels were detected after treatments with 50 and 100 µg/mL GO and rGO for 24 h. The results showed that GO treatment induced high levels of apoptosis in a dose-dependent manner, whereas only a slight increase was observed following treatment with rGO, which did not indicate significant apoptosis ().
Figure 3 GO and rGO nanosheets-induced PC12 cell apoptosis.
Notes: PC12 cells were treated with GO and rGO nanosheets at doses of 0, 50, or 100 µg/mL for 24 h: (A and E) control; (B and C) PC12 cells treated with 50 or 100 µg/mL GO NPs. (D) Relative cell death after GO treatment. (F and G) PC12 cells treated with 50 or 100 µg/mL rGO NPs. (H) Relative cell death after rGO treatment.
Abbreviations: Ctrl, control; GO, graphene oxide; rGO, reduced graphene oxide; NPs, nanoparticles; PI, propidium iodide.
GO and rGO induced PC12 cell cycle arrest
Cell proliferation depends on cell cycle progression; one of the most important biological processes, the cell cycle, includes a division phase and an interphase. Cells pass through the G0/G1 phase (quiescence/gap 1) to the S phase (synthesis) and finally to the G2/M phase (gap 2 and mitosis, respectively). Cell division occurs during the mitosis phase (M phase), whereby a single cell divides into two cells. A cell spends more time in interphase than other phases. G1 phase is the presynthetic phase, during which materials are largely produced and energy is stored for the ensuing DNA synthesis, which mainly occurs in S phase. G2 phase comprises the postsynthetic phase, during which mitosis-related RNA and protein synthesis is completed.
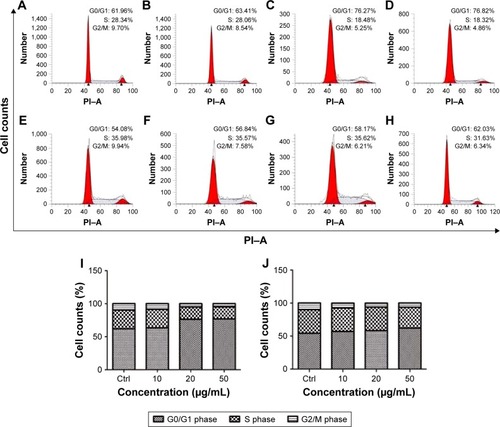
Cell cycle analysis indicated that exposure to either GO or rGO led to the arrest of PC12 cells at the G0/G1 phase of the cell cycle (). The cells appeared normal in both the control and 10 µg/mL treatment groups; however, when cells were exposed to 20 and 50 µg/mL GO or rGO, the number of cells in the G0/G1 phase increased, with a concomitant decrease of cells in S and G2/M phase.
Figure 4 GO and rGO induce PC12 cell cycle arrest.
Notes: (A–D) PC12 cells treated with GO nanosheets at 0, 10, 20, or 50 µg/mL for 24 h. (E–H) PC12 cells treated with rGO nanosheets at 0, 10, 20, or 50 µg/mL for 24 h. (I and J) Cell cycle analysis after GO and rGO treatment, respectively.
Abbreviations: Ctrl, control; GO, graphene oxide; rGO, reduced graphene oxide; PI–A, propidium iodide–Annexin V.
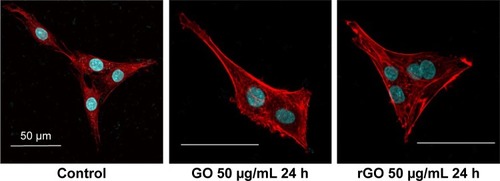
Immunocytochemistry for actin and nuclei () indicated that PC12 cells in the control group retained the ability to divide normally, but abnormal multinucleated cells were observed after the treatments with 50 µg/mL GO and rGO.
Figure 5 Confocal microscopy analysis of GO- and rGO-induced PC12 cell cycle arrest.
Notes: PC12 cells were treated with 50 µg/mL GO and rGO for 24 h. Cells were stained with rhodamine-phalloidin (red) and Hoechst 33342 (blue). Scale bar represents 50 µm.
Abbreviations: GO, graphene oxide; rGO, reduced graphene oxide.
GO and rGO nanosheets induced changes in phosphorylation of ERK pathway proteins
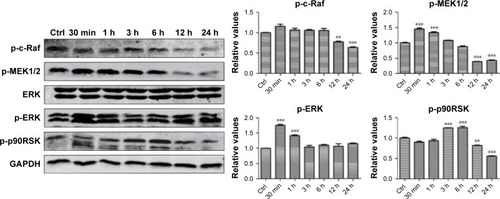
We hypothesized that the GO- and rGO-induced PC12 cell cycle arrest was due to altered phosphorylation levels of ERK pathway molecules, as this pathway plays an important role in cell cycle regulation. Western blot analysis ( and ) revealed significant changes in the phosphorylation levels of related upstream and downstream proteins of the ERK pathway. Following treatment with GO, we observed marked fluctuations in the phosphorylation levels. The level of p-MEK1/2, p-ERK, and p-p90RSK slightly decreased at 30 min or 1 h, which then significantly increased, especially p-MEK1/2 and p-ERK, at 6 h. These phosphorylation levels decreased to those of baseline (p-MEK1/2, p-ERK) or significantly lower than the control group (p-p90RSK). Moreover, a persistent increase in the level of p-c-Raf was observed. For the rGO group, we found results different from those for the GO group. The phosphorylation levels of MEK1/2 and ERK were increased at 30 min and then decreased to base-line (p-ERK) or lower than the control group (p-MEK1/2), whereas the level of p-p90RSK increased at 3 h and then decreased to lower than the control group. The phosphorylation levels of c-Raf, MEK1/2, and p90RSK were lower than those of the control group at 12 and 24 h; however, the level of p-ERK returned to baseline.
Figure 6 ERK phosphorylation levels after treatment with GO nanosheets.
Notes: PC12 cells were treated with GO nanosheets at a dose of 50 µg/mL for 30 min or 1, 3, 6, 12, or 24 h. Total proteins were extracted, and the phosphorylation levels of ERK signaling pathway molecules were analyzed via Western blot. The results are presented as the mean ± SEM from three independent experiments. *P<0.05, **P<0.01, and ***P<0.001 compared with the control.
Abbreviations: Ctrl, control; GO, graphene oxide.
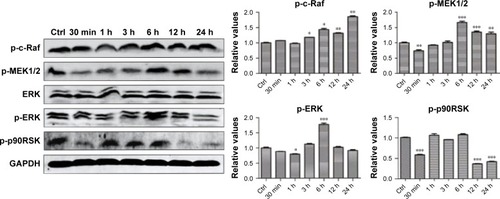
Figure 7 ERK phosphorylation levels after treatment with rGO nanosheets.
Notes: PC12 cells were treated with rGO nanosheets at a dose of 50 µg/mL for 30 min or 1, 3, 6, 12, or 24 h. Total proteins were extracted, and the phosphorylation levels of ERK signaling pathway molecules were analyzed via Western blot. The results are presented as the mean ± SEM from three independent experiments. **P<0.01, and ***P<0.001 compared with the control.
Abbreviations: Ctrl, control; rGO, reduced graphene oxide.
Discussion
Graphene family nanomaterials have been widely used as drug and gene delivery carriers and have been suggested for use in therapy of neurological diseases.Citation12 These nanomaterials may exert differing degrees of toxicity in animals or cell models depending on the administration route or penetration through physiological barriers such as the BBB.Citation11,Citation13,Citation14 However, toxicological information on GO materials remains limited. In this study, we examined the neurotoxic effects of graphene family nanomaterials using the PC12 cell model.
When GO sheets interact with the cell membrane, the materials adhere to and wrap around the cell membrane and insert into the lipid bilayer so that they can be internalized into cells.Citation15–Citation17 The toxicological mechanisms of GO materials revealed in recent studies mostly involve the inflammatory response, oxidative stress, DNA damage, apoptosis, autophagy, and necrosis.Citation18–Citation20 Additional studies that used PC12 cells indicated that graphene and rGO caused reduced cell viability, mitochondrial dysfunction, lactate dehydrogenase release, and ROS generation.Citation2,Citation21 These oxidative stress responses have also been detected in other cells.Citation22 Moreover, apoptosis was observed as a major toxic response, indicating that GO and rGO cause apoptosis in mouse lungs after inhalation,Citation23 and some apoptosis-related proteins were activated following GO exposure in vitro.Citation23,Citation24 In our study, we examined PC12 cell viability using the CCK-8 assay, which revealed that GO and rGO induce a significant decrease in cell viability in both time- and dose-dependent manner, with GO inducing more toxic effects than rGO. We also measured the level of apoptosis in PC12 cells following exposure to GO and rGO, and found that rGO did not cause significant apoptosis at doses of 50 and 100 µg/mL, though strong apoptosis levels were observed following GO exposure at the same doses. Similar results were observed in another study, in which GO caused a greater reduction in cell viability than rGO; the authors attributed these toxicity differences to the physicochemical properties of graphene-based materials, such as the density of functional groups, size, and conductivity.Citation25 In our study, we found no significant size discrepancy between GO and rGO materials. However, the rGO surface was more fluent than that of the GO materials, which was likely one of the main reasons for the differences in toxicity between these two materials.
Considering the decrease in cell viability and apoptosis induced by GO and rGO, we next examined the cell cycle, as cell proliferation is dependent on cell cycle progression. Moreover, cell cycle alteration and apoptosis are in many cases related.Citation26,Citation27 Previous studies have indicated that nanomaterials may lead to arrest of the cell cycle at various phases.Citation28–Citation30 Furthermore, many studies have shown that GO and rGO induce cell cycle arrest at the G0/G1 phase.Citation31–Citation33 In our study, similar results were observed after treatments with GO and rGO at a dose of 50 µg/mL. Moreover, G0/G1 phase arrest was detected following treatment with 20 µg/mL GO, suggesting that GO causes more potent toxic effects than rGO. We also observed a significant decrease in the number of cells at G2/M phase, which may be related to abnormal growth and reveals an altered capacity for mitotic division, as evidenced by the appearance of two or more nuclei in one cell.
Limited data have indicated that GO and rGO induce cell cycle alterations. Matesanz et alCitation32 attributed the GO-induced cell cycle alterations to the location of GO on F-actin filaments because actin microfilaments must be intact for G1 progression, S phase entry, and mitotic division.Citation34 However, the detailed molecular mechanism remains unknown. Therefore, we explored changes in ERK signaling pathway molecules after exposure to 50 µg/mL GO and rGO. As an important protein kinase of the MAPK cascade, ERK controls numerous cellular processes, including proliferation, differentiation, development, stress response, and apoptosis.Citation35 ERK regulates the transmission of many mitogenic and oncogenic signals that result in the promotion of cell proliferation. ERK appears to be required for many cells to pass the G1 restriction point and enter the S phase.Citation36
Several studies have indicated that nanomaterials trigger specific biochemical and biological responses and that these toxic effects are caused by the generation of ROS, which likely induces apoptosis and other signaling pathways such as ERK and AKT (also named PKB).Citation37–Citation39 We hypothesized that GO and rGO induced cell cycle alterations via activation of the ERK signaling pathway. Our results showed altered phosphorylation levels of ERK signaling molecules after GO and rGO exposure. In rGO-treated cells, the phosphorylation levels of MEK1/2, ERK, and p90RSK first showed a significant increase, followed by a decrease to baseline levels (p-ERK) or to levels lower than that of the control group (p-c-Raf, p-MEK1/2, and p-p90RSK). These results showed the strong sequential activation effects of the ERK signaling pathway, which could be initiated as early as 30 min. However, we observed entirely different results for GO: a persistent increase in p-c-Raf began at 3 h, whereas the phosphorylation level of MEK1/2, ERK, and p90RSK increased significantly after an initial decline and ultimately returned to baseline. We attribute these interesting results to the exposure to a toxic dose (50 µg/mL) of GO. Our results indicate that GO at this dose induces significant apoptosis and cell cycle arrest, and this effect is not as strong for rGO. A previous study indicated that the ERK signaling pathway is activated as early as 5 min;Citation40 therefore, we hypothesized that the ERK pathway was activated as early as 30 min after GO exposure and then decreased to baseline after 30 min. However, exposure to GO at this dose caused potent toxic responses, including apoptosis, which likely initiated the ERK signaling pathway again after a 6-h exposure (these effects would not be observed following exposure to rGO, which did not initiate such toxic responses).Citation35 Moreover, these GO- and rGO-induced effects on ERK activation are likely involved in changes throughout the cell cycle and in the cell death pathway.
Conclusion
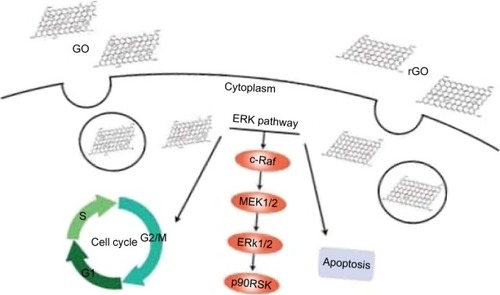
Due to limited toxicological information of GO materials, we examined the neurotoxic effects of the graphene family. Our results indicated that GO exerts more potent toxic effects than rGO, as evidenced by the reduced cell viability and increased apoptosis and cell cycle arrest. We found that the GO- and rGO-induced cell cycle changes and apoptosis are related to the ERK signaling pathway, as illustrated in . As some anticancer treatments are based on cell cycle arrest and induction of apoptosis,Citation41 we believe that the GO- and rGO-induced effects on the cell cycle observed in the present study should be considered in future studies focused on cancer therapy. Moreover, GO and rGO may be used synergistically, which could increase the efficacy of targeted anticancer treatments. Our study provides new insights into the applications of graphene materials in the future, which warrants more attention.
Figure 8 Schematic diagram of the GO and rGO nanosheets-induced effects on PC12 cell cycle arrest and apoptosis.
Note: Graphene nanosheets are endocytosed and activate the ERK signaling pathway to regulate the cell cycle and to induce apoptosis.
Abbreviations: GO, graphene oxide; rGO, reduced graphene oxide.
Acknowledgments
This work was supported by the National Key Research and Development Program of China (2016YFC1102601, 2016YFC1102603), National Natural Science Foundation of China (51672122), and Natural Science Foundation of Guangdong Province (2015A030313299, 2016A030313673).
Disclosure
The authors report no conflicts of interest in this work.
References
- ChungCKimYKShinDRyooSRHongBHMinDHBiomedical applications of graphene and graphene oxideAcc Chem Res201346102211222423480658
- ZhangYAliSFDervishiECytotoxicity effects of graphene and single-wall carbon nanotubes in neural phaeochromocytoma-derived PC12 cellsACS Nano2010463181318620481456
- BiancoAChengHMEnokiTAll in the graphene family – a recommended nomenclature for two-dimensional carbon materialsCarbon201365616
- GoenkaSSantVSantSGraphene-based nanomaterials for drug delivery and tissue engineeringJ Control Release2014173758824161530
- LiNZhangXSongQThe promotion of neurite sprouting and outgrowth of mouse hippocampal cells in culture by graphene substratesBiomaterials201132359374938221903256
- KimSMJooPAhnGTransparent conducting films based on reduced graphene oxide multilayers for biocompatible neuronal interfacesJ Biomed Nanotechnol20139340340823620995
- WangKRuanJSongHBiocompatibility of graphene oxideNanoscale Res Lett20116118
- GollavelliGLingYCMulti-functional graphene as an in vitro and in vivo imaging probeBiomaterials20123382532254522206596
- LiuXSenSLiuJAntioxidant deactivation on graphenic nanocarbon surfacesSmall20117192775278521818846
- HuWPengCLvMProtein corona-mediated mitigation of cytotoxicity of graphene oxideACS Nano2011553693370021500856
- MendonçaMCSoaresESde JesusMBReduced graphene oxide induces transient blood-brain barrier opening: an in vivo studyJ Nanobiotechnology2015137826518450
- VargaMWolffPWolterKJBiocompatibility study of three distinct carbon pastes for application as electrode material in neural stimulations and recordingsJ Mater Sci Mater Med20172823028108958
- LiuYXuLPDaiWDongHWenYZhangXGraphene quantum dots for the inhibition of β amyloid aggregationNanoscale2015745190601906526515666
- MendonçaMCSoaresESde JesusMBPEGylation of reduced graphene oxide induces toxicity in cells of the blood-brain barrier: an in vitro and in vivo studyMol Pharm201613113913392427712077
- XuMZhuJWangFImproved in vitro and in vivo biocompatibility of graphene oxide through surface modification: poly(acrylic acid)-functionalization is superior to PEGylationACS Nano20161033267328126855010
- SasidharanAPanchakarlaLSChandranPDifferential nano-bio interactions and toxicity effects of pristine versus functionalized grapheneNanoscale2011362461246421562671
- KostarelosKNovoselovKSMaterials science. Exploring the interface of graphene and biologyScience2014344618126126324744363
- ChatterjeeNEomHJChoiJA systems toxicology approach to the surface functionality control of graphene-cell interactionsBiomaterials20143541109112724211078
- JaworskiSSawoszEGrodzikMIn vitro evaluation of the effects of graphene platelets on glioblastoma multiforme cellsInt J Nanomedicine2013841342023378763
- LiuYLuoYWuJGraphene oxide can induce in vitro and in vivo mutagenesisSci Rep20133346924326739
- ZhangLXiaJZhaoQLiuLZhangZFunctional graphene oxide as a nanocarrier for controlled loading and targeted delivery of mixed anticancer drugsSmall20106453754420033930
- LuCHZhuCLLiJLiuJJChenXYangHHUsing graphene to protect DNA from cleavage during cellular deliveryChem Commun (Camb)201046183116311820424750
- DuchMCBudingerGRLiangYTMinimizing oxidation and stable nanoscale dispersion improves the biocompatibility of graphene in the lungNano Lett201111125201520722023654
- LiYLiuYFuYThe triggering of apoptosis in macrophages by pristine graphene through the MAPK and TGF-beta signaling pathwaysBiomaterials201233240241122019121
- LiuSZengTHHofmannMAntibacterial activity of graphite, graphite oxide, graphene oxide, and reduced graphene oxide: membrane and oxidative stressACS Nano2011596971698021851105
- SunBGengSHuangXColeusin factor exerts cytotoxic activity by inducing G0/G1 cell cycle arrest and apoptosis in human gastric cancer BGC-823 cellsCancer Lett201130119510521093146
- AlenziFQLinks between apoptosis, proliferation and the cell cycleBr J Biomed Sci200461299102
- JiaLYiyuanKWeiZIon-shedding zinc oxide nanoparticles induce microglial BV2 cell proliferation via the ERK and Akt signaling pathwaysToxicol Sci Epub2017123
- PatelPKansaraKSenapatiVAShankerRDhawanAKumarACell cycle dependent cellular uptake of zinc oxide nanoparticles in human epidermal cellsMutagenesis201631448149027034448
- KimKJJoeYAKimMKSilica nanoparticles increase human adipose tissue-derived stem cell proliferation through ERK1/2 activationInt J Nanomedicine2015102261227225848249
- KhanMKhanMAl-MarriAHApoptosis inducing ability of silver decorated highly reduced graphene oxide nanocomposites in A549 lung cancerInt J Nanomedicine20161187388327022256
- MatesanzMCVilaMFeitoMJThe effects of graphene oxide nanosheets localized on F-actin filaments on cell-cycle alterationsBiomaterials20133451562156923177613
- LinaresJMatesanzMCFeitoMJInfluence of the covalent immobilization of graphene oxide in poly(vinyl alcohol) on human osteoblast responseColloids Surf B Biointerfaces2016138505926650079
- FasshauerMIwigMGlaesserDSynthesis of proto-oncogene proteins and cyclins depends on intact microfilamentsEur J Cell Biol19987731881959860134
- RubinfeldHSegerRThe ERK cascade: a prototype of MAPK signalingMol Biotechnol200531215117416170216
- RyuJMLeeMYYunSPHanHJZinc chloride stimulates DNA synthesis of mouse embryonic stem cells: involvement of PI3K/Akt, MAPKs, and mTORJ Cell Physiol2009218355856718988195
- ApopaPLQianYShaoRIron oxide nanoparticles induce human microvascular endothelial cell permeability through reactive oxygen species production and microtubule remodelingPart Fibre Toxicol20096119134195
- PiaoMJKimKCChoiJYChoiJHyunJWSilver nanoparticles down-regulate Nrf2-mediated 8-oxoguanine DNA glycosylase 1 through inactivation of extracellular regulated kinase and protein kinase B in human Chang liver cellsToxicol Lett2011207214314821925250
- EomHJChoiJOxidative stress of CeO2 nanoparticles via p38-Nrf-2 signaling pathway in human bronchial epithelial cell, Beas-2BToxicol Lett20091872778319429248
- RauchJKolchWMahmoudiMCell type-specific activation of AKT and ERK signaling pathways by small negatively-charged magnetic nanoparticlesSci Rep2012286823162692
- SánchezIDynlachtBDNew insights into cyclins, CDKs, and cell cycle controlSemin Cell Dev Biol200516331132115840440