 ?Mathematical formulae have been encoded as MathML and are displayed in this HTML version using MathJax in order to improve their display. Uncheck the box to turn MathJax off. This feature requires Javascript. Click on a formula to zoom.
Abstract
This work aims to develop a Monte Carlo (MC) model for pinhole K-shell X-ray fluorescence (XRF) imaging of metal nanoparticles using polychromatic X-rays. The MC model consisted of two-dimensional (2D) position-sensitive detectors and fan-beam X-rays used to stimulate the emission of XRF photons from gadolinium (Gd) or gold (Au) nanoparticles. Four cylindrical columns containing different concentrations of nanoparticles ranging from 0.01% to 0.09% by weight (wt%) were placed in a 5 cm diameter cylindrical water phantom. The images of the columns had detectable contrast-to-noise ratios (CNRs) of 5.7 and 4.3 for 0.01 wt% Gd and for 0.03 wt% Au, respectively. Higher concentrations of nanoparticles yielded higher CNR. For 1×10¹¹ incident particles, the radiation dose to the phantom was 19.9 mGy for 110 kVp X-rays (Gd imaging) and 26.1 mGy for 140 kVp X-rays (Au imaging). The MC model of a pinhole XRF can acquire direct 2D slice images of the object without image reconstruction. The MC model demonstrated that the pinhole XRF imaging system could be a potential bioimaging modality for nanomedicine.
Introduction
The development and application of metal nanoparticles (MNPs) have become emerging research areas in medicine, known as nanomedicine. In particular, the applications of MNPs in cancer therapy and diagnosis include for tumor targeting, for drug and gene delivery, as imaging contrast agents, and as radiosensitizers.Citation1–Citation5 Among the various MNPs, gadolinium oxide nanoparticles (GdNPs) and gold nanoparticles (AuNPs) were proven to have the greatest potential for these purposes. For example, GdNPs can provide contrast enhancement for magnetic resonance imaging (MRI).Citation6–Citation8 In addition, there have been efforts to use GdNPs as therapeutic agents for radiation therapy.Citation9,Citation10 More recently, the radiosensitizing properties of GdNPs compared to those of Gd(III) chelates have been studied.Citation11 Among all the MNPs, AuNPs were proven to be a much safer and less toxic sensitizing agent for cancer treatment.Citation12 Since Hainfeld et alCitation13 first experimentally demonstrated the feasibility of using AuNP as a radiosensitizer in 2004, numerous studies on AuNP-enhanced radiation therapy using external X-ray sources, brachytherapy sources, as well as proton and carbon ion beams have been conducted.Citation14–Citation21 The mechanisms of the radiation sensitization effect and methodologies for characterizing such effects have also been investigated.Citation22–Citation24 The low-energy electrons emitted from AuNPs locally deposit their energies in close proximity, which results in physical radiation dose enhancement effect.Citation22–Citation25 In addition, the effects of AuNPs on the biological system (particularly on the cell cycle), metabolic activities, and DNA repair pathways have been reported.Citation22,Citation26–Citation31 The dependency of radiation sensitization on the size, shape, and concentration of AuNPs has also been presented by several studies.Citation23,Citation27,Citation32–Citation36
In order to further develop the nanoparticle-enhanced radiation therapy, monitoring the biological effects and toxicity based on in vivo biodistributions and concentrations of the nanoparticles (NP) in the target and normal tissues must be carried out during preclinical studies.Citation23 However, due to the lack of an effective in vivo imaging tool, there has been a slow progress on further studies in this area.Citation37 X-ray fluorescence (XRF) computed tomography (XFCT) is one of the promising imaging modalities for in vivo imaging.Citation38 XFCT was first proposed in 1986 using synchrotron sources.Citation39 Since polychromatic X-ray sources were made available on the laboratory scale, implementing benchtop fluorescence imaging systems has shown that XFCT could be a potential molecular imaging device similar to positron emission tomography (PET) and single-photon emission computed tomography (SPECT).Citation38 Focusing on K-shell XFCT, 0.5% gold by weight (wt%) was able to be detected using 105 kVp cone-beam X-rays by Jones et al.Citation40 Ahmad et alCitation41 showed images of 0.25 wt% AuNP using 120 kVp pencil-beam X-rays by optimizing the detector angular configuration. Recently, L-shell imaging of AuNP using a benchtop X-ray source has been developed to improve the detection limit on the order of parts per million (ppm).Citation42–Citation44 The previously mentioned studies used a single cadmium-telluride (CdTe) detector and a single silicon drift detector (SDD) for K-shell and L-shell imaging, respectively. However, the image acquisition time was long because it was necessary to rotate the phantoms and translate the detectors to obtain full three-dimensional (3D) images. The research by Meng et alCitation45, Fu et alCitation46, and Groll et alCitation47 demonstrated improved images obtained by the pinhole-based system and 2D position-sensitive detectors computationally and experimentally. In these studies, pinhole collimation with a 2D X-ray charge-coupled device (CCD) camera (Model #934N, Andor Technology), which has a detection efficiency of ~30% at 10 keV and ~15% at 15 keV, was used to detect iron, zinc, and bromine solutions, whose energies of K-shell fluorescence X-rays range from 6.4 keV to 13.3 keV. Very small samples (ie, 0.75 mm diameter cylindrical tubes) were used due to the limited penetration depth of these low-energy fluorescence X-rays. On the other hand, L-shell XFCT for AuNP can detect much lower concentrations than K-shell XFCT due to its much lower Compton background noise. However, the penetration depth of L-shell fluorescence limits the imaging technique to very small samples of <1 cm in diameter or thickness.Citation42–Citation44 To perform XFCT for animal and human clinical studies, K-shell fluorescence images for MNPs would be necessary.
In this work, a Monte Carlo (MC) model was developed for pinhole K-shell XRF imaging of GdNPs and AuNPs using fan-beam polychromatic X-rays combined with a 2D array of position-sensitive detectors. XRF photons stimulated by incoming X-rays are isotropic sources, and thus, pinhole collimation is a good choice for imaging. Furthermore, the photons passing through a pinhole were expected to contain its position information, which enable the acquisition of a 2D slice image directly from one sheet of fan-beam irradiation without image reconstruction, translation, and rotation of the object. The MC model for this pinhole XRF system was quantitatively evaluated in terms of image quality and radiation dose for the polychromatic and monochromatic X-rays.
Materials and methods
MC model
A pinhole XRF imaging system was modeled using MC N-Particle Version 6.1 (MCNP6.1), as illustrated in .Citation48 The MCNP code has been widely used for the simulation studies on cadmium-zinc-telluride (CZT), CdTe, and high-purity germanium (HPGe) semiconductor detectors for medical imaging.Citation49–Citation51 The pinhole XRF imaging system has an imaging mechanism very similar to SPECT.Citation38 The model was benchmarked against the design and the dimension of the pinhole, as well as the type and the pixel size of the detector commonly used in preclinical pinhole SPECT.Citation52–Citation56 A cylindrical water phantom in the middle, as shown in , had a diameter of 5 cm and a height of 5 cm each. Four cylindrical water columns, 1 cm in diameter and 3 cm in height, containing GdNPs or AuNPs of different concentrations (0.01 wt%, 0.03 wt%, 0.06 wt%, and 0.09 wt%) were placed in the water phantom, as shown in . Two pinhole collimators with pinholes of 2 mm in diameter were located on both sides of the phantom on a lead sheet with a thickness of 5 mm. The pinhole had a cone-shaped profile with an acceptance angle of 102° (Figure S1). The beam plane-to-collimator and the collimator-to-detector distances were 2.5 cm each.
Figure 1 MC simulation geometry and imaging water phantom.
Notes: (A) MC simulation geometry for pinhole K-shell XRF imaging system and (B) imaging water phantom where four columns are assumed to have different concentrations of either gadolinium (Gd) or gold (Au) nanoparticles. The red arrows indicate the incident fan-beam X-rays. Gd or Au columns of 0.01 wt%, 0.03 wt%, 0.06 wt%, and 0.09 wt% are located left, in, out, and right with respect to the incident direction of X-rays, respectively.
Abbreviations: MC, Monte Carlo; XRF, X-ray fluorescence; Gd, gadolinium; Au, gold; wt, weight.
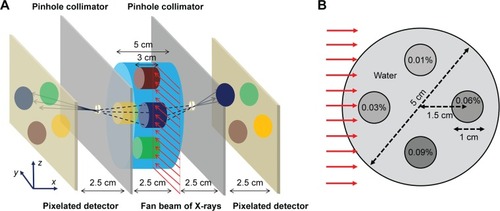
The incident X-ray beam was specified as a fan beam of 5 mm width and 5 cm length. Due to the high-energy resolution of the semiconductor detector,Citation57 a commercial pixelated CZT gamma camera composed of four SRE4001-CZT25.4 modules (Integrated Detect Electronics AS, Oslo, Norway) was chosen as the detector model for the MC simulation. The detector consisted of 32×32 pixels, with each pixel having a dimension of 1.6×1.6 mm2 and a thickness of 5 mm. The detector had an Al6061 window with a thickness of 1.5 mm in front of the CZT crystal. The geometric efficiency and system resolution were calculated as shown in the Supplementary materials. Utilizing the geometrical symmetry of the collimator-and-detector configuration (), MC images from both sides were combined to reduce the noise for a given computation time.
X-ray sources
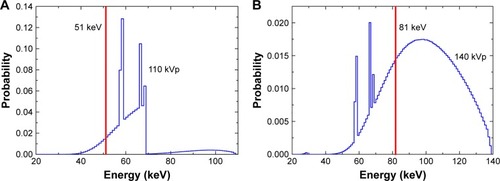
To acquire Gd K-shell XRF images, 110 kVp polychromatic X-rays filtered with 0.3 mm tungsten (W) (denoted as 110 kVp) were used. On the other hand, 140 kVp X-rays with 1.5 mm aluminum (Al), 0.25 mm copper (Cu), and 0.75 mm tin (Sn) filtration (denoted as 140 kVp) were used for Au K-shell XRF imaging. The filters used for 140 kVp X-rays were commercial filters of the X-RAD 320 (Precision X-ray Inc, North Branford, CT, USA). The energy spectra for the two polychromatic X-rays were extracted from the SpekCalc code that has been validated with measurements and MC results and were previously used in several studies.Citation58–Citation61 In addition, monochromatic X-rays of two different energies (ie, 51 keV for Gd and 81 keV for Au) were used to compare the image quality and the radiation dose. The X-rays of 51 keV and 81 keV were expected to have more fluorescence emissions, since these energies are close to the Kedge energies of Gd (ie, 50.2 keV) and Au (ie, 80.7 keV). The incident X-ray source spectra for Gd and Au are shown in . Each simulation was conducted with 1×10¹¹ histories.
Image processing
XRF and scattered photons reaching the detector array were tracked by the energy-specific pulse height tallies (ie, F8 of MCNP6.1). In order to detect the distinct K-shell XRF peaks above the Compton background counts, an energy bin of 1 keV was set for the detector tallies. The Kα1 and Kα2 peaks for Gd and Au were acquired in the simulation. The peak energies of Gd were 42.4 keV and 43.1 keV, while Au XRF lines resulted in peaks at 67.2 keV and 69.0 keV.Citation62
Since the energy resolution of CZT gamma camera was much higher than 1 keV, degradation of simulation results was needed to reflect realistic situations. We measured the energy spectrum of amerisium-241 (Am-241) radioisotope (Ortec, Oak Ridge, TN, USA) emitting 59.5 keV gammas (Figure S2). Full width at half maximum (FWHM) at 59.5 keV was assumed to not be significantly different from the %FWHM at K-shell XRF energies of Gd (~43 keV) and Au (~68 keV). Degradation with the measured %FWHM was applied for the MC-based 1 keV spectra, which caused XRF peaks to be broadened (Figures S3 and S4). The raw fluorescence signals were derived by subtracting 41–46 keV (GdNP imaging) and 66–71 keV (AuNP imaging) photon counts of the pure water phantom from the photon counts at the same energies for the phantom inserted with Gd and Au columns.
The attenuation corrections for the incident beam and XRF photons were taken into account by using the mass attenuation coefficient published by the National Institute of Standards and Technology (NIST),Citation63 which were derived using the following equation:
where is the attenuation corrected fluorescence photon count,
is the raw fluorescence photon count of the ith pixel, µI is the linear attenuation coefficient of water at the incident X-ray energy, and µK is the linear attenuation coefficient of water at K-shell XRF energy (ie, Gd: 43 keV and Au: 68 keV). The midplane of the water phantom where the incident fan beam passed through was divided into 32×32 pixels similar to a pinhole projection of detector array. Since the beam plane-to-collimator and collimator-to-detector distances were the same, the photons from the ith pixel of the midplane were assumed to be the photons arriving at the ith pixel of the detector. yi is the path length of incident X-rays in the phantom, while xi indicates the path length of XRF photons of the ith pixel in the phantom (). For the polychromatic X-rays, the term
was replaced with
where Nm and µm are the number of photons and the linear attenuation coefficient of water at the photon energy m, respectively. EK is the energy right above the Kedge energy (ie, Gd: EK =51 keV and Au: EK =81 keV), while Emax is the maximum energy of the incident polychromatic X-rays.
Figure 3 Schematic representation of pinhole XRF imaging system.
Notes: The midplane of the water phantom was divided into 32×32 pixels, each of which had 1.6×1.6 mm2 area. yi is the path length of incident X-rays in the phantom, while xi is the path length of XRF photons of the ith pixel in the phantom.
Abbreviation: XRF, X-ray fluorescence.
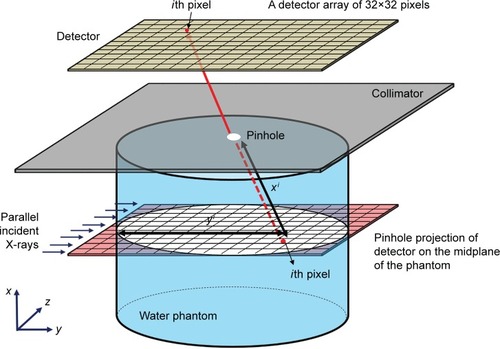
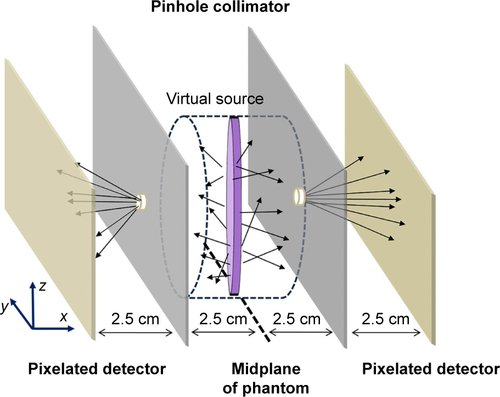
As the radial distance from the central pixel of the detector array increased, the detection sensitivity at the peripheral pixels suffered from the inverse distance-square.Citation64 Such sensitivity correction factors were determined from empirical data obtained by additional MC simulations. A cylindrical virtual disk source of 5 cm in diameter and 5 mm in height, isotropically emitting photons of the same energy with K-shell fluorescence X-rays at 43 keV for Gd and 68 keV for Au, was located in a position of the midplane of water phantom (Figure S5). The sensitivity of the pinhole collimator was best for photons originating from the center of the virtual source, whereas photons from the periphery were much less detectable. The number of photons detected in each pixel of detector was normalized with respect to the value at the central pixel. Reciprocals of the values in each pixel represent the sensitivity correction factors. By multiplying all the correction factors with the raw signals at each pixel, corrected pixel values were obtained. The corrected values were directly plotted on a 2D map, representing the location and concentration of Gd or Au columns. The Gaussian filter was applied to decrease the noise. The contrast-to-noise ratio (CNR) is given by the following equation:
where and
are the mean pixel values in the region of interest (ROI) and the background region, respectively, which was used to evaluate the image quality for the incident X-ray spectra. The ROIs were the pixels projected by the Gd or Au columns, while the background region was set to the central pixels of field of view (FOV). σbg is the standard deviation of the pixel values in the background region.
Results
Geometric efficiency, system resolution, and energy resolution
Since the energies of the XRF photons were relatively low, the effective pinhole diameter was almost similar to the physical pinhole diameter, which indicated no significant penetration effect at the edge of the aperture. Furthermore, the geometric efficiency, which depends on the angle (θ), was 1.65×10⁻³ for the minimum angle (ie, 0°) and 5.03×10⁻⁴ for the maximum angle (ie, 47.7°). The imaging system had the system resolution of 4.22 mm, while the collimator and intrinsic resolutions were 3.90 mm and 1.60 mm, respectively. From the measurement of the Am-241 photon peak at 59.5 keV, %FWHM of the detector was determined to be 18.6% (ie, 11.1 keV) (Figure S2). According to this %FWHM, the original MC spectra of 1 keV energy bin acquired by the polychromatic X-rays were degraded using the Gaussian distribution (MATLAB 2014a; MathWorks, Inc, Natick, MA, USA).
Imaging of Gd
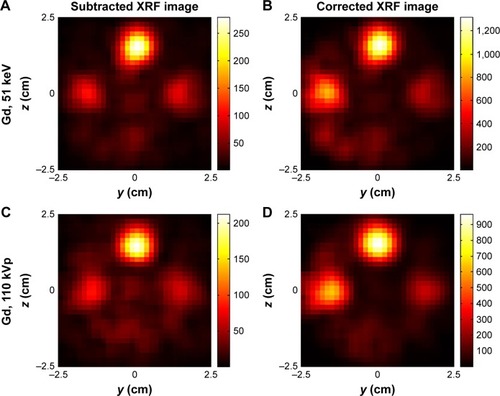
shows the 2D pinhole K-shell XRF images of Gd columns for 51 keV and 110 kVp X-rays. The subtracted XRF images were obtained by subtracting the photon counts at the 41–46 keV energy window of pure water phantom from those of Gd-loaded water phantom. The attenuation correction and the sensitivity correction were applied to the subtracted XRF images to generate corrected XRF images. Thus, 51 keV X-rays induced higher XRF counts than 110 kVp X-rays. Furthermore, even Gd columns with the lowest concentration at 0.01 wt% were still detectable in the corrected XRF images.
Figure 4 Subtracted and corrected XRF images for Gd.
Notes: (A) Subtracted XRF image between Gd-loaded water phantom and pure water phantom; (B) XRF image of Gd corrected by attenuation and sensitivity for monochromatic 51 keV X-rays; (C) subtracted XRF image between Gd-loaded water phantom and pure water phantom; and (D) XRF image of Gd corrected by attenuation and sensitivity for polychromatic 110 kVp X-rays.
Abbreviations: XRF, X-ray fluorescence; Gd, gadolinium.
The linear relationship between the XRF signals and Gd concentrations was plotted, as shown in . Two curves for the incident X-rays showed a strong linearity (ie, R2>0.9827), which implied that the corrections for the attenuation and sensitivity worked well. The CNRs of the Gd columns calculated from the pinhole K-shell XRF images are shown in . There was no significant difference in the CNRs of 51 keV and 110 kVp images.
Figure 5 XRF signal intensities and CNR values versus Gd concentrations.
Notes: (A) Linear relationship between Gd concentrations and integrated XRF counts and (B) CNR values in the region of Gd columns for two different X-ray source spectra.
Abbreviations: CNR, contrast-to-noise ratio; XRF, X-ray fluorescence; wt, weight; Gd, gadolinium.

Imaging of Au
The 2D pinhole K-shell XRF images of Au columns for 81 keV and 140 kVp X-rays are shown in . The subtracted XRF images were obtained by subtracting the photon counts at the 66–71 keV energy window of the pure water phantom from those of the Au-loaded water phantom. The attenuation and sensitivity corrections were applied to the subtracted XRF images to generate the corrected XRF images. The acquired images showed that more blurred regions were present for the images taken at 140 kVp than for those taken at 81 keV. After the correction factors were applied to the subtracted 140 kVp images, the blurred regions near the 0.06 wt% Au became conspicuous.
Figure 6 Subtracted and corrected XRF images for Au.
Notes: (A) Subtracted XRF image between Au-loaded water phantom and pure water phantom; (B) XRF image of Au corrected by attenuation and sensitivity for monochromatic 81 keV X-rays; (C) subtracted XRF image between Au-loaded water phantom and pure water phantom; and (D) XRF image of Au corrected by attenuation and sensitivity for polychromatic 140 kVp X-rays.
Abbreviations: XRF, X-ray fluorescence; Au, gold.
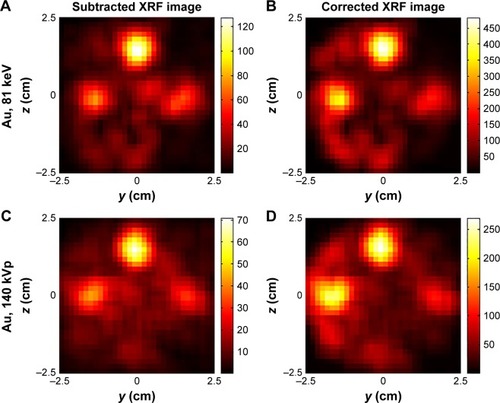
A good linear relationship (ie, R2>0.9162) was established between the integrated XRF signals and the Au concentrations, as shown in . The CNRs of the 81 keV and 140 kVp images were similar, except for 0.06 wt% Au (). For the 0.01 wt% Au columns, the CNRs of 0.01 wt% Au columns were 0.7 and 1.0 for 81 keV and 140 kVp images, respectively. For 140 kVp X-rays, according to the Rose criterion for CNR, the lowest distinguishable concentrations were 0.03 wt% for the 140 kVp images.
Figure 7 XRF signal intensities and CNR values versus Au concentrations.
Note: (A) Linear relationship between Au concentrations and integrated XRF counts and (B) CNR values in the region of Au columns for two different X-ray source spectra.
Abbreviations: CNR, contrast-to-noise ratio; XRF, X-ray fluorescence; Au, gold.

Radiation dose
The imaging doses of the pinhole XRF imaging system are summarized in . These radiation doses were calculated with 1×10¹¹ histories of incident X-rays, which was also the number of histories to acquire all the images shown before. The imaging dose was composed of two components, the prescanning dose of the phantom without Gd or Au and the XRF scanning dose of the phantom with Gd or Au. The radiation doses with NP in the phantom were a little higher (by 0.1 mGy) than the dose for the pure water phantom. The total imaging dose is the sum of these two components.
Table 1 Imaging dose of pinhole XRF imaging for four different incident X-ray sources
Discussion
Pinhole K-shell XRF imaging using polychromatic X-rays and 2D array of position-sensitive detectors appears to be feasible for in vivo imaging and quantification of GdNP- or AuNP-loaded columns within small-animal-sized phantoms. The developed model can acquire 2D XRF images directly from only one fan-beam irradiation without the need of further processing like beam or detector translation and phantom rotation.
Although 51 keV and 81 keV X-rays are close to the Kedge energies of Gd and Au, respectively, the resulting images obtained by 110 kVp and 140 kVp beams showed similar level of image quality. Blurred regions in XRF images of the polychromatic X-rays were caused by the statistical noise from the subtraction of the Compton scatter background, which was sometimes larger than the signals of XRF. Although their integrated XRF counts were less than those of the monochromic X-rays, the proposed polychromatic X-rays could generate recognizable K-shell XRF images for 0.01 wt% GdNP and 0.03 wt% AuNP. For Au imaging, 140 kVp showed higher CNR in 0.06 wt% Au than that in the same region for the 81 keV XRF image. This might be caused by a slight overestimation of the attenuation correction factors, especially for deep-seated regions (ie, 0.06 wt% Au). The use of polychromatic X-rays showed blurring in the Gd or Au images because polychromatic X-rays generated less XRF photons than monochromatic X-rays. Moreover, the false photon counts from the scattered polychromatic X-rays in the phantom may have contributed to the blurring.
In the MC simulation, the images were degraded by the measured %FWHM. In fact, the radiation transport codes could not solely include the physical degradations of the detector response such as electron–hole trapping, nonuniformity, and charge sharing.Citation65–Citation67 Therefore, the %FWHM of the CZT detector was measured to overcome the limitation of the MC study. Since the measured %FWHM applied to the simulated spectra was pixel-averaged, there is a possible overestimation in the quality of the processed images. In addition, any systematic errors could not be explicitly considered in this MC study. In order to reduce the interscanning systematic errors (eg, positioning and environmental condition for CZT detector), the experimental setup should be coincident for both prescanning and XRF scanning.
The current imaging system using commercial pixelated CZT gamma cameras has limitations in terms of system resolution (eg, pixel size and pinhole diameter) and energy resolution. Use of a smaller detector pixel or a pinhole is possible and is expected to improve the system resolution. However, these modifications would dramatically reduce the photon counts per pixel, which would result in considerable increase in the imaging dose and irradiation time. A compromise between system resolution and irradiation time is required. There have been technical efforts to improve the energy resolution of pixelated semiconductor detectors.Citation66 Such detectors have been manufactured by several research groups for the purpose of detecting gamma rays in spaceCitation66,Citation68 but are yet to be implemented for medical imaging purposes.
The previous XFCT system using a single CdTe detector took 90 minutes to get a single 2D slice image of a mouse.Citation69 As proposed in this study, if a 2D array of position-sensitive detectors can measure XRF and scattered photons, the image acquisition time can be dramatically reduced. Compared with the parallel-hole collimator XFCT system, the pinhole XRF imaging suffers from low detection efficiency. However, the pinhole system does not need to translate and rotate the sample to acquire a 2D slice image as required for the parallel-hole system. Moreover, the system can offer magnified images by simply adjusting the object-to-pinhole and pinhole-to-detector distances. Meng et alCitation45 and Fu et alCitation46 also demonstrated that the pinhole imaging system could detect more XRF photons per unit time and that the extended volume of phantom irradiated by the incident X-rays improved the imaging speed. Therefore, these advantages could offset the low detection efficiency of the pinhole system. Furthermore, implementation of the multipinhole collimation system may improve the imaging speed and efficiency.
However, the dose level (~30 mGy) predicted by MC simulations of our imaging system was much less than the imaging doses (a few hundred mGy) delivered by XFCT and micro-CT scanning of small animals.Citation69,Citation70 Since our system was modeled by benchmarking the pinhole SPECT system, which detects much higher energy photons than K-shell XRF photons,Citation52–Citation56 further investigation in optimizing the system design – such as collimator design, X-ray filter, and tube potential – is needed to reduce the dose level and improve the image quality. In addition, if the aforementioned 2D pixelated detectors with high-energy resolution are commercially available, discrete XRF peaks can be analytically separated from the background photons. This eliminates the prescanning procedure and, thus, can reduce the imaging dose as well as the systematic errors by half.
Conclusion
The MC simulations demonstrated the feasibility of the pinhole K-shell XRF imaging system for GdNPs and AuNPs stimulated by polychromatic X-rays using a 2D position-sensitive array of CZT pixelated detectors. The MC model for this pinhole XRF system showed direct 2D slice images of the object without image reconstruction. In a cylindrical water phantom of 5 cm depth and height, 0.01 wt% of GdNP and 0.03 wt% of AuNP were shown to be the minimum concentrations to achieve the Rose criterion for CNR (CNR =4). The MC technique developed in this study will be used to optimize experimental setups for future developments of the pinhole XRF imaging system.
Author contributions
SJY conceived the study concept, participated in all aspects of its design and coordination, and helped draft the manuscript. SJ performed MC simulations and drafted the manuscript. WS managed and commented on the methods for simulations and analysis. All authors contributed toward data analysis, drafting and critically revising the paper, gave final approval of the version to be published, and agree to be accountable for all aspects of the work.
Acknowledgments
This work was supported by the National Research Foundation of Korea (NRF) grant (number NRF-2013M2B2B1075776) funded by the Korean government (Ministry of Science, ICT and Future Planning). Part of the results of this study have been presented at the Korean Nuclear Society (KNS) 2014 Fall Meeting and the 2015 Institute of Electrical and Electronics Engineers (IEEE) Nuclear Science Symposium and Medical Imaging Conference. The conference record was published in the proceedings of the conference (2015 IEEE NSS/MIC).
Disclosure
The authors report no conflicts of interest in this work.
Supplementary materials
Geometric efficiency (g)
The geometric efficiency (g) was calculated as follows:Citation1
where deff is the effective pinhole diameter, θ is the angle between the source (in our system, a midplane in the water phantom where the incident X-rays pass through) and a pinhole (Figure S1), and b is the beam plane-to-pinhole distance. The effective pinhole diameter deff accounts for penetration of the edges of the pinhole aperture.
System resolution
The system resolution was calculated as follows:Citation1
where Rint is the intrinsic resolution of the detector, Rcoll is the collimator resolution, and l is the distance from the pinhole to the active surface of the detector. The field of view (FOV) in this configuration was 5 cm diameter; however, the magnification factor and FOV were adjustable by varying the beam plane-to-collimator and the collimator-to-detector distances.
Percentage full width at half maximum (%FWHM) measurement of Am-241 source with CZT gamma camera
The Am-241 source was electrodeposited, resulting in an active area of 3 mm diameter on a palladium disk of 12.7 mm diameter and 0.127 mm thickness. At the source-to-detector distance of 5 cm, the spectrum was measured by the pixelated CZT gamma camera for 1 hour at room temperature. All 1,024 pixel counts were averaged over to determine the %FWHM of the detector at 59.5 keV.
Figure S1 Schematic of pinhole collimation, where the acceptance angle is 102° and the angle between a point on the midplane of water phantom and the center of pinhole is θ.
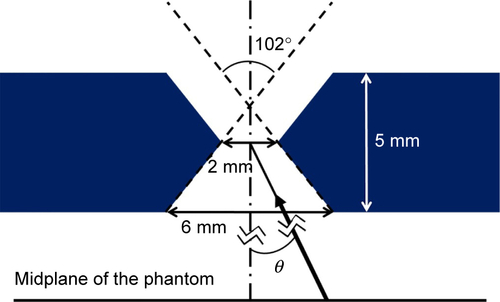
Figure S2 Energy spectrum of Am-241 acquired with the CZT gamma camera.
Abbreviations: CZT, cadmium-zinc-telluride; FWHM, full width at half maximum.
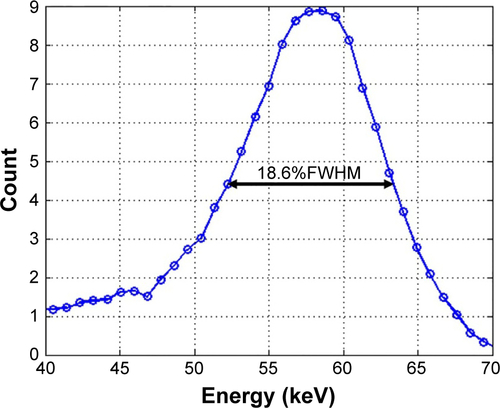
Figure S3 Energy spectra of K-shell XRF and Compton scattered photons from 0.09 wt% Gd column.
Notes: (A) Energy spectra of MC-based 1 keV bin and (B) energy spectra of a degradation with the measured %FWHM. Error bar indicates 68% confidence level.
Abbreviations: FWHM, full width at half maximum; MC, Monte Carlo; XRF, X-ray fluorescence; Gd, gadolinium.
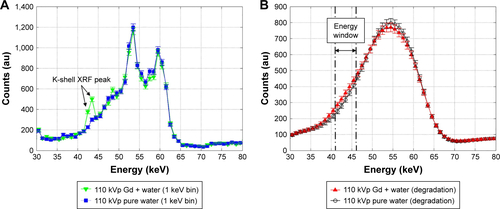
Figure S4 Energy spectra of K-shell XRF and Compton scattered photons from 0.09 wt% Au column.
Notes: (A) Energy spectra of MC-based 1 keV bin and (B) energy spectra of a degradation with the measured %FWHM. Error bar indicates 68% confidence level.
Abbreviations: FWHM, full width at half maximum; MC, Monte Carlo; XRF, X-ray fluorescence; Au, gold; wt, weight.
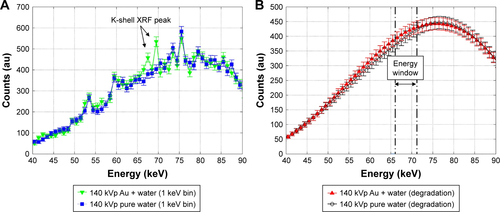
Figure S5 MC simulation model for sensitivity correction.
Notes: The virtual disk source of 5 cm diameter and 5 mm width (purple) in the midplane of water phantom isotropically emits fluorescence-like photons. The arrows describe photons emitting from the virtual source. The photons originating from the center of the source are detected more efficiently than those from the periphery.
Abbreviation: MC, Monte Carlo.
Reference
- CherrySRSorensonJAPhelpsMEPhysics in Nuclear Medicine3rd edPhiladelphia, PASaunders2003
References
- SalataOApplications of nanoparticles in biology and medicineJ Nanobiotechnology200421315119954
- De JongWHBormPJDrug delivery and nanoparticles: applications and hazardsInt J Nanomedicine20083213314918686775
- JainPKHuangXEl-SayedIHEl-SayedMANoble metals on the nanoscale: optical and photothermal properties and some applications in imaging, sensing, biology, and medicineAcc Chem Res200841121578158618447366
- ZhangLGuFXChanJMWangAZLangerRSFarokhzadOCNanoparticles in medicine: Therapeutic applications and developmentsClin Pharmacol Ther200883576176917957183
- NazirSHussainTAyubARashidUMacRobertAJNanomaterials in combating cancer: therapeutic applications and developmentsNanomedicine2014101193423871761
- PauneskuTKeTDharmakumarRGadolinium-conjugated TiO2-DNA oligonucleotide nanoconjugates show prolonged intracellular retention period and T1-weighted contrast enhancement in magnetic resonance imagesNanomedicine20084320120718567541
- ParkJYBaekMJChoiESParamagnetic ultrasmall gadolinium oxide nanoparticles as advanced T1 MRI contrast agent: account for large longitudinal relaxivity, optimal particle diameter, and in vivo T1 MR imagesACS Nano20093113663366919835389
- KimTJChaeKSChangYLeeGHGadolinium oxide nanoparticles as potential multimodal imaging and therapeutic agentsCurr Top Med Chem201313442243323432005
- PorcelETillementOLuxFGadolinium-based nanoparticles to improve the hadron therapy performancesNanomedicine20141081601160824846523
- SchlatholterTEustachePPorcelEImproving proton therapy by metal-containing nanoparticles: nanoscale insightsInt J Nanomedicine2016111549155627143877
- TaupinFFlaenderMDelormeRGadolinium nanoparticles and contrast agent as radiation sensitizersPhys Med Biol201560114449446425988839
- KhanAKRashidRMurtazaGZahraAGold nanoparticles: synthesis and applications in drug deliveryTrop J Pharm Res201413711691177
- HainfeldJFSlatkinDNSmilowitzHMThe use of gold nanoparticles to enhance radiotherapy in micePhys Med Biol20044918N309N31515509078
- ChoSHJonesBLKrishnanSThe dosimetric feasibility of gold nanoparticle-aided radiation therapy (GNRT) via brachytherapy using low-energy gamma-/X-ray sourcesPhys Med Biol200954164889490519636084
- RahmanWNBisharaNAckerlyTEnhancement of radiation effects by gold nanoparticles for superficial radiation therapyNanomedicine20095213614219480049
- KimJKSeoSJKimHTEnhanced proton treatment in mouse tumors through proton irradiated nanoradiator effects on metallic nanoparticlesPhys Med Biol201257248309832323201628
- NgwaWKorideckHKassisAIIn vitro radiosensitization by gold nanoparticles during continuous low-dose-rate gamma irradiation with I-125 brachytherapy seedsNanomedicine201391252723041410
- LinYMcMahonSJPaganettiHSchuemannJBiological modeling of gold nanoparticle enhanced radiotherapy for proton therapyPhys Med Biol201560104149416825953956
- ParoADHossainMWebsterTJSuMMonte Carlo and analytic simulations in nanoparticle-enhanced radiation therapyInt J Nano-medicine20161147354741
- SungWJungSYeSJEvaluation of the microscopic dose enhancement for nanoparticle-enhanced Auger therapyPhys Med Biol201661217522753527716643
- LiuYLiuXJinXThe dependence of radiation enhancement effect on the concentration of gold nanoparticles exposed to low- and high-LET radiationsPhys Med201531321021825651760
- HerSJaffrayDAAllenCGold nanoparticles for applications in cancer radiotherapy: mechanisms and recent advancementsAdv Drug Deliv Rev20171098410126712711
- SchuemannJBerbecoRChithraniDBRoadmap to clinical use of gold nanoparticles for radiation sensitizationInt J Radiat Oncol Biol Phys201694118920526700713
- SubielAAshmoreRSchettinoGStandards and methodologies for characterizing radiobiological impact of high-Z nanoparticlesTheranostics20166101651167127446499
- SungWYeSJMcNamaraALDependence of gold nanoparticle radiosensitization on cell geometryNanoscale20179185843585328429022
- RoaWZhangXJGuoLHGold nanoparticle sensitize radiotherapy of prostate cancer cells by regulation of the cell cycleNanotechnology2009203737510119706948
- ChithraniDBJelvehSJalaliFGold nanoparticles as radiation sensitizers in cancer therapyRadiat Res2010173671972820518651
- KangBMackeyMAEl-SayedMANuclear targeting of gold nanoparticles in cancer cells induces DNA damage, causing cytokinesis arrest and apoptosisJ Am Chem Soc20101325151720085324
- JainSCoulterJAHounsellARCell-specific radiosensitization by gold nanoparticles at megavoltage radiation energiesInt J Radiat Oncol Biol Phys201179253153921095075
- MackeyMASairaFMahmoudMAEl-SayedMAInducing cancer cell death by targeting its nucleus: solid gold nanospheres versus hollow gold nanocagesBioconjug Chem201324689790623777334
- CuiLTseKZahediPHypoxia and cellular localization influence the radiosensitizing effect of gold nanoparticles (AuNPs) in breast cancer cellsRadiat Res2014182547548825361396
- ChithraniBDGhazaniAAChanWCWDetermining the size and shape dependence of gold nanoparticle uptake into mammalian cellsNano Lett20066466266816608261
- LeeSYFerrariMDecuzziPShaping nano-/micro-particles for enhanced vascular interaction in laminar flowsNanotechnology2009204949510119904027
- ButterworthKTCoulterJAJainSEvaluation of cytotoxicity and radiation enhancement using 1.9 nm gold particles: potential application for cancer therapyNanotechnology2010212929510120601762
- ArnidaJanat-AmsburyMMRayAGeometry and surface characteristics of gold nanoparticles influence their biodistribution and uptake by macrophagesEur J Pharm Biopharm20117741742321093587
- HuangKYMaHLLiuJSize-dependent localization and penetration of ultrasmall gold nanoparticles in cancer cells, multicellular spheroids, and tumors in vivoACS Nano2012654483449322540892
- ChoSHKrishnanSCancer Nanotechnology: Principles and Applications in Radiation OncologyBoca Raton, FLCRC Press2013
- CheongSKJonesBLSiddiqiAKLiuFManoharNChoSHX-ray fluorescence computed tomography (XFCT) imaging of gold nanoparticle-loaded objects using 110 kVp X-raysPhys Med Biol201055364766220071757
- BoisseauPDetermination of Three Dimensional Trace Element Distributions by the Use of Monochromatic X-Ray Microbeams [PhD dissertation]Cambridge, MAMassachusetts Institute of Technology1986
- JonesBLManoharNReynosoFKarellasAChoSHExperimental demonstration of benchtop X-ray fluorescence computed tomography (XFCT) of gold nanoparticle-loaded objects using lead- and tin-filtered polychromatic cone-beamsPhys Med Biol20125723N457N46723135315
- AhmadMBazalova-CarterMFahrigRXingLOptimized detector angular configuration increases the sensitivity of X-ray fluorescence computed tomography (XFCT)IEEE Trans Med Imaging20153451140114725474808
- ManoharNReynosoFJChoSHExperimental demonstration of direct L-shell X-ray fluorescence imaging of gold nanoparticles using a benchtop X-ray sourceMed Phys201340808070223927295
- Bazalova-CarterMThe potential of L-shell X-ray fluorescence CT (XFCT) for molecular imagingBr J Radiol20158810552014030826204972
- Bazalova-CarterMAhmadMXingLFahrigRExperimental validation of L-shell X-ray fluorescence computed tomography imaging: phantom studyJ Med Imaging (Bellingham)20152404350126839910
- MengLJLiNLa RivierePJX-ray fluorescence emission tomography (XFET) with novel imaging geometries – a Monte Carlo studyIEEE Trans Nucl Sci20115863359336922228913
- FuGMengLJEngPNewvilleMVargasPLa RivierePExperimental demonstration of novel imaging geometries for X-ray fluorescence computed tomographyMed Phys201340606190323718594
- GrollAGeorgeJVargasPLa RivierePJMengLJElement mapping in organic samples utilizing a benchtop X-ray fluorescence emission tomography (XFET) systemIEEE Trans Nucl Sci20156252310231726705368
- GoorleyTJamesMBoothTInitial Mcnp6 release overviewNucl Technol20121803298315
- AlnafeaMWellsKSpyrouNMGuyMPreliminary Monte Carlo study of coded aperture imaging with a CZT gamma camera system for scintimammographyNucl Instrum Meth A20075731–2122125
- CampbellDLPetersonTESimulation study comparing high-purity germanium and cadmium zinc telluride detectors for breast imagingPhys Med Biol201459227059707925360792
- ManoharNJonesBLChoSHImproving X-ray fluorescence signal for benchtop polychromatic cone-beam X-ray fluorescence computed tomography by incident X-ray spectrum optimization: a Monte Carlo studyMed Phys2014411010190625281958
- JaszczakRJLiJYWangHLZalutskyMRColemanREPinhole collimation for ultra-high-resolution, small-field-of-view SPECTPhys Med Biol199439342543715551591
- CherrySRSorensonJAPhelpsMEPhysics in Nuclear Medicine3rd edPhiladelphia, PASaunders2003
- DeloarHMWatabeHAoiTIidaHEvaluation of penetration and scattering components in conventional pinhole SPECT: phantom studies using Monte Carlo simulationPhys Med Biol2003488995100812741497
- MojiVZeraatkarNFarahaniMHPerformance evaluation of a newly developed high-resolution, dual-head animal SPECT system based on the NEMA NU1-2007 standardJ Appl Clin Med Phys201415626727828297267
- PetersonMStrandSELjungbergMUsing Rose’s metal alloy as a pinhole collimator material in preclinical small-animal imaging: a Monte Carlo evaluationMed Phys20154241698170925832059
- IwanczykJSIniewskiKRadiation Detectors for Medical ImagingBoca Raton, FLCRC Press2016
- PoludniowskiGLandryGDeBloisFEvansPMVerhaegenFSpekCalc: a program to calculate photon spectra from tungsten anode X-ray tubesPhys Med Biol20095419N433N43819724100
- PidikitiRStojadinovicSSpeiserMDosimetric characterization of an image-guided stereotactic small animal irradiatorPhys Med Biol20115682585259921444969
- MesbahiAZakariaeeSSEffect of anode angle on photon beam spectra and depth dose characteristics for X-RAD320 orthovoltage unitRep Pract Oncol Radiother201318314815224416546
- NobletCChiavassaSSmekensFValidation of fast Monte Carlo dose calculation in small animal radiotherapy with EBT3 radiochromic filmsPhys Med Biol20166193521353527055114
- PerkinsSTCullenDEChenMHHubbellJHRathkopfJScofieldJTables and graphs of atomic subshell and relaxation data derived from the LLNL Evaluated Atomic Data Library (EADL), Z=1-100Lawrence Livermore National LaboratoryReport UCRL-50400 SeriesLivermore, CA1991
- HubbellJHSeltzerSMTables of X-ray mass attenuation coefficients and mass energy-absorption coefficients 1 keV to 20 MeV for elements Z=1 to 92 and 48 additional substances of dosimetric interestNational Inst. Of Standards and Technology-PLGaithersburg, MDTechnical Report, TRN:518121481995
- ConnollyLPTrevesSTDavisRTZimmermanREPediatric applications of pinhole magnification imagingJ Nucl Med199940111896190110565787
- d’AillonEGTabaryJGliereAVergerLCharge sharing on monolithic CdZnTe gamma-ray detectors: a simulation studyNucl Instrum Meth A20065631124127
- Del SordoSAbbeneLCaroliEManciniAMZappettiniAUbertiniPProgress in the development of CdTe and CdZnTe semiconductor radiation detectors for astrophysical and medical applicationsSensors (Basel)2009953491352622412323
- BolotnikovAECamardaGSCuiYCharacterization and evaluation of extended defects in CZT crystals for gamma-ray detectorsJ Cryst Growth20133794656
- KoKubunMNakazawaKEnotoTHard X-ray imager (HXI) for the ASTRO-H missionProc SPIE20107732773215
- ManoharNReynosoFJDiagaradjanePKrishnanSChoSHQuantitative imaging of gold nanoparticle distribution in a tumor-bearing mouse using benchtop X-ray fluorescence computed tomographySci Rep201662207926912068
- BooneJMVelazquezOCherrySRSmall-animal X-ray dose from micro-CTMol Imag200433149158

