
Abstract
Background
Recently, there has been much interest in the field of nanomedicine to improve prevention, diagnosis, and treatment. Combination therapy seems to be most effective when two different molecules that work by different mechanisms are combined at low dose, thereby decreasing the possibility of drug resistance and occurrence of unbearable side effects. Based on this consideration, the study was designed to investigate the combination effect of reduced graphene oxide-silver nanoparticles (rGO-AgNPs) and trichostatin A (TSA) in human ovarian cancer cells (SKOV3).
Methods
The rGO-AgNPs were synthesized using a biomolecule called lycopene, and the resultant product was characterized by various analytical techniques. The combination effect of rGO-Ag and TSA was investigated in SKOV3 cells using various cellular assays such as cell viability, cytotoxicity, and immunofluorescence analysis.
Results
AgNPs were uniformly distributed on the surface of graphene sheet with an average size between 10 and 50 nm. rGO-Ag and TSA were found to inhibit cell viability in a dose-dependent manner. The combination of rGO-Ag and TSA at low concentration showed a significant effect on cell viability, and increased cytotoxicity by increasing the level of malondialdehyde and decreasing the level of glutathione, and also causing mitochondrial dysfunction. Furthermore, the combination of rGO-Ag and TSA had a more pronounced effect on DNA fragmentation and double-strand breaks, and eventually induced apoptosis.
Conclusion
This study is the first to report that the combination of rGO-Ag and TSA can cause potential cytotoxicity and also induce significantly greater cell death compared to either rGO-Ag alone or TSA alone in SKOV3 cells by various mechanisms including reactive oxygen species generation, mitochondrial dysfunction, and DNA damage. Therefore, this combination chemotherapy could be possibly used in advanced cancers that are not suitable for radiation therapy or surgical treatment and facilitate overcoming tumor resistance and disease progression.
Introduction
Cancer is a heterogeneous disease characterized by abnormal and uncontrolled cell growth that involves a multitude of genetic and environmental factors, which is a major public health problem worldwide and is the second leading cause of death in the US.Citation1 Among the various types of cancers, ovarian cancer is the eighth leading cause of cancer among women and accounts for ~4% of all cancers in women.Citation2 Ovarian cancer is one of the severe forms of cancer and shows high morbidity and mortality rates compared to other cancers of the reproductive system.Citation3–Citation5 According to the global estimates, 225,000 new cases of ovarian cancer are detected each year, and 140,000 people die from the disease annually.Citation2–Citation5 Ovarian cancer is diagnosed in nearly a quarter of a million women per year globally. The mortality rate of ovarian cancer among women is one death per 71 cases detected, and 1 in 95 patients has a high chance of dying from the disease.Citation5,Citation6 The lack of early detection and chemoresistance lead to high mortality in women.Citation7 Although the rate of mortality of ovarian cancer is high, the etiology of the condition is not completely understood, because it is controlled by several factors including protective factors, risk factors, and factors such as lactation, age at menarche, and age at menopause.Citation8–Citation12 Several treatments such as surgery, hormone therapy, chemotherapy, radiation therapy, immunotherapy, and targeted therapy are available; however, only surgery and chemotherapy are considered to be the main treatments, and the effect of surgery depends on patient’s age and stage of disease. Chemotherapy seems to be a powerful therapeutic approach for the treatment and management of cancer, which is also supplementing other strategies such as surgery and radiation therapy. However, chemotherapy causes several side effects including damage of normal cells, risk of infections, tiredness, nausea, vomiting, loss of appetite, and so on. Therefore, it is essential to find out alternative methods that are convenient for patient and free from undesired side effects such as chemoresistance.
Combination therapy using two or more drugs at a time is a potential tool to overcome the chemoresistance, which is more effective than single treatment and can significantly improve treatment response, and minimize development of resistance and adverse events. In addition, combination therapy is critical to develop prevention strategies and curative therapies.Citation13 One of the most promising strategies to increase the efficacy of standard chemotherapy drugs is combining them with low doses of histone deacetylase inhibitors (HDACIs).Citation14 HDACIs serve as potential inhibitors of cancers and are a new class of potent inhibitors that lead to tumor cell arrest in a variety of cancers.Citation15,Citation16 HDACIs are able to reduce cell survival in human breast cancer cells through remodeling the human epidermal growth factor receptor 2 (HER2) promoter and regulating HER2 expression.Citation17 Among the various types of HDACIs, trichostatin A (TSA) is an antifungal antibiotic with cytostatic and differentiating properties in mammalian cell culture and one of the most potent and selective deacetylase (HDAC) inhibitors, which shows a potential therapeutic effect in various types of cancer cells, when combined with radiotherapy or chemotherapy.Citation18 TSA causes apoptosis through the inhibition of cell viability, as well as proliferation of cells expressing apoptosis-related proteins and activation of those proteins in a variety of cancer cells, including human breast, gastric, ovarian, small-cell lung, and cervical cancer cells.Citation19–Citation23 TSA is not only a potential inducer of apoptosis but also involved in reprogramming efficiencies of stem cells.Citation24 Although several studies have reported that TSA has a potential inhibitory effect on cancer, there is limited information on the combination effect of TSA particularly with nanoparticles. Recently, Zhang et al demonstrated that TSA can potentially enhance the apoptosis in human cervical cancer cells.Citation25
Recently, graphene and graphene-related materials have been used with much interest in biomedical applications including antibacterial and anticancer activity, imaging, tissue engineering, and drug delivery, and as biomarkers.Citation26 Graphene-based nanomaterials have been shown as excellent and suitable platforms for anchoring silver nanoparticles (AgNPs) for the production of graphene-Ag nanocomposites used as antimicrobial and anticancer agents.Citation27–Citation35 Among several metallic nanoparticles, AgNPs are widely used in industry as well as biomedical applications due to their unique physical, chemical, and biological properties, particularly antibacterial, antiviral, antifungal, anti-inflammatory, anticancer, and antiangiogenic activities. Although AgNPs are presented as very attractive molecules in various therapeutic and industrial applications, they have a strong tendency to aggregate in aqueous solutions and are susceptible to aggregate into large particles owing to their high surface energy, resulting in deterioration of their unique chemical properties and loss of their antibacterial activities, which leads to a decrease in various biological activities.Citation36–Citation38 To overcome the aggregation, surfactants have been used to maintain the colloidal stability of AgNPs; however, as a consequence of using surfactants, a reduced toxicity was observed in bacterial cells which was due to decreased rate of Ag+ ion release.Citation39 Therefore, a suitable single platform with distinct and attractive features must be designed to build novel nanocomposites. Graphene oxide (GO) seems to be an attractive platform for building nanocomposites containing AgNPs with novel antibacterial and anticancer properties. GO sheets act as support layers to stabilize AgNPs and to prevent them from aggregation, allowing a more controlled release of Ag+ ions and an enhanced antimicrobial and anticancer activity.Citation34,Citation35 Taking the available literature into account, this study was designed with the following objectives: The first objective of this study was to synthesize reduced graphene oxide-silver nanoparticle (rGO-AgNP) nanocomposites using a novel biomolecule called lycopene. The second objective was to characterize rGO-AgNP nanocomposites using several analytical techniques. The final objective was to evaluate the apoptotic potential of the combination of rGO-AgNP nanocomposites and TSA in human ovarian cancer cells.
Materials and methods
Materials
Penicillin–streptomycin solution, trypsin–EDTA solution, Dulbecco’s Modified Eagle’s Medium (DMEM), and 1% antibiotic–antimycotic solution were obtained from Life Technologies (Thermo Fisher Scientific, Waltham, MA, USA). Fetal bovine serum (FBS), CCK-8, and an in vitro cell-counting assay kit were purchased from Dojindo (ck04; Rockville, MD, USA). Primary antibodies against γH2AX (ab26350) and Rad51 (ab88572) were obtained from Abcam (Cambridge, UK). Lycopene, AgNO3, FBS, and the in vitro toxicology assay kit were purchased from Sigma-Aldrich (St Louis, MO, USA). Graphite (Gt) powder, NaOH, KMnO4, NaNO3, anhydrous ethanol, 98% H2SO4, 36% HCl, 30% H2O2 aqueous solution, and all other chemicals were purchased from Sigma-Aldrich unless otherwise stated.
Synthesis of GO
GO was synthesized as described previously with suitable modifications.Citation34,Citation40,Citation41 In a typical synthesis process, 2 g natural Gt powder was added to 350 mL H2SO4 at 0°C; 8 g KMnO4 and 1 g NaNO3 were added gradually while stirring. The mixture was transferred to a 40°C water bath and stirred for 60 min. Deionized water (250 mL) was slowly added, and the temperature was increased to 98°C. The mixture was maintained at 98°C for 30 min; the reaction was terminated by the addition of 500 mL deionized water and 40 mL of 30% H2O2 solution. The color of the mixture changed to brilliant yellow, indicating the oxidation of pristine Gt to Gt oxide. The mixture was filtered and washed with diluted HCl to remove metal ions. The product was washed repeatedly with distilled water until a pH of 7.0 was achieved; the synthesized Gt oxide was further sonicated for 120 min.
Synthesis and characterization of rGO-Ag nanocomposites
Synthesis and characterization of the AgNPs and rGO-Ag nanocomposites was followed as described previously using GO as precursor material.Citation34,Citation35,Citation42 rGO, AgNPs, and rGO-Ag nanocomposites were synthesized using lycopene as reducing agent.Citation34,Citation35,Citation42 Reduction of GO was followed as described previously.Citation34,Citation35 To prepare rGO-Ag nanocomposites, aqueous solutions of 100 mg GO and 1 mM AgNO3 were used as precursors. Initially, 100 mg GO was dispersed in 60 mL water followed by 60 min of sonication. The reaction mixture was prepared in a 250-mL round-bottom flask by dissolving 1 mM AgNO3 in 30 mL water. To this solution, 60 mL of the GO dispersion was added, followed by a quick addition of 10 mL of aqueous 5 µM lycopene. The mixture was stirred at 90°C for 12 h. After 12 h, the reaction was stopped, and the resultant mixture was washed three times with water by centrifugation. The products were further centrifuged and washed with double-distilled water several times to remove the unreacted lycopene and redispersed in water for characterization and further applications. The product was obtained as a black powder and used for further experiments. Characterization of rGO-Ag was carried out according to the method described previously.Citation34,Citation35,Citation42
Cell culture and exposure of cells to rGO-Ag
Ovarian cancer cell lines (SKOV3) were procured from Sigma-Aldrich and cultured in DMEM (Hyclone, Logan, UT, USA) supplemented with FBS (10%) and antibiotics (penicillin 100 U/mL and streptomycin 100 µg/mL) at 37°C in a 5% CO2 atmosphere. The cells were seeded onto plates at a density of 1×10⁴ cells per well and incubated for 24 h prior to the experiments. The cells were washed with phosphate-buffered saline (PBS; pH 7.4) and incubated in fresh medium containing different concentrations of rGO-Ag dissolved in water.
Cell viability assay
The MTT assay was used to investigate mitochondrial function. Briefly, 1×10⁴ cells were seeded in each 96-well plate and exposed to different concentrations of rGO-Ag (0.1–0.5 µM) or TSA (0.1–0.5 µM) or combination of rGO-Ag and TSA for 24 h. After the exposure, the culture medium was removed from each well and replaced with 100 µL of new medium containing MTT. The cells were incubated for 3 h at 37°C, and the absorbance was measured at 450 nm using a microplate reader (PerkinElmer, Waltham, MA, USA).
Cell morphology
SKOV3 cells were plated in six-well plates (2×10⁵ cells per well) and incubated with rGO-Ag (0.2 µM) or TSA (0.2 µM) or combination of rGO-Ag (0.2 µM) and TSA (0.2 µM) for 24 h. Cells cultured in medium without the addition of rGO-Ag (0.2 µM) and TSA (0.2 µM) were used as the control. The cell morphology was analyzed using an optical microscope (Olympus IX71; Olympus Corporation, Tokyo, Japan) with the appropriate filter sets at 24 h posttreatment.
Measurement of ROS levels
Intracellular reactive oxygen species (ROS) levels were measured using the detection kit no S0033 purchased from Beyotime (Haimen, China). Briefly, cells were seeded in six-well plates for 24 h, and then incubated with fresh medium containing 10 µM dichloro-dihydro-fluorescein diacetate (DCFH-DA) at 37°C in the dark for 20 min. Subsequently, SKOV3 cells were plated in six-well plates (2×10⁵ cells per well) and incubated with rGO-Ag (0.2 µM) or TSA (0.2 µM) or combination of rGO-Ag (0.2 µM) and TSA (0.2 µM) for 24 h. At the end of incubation, the cells were washed with PBS, and the fluorescence intensity was measured under a fluorescence microscope using image analysis software. Images were captured with an electronic camera (Olympus; 100× magnification).
Measurement of oxidative and antioxidative stress markers
Oxidative stress marker malondialdehyde (MDA) and antioxidative stress marker glutathione (GSH) were assayed according to the method described previously and also according to manufacturer’s instructions (Sigma-Aldrich).Citation35 Briefly, the cells were cultured in 75 cm2 culture flasks and exposed to rGO-Ag (0.2 µM) or TSA (0.2 µM) or combination of rGO-Ag (0.2 µM) and TSA (0.2 µM) for 24 h. The cells were harvested in chilled PBS, by scraping and washing twice with 1× PBS at 4°C for 6 min at 1,500 rpm. The cell pellet was sonicated at 15 W for 10 s (three cycles) to obtain the cell lysate. The resulting supernatant was stored at −70°C, until analyzed.
Assessment of LDH leakage and dead-cell protease activity
SKOV3 cells were treated with rGO-Ag (0.2 µM) or TSA (0.2 µM) or combination of rGO-Ag (0.2 µM) and TSA (0.2 µM) for 24 h. The lactate dehydrogenase (LDH) leakage assay was carried out using the LDH cytotoxicity assay kit (Abcam). LDH activity was determined in the medium by measuring the absorbance at 490 nm using a Multiskan FC multiplate reader. A dead-cell protease activity assay was performed according to the method described by Jo et al.Citation76 CytoTox-Glo cytotoxicity assay (Promega Corp., Fitchburg, WI, USA) was performed to examine dead-cell protease activity by measuring the rGO-Ag-induced cytotoxicity in SKOV3. The cytotoxicity assay was employed to evaluate the cytotoxic effects of rGO-Ag (0.2 µM) or TSA (0.2 µM) or combination of rGO-Ag (0.2 µM) and TSA (0.2 µM). The cytotoxicity was determined by association of intracellular protease with a luminogenic peptide substrate (alanyl-alanylphenylalanyl-aminoluciferin). The degree of protease reaction can measure dead-cell protease activity. As a control, we treated cells with 1% Triton X-100 to exclude the background value of the medium color. Luminogenic peptide substrate (5 µL) was added to each well and incubated for 15 min at 37°C, and luminescence was measured using a luminescence counter (PerkinElmer) to determine the number of dead cells.
JC-1 assays
JC-1 assay was performed according to the manufacturer’s instructions (JC-1 Mitochondrial Membrane Potential Assay Kit; Abnova, Taipei, Taiwan). SKOV3 cells were plated in six-well plates (2×10⁵ cells per well) and incubated with rGO-Ag (0.2 µM) or TSA (0.2 µM) or combination of rGO-Ag (0.2 µM) and TSA (0.2 µM) for 24 h under the conditions described above. The cells were then transferred onto a coverslip housed in a four-well plate and incubated in DMEM containing 10 µM JC-1 at 37°C for 15 min before washing with PBS and were rapidly mounted for observation. In all procedures, cells were mounted with Vectachield fluorescent medium and visualized under a fluorescent microscope.
TUNEL analysis
For detection of apoptotic cells in groups treated with rGO-Ag (0.2 µM) or TSA (0.2 µM) or combination of rGO-Ag (0.2 µM) and TSA (0.2 µM), the terminal deoxynucleotidyl transferase-mediated dUTP nick end labeling (TUNEL) method was employed using an in situ detection kit (Promega) according to the manufacturer’s instructions. SKOV3 cells were plated in six-well plates (2×10⁵ cells per well) and incubated with rGO-Ag (0.2 µM) or TSA (0.2 µM) or combination of rGO-Ag (0.2 µM) and TSA (0.2 µM) for 24 h, and then cell apoptosis was quantified using TUNEL analysis. Samples were evaluated under a Nikon Eclipse E400 fluorescence microscope (Nikon 40× Plan 40/0.65). Differences between the number of TUNEL-positive cells in the control and experimental samples were statistically analyzed.
Immunohistochemistry
SKOV3 cells were plated in six-well plates (2×10⁵ cells per well) and incubated with rGO-Ag (0.2 µM) or TSA (0.2 µM) or combination of rGO-Ag (0.2 µM) and TSA (0.2 µM) for 24 h. The cells were fixed in 4% paraformaldehyde and blocked with 1% BSA for 30 min. Then, they were incubated with primary antibodies against γH2AX (ab26350) or Rad51 (ab88572) at 4°C overnight. After washing with PBS, the cells were labeled with Cy3-labeled goat anti-rabbit IgG at a dilution of 1:50 (A0516; Beyotime) at 4°C for 1.5 h. Finally, samples were counterstained with 4′,6-diamidino-2-phenylindole and visualized under a confocal microscope (Carl Zeiss LSM780; Instrument Development Center, National Cheng Kung University).
Extraction and amplification of mRNA
Total RNA was extracted from cells treated with rGO-Ag (0.2 µM) or TSA (0.2 µM) or combination of rGO-Ag (0.2 µM) and TSA (0.2 µM) for 24 h using the Arcturus Picopure RNA Isolation Kit (eBioscience, San Diego, CA, USA), and samples were prepared according to the manufacturer’s instructions. Real-time reverse transcription polymerase chain reaction (RT-PCR) was conducted using Vill7 (Thermo Fisher Scientific) and SYBR Green as the double-stranded DNA-specific fluorescent dye (Thermo Fisher Scientific). Target gene expression levels were normalized to GAPDH expression, which was unaffected by the treatment. The RT-PCR primer sets are shown in . Real-time RT-PCR was performed independently in triplicate for each of the different samples; the data are presented as mean values of gene expression measured in treated sample vs control.
Table 1 Primers used for quantitative real-time PCR for the analysis of apoptotic and anti-apoptotic gene expression
Statistical analysis
Independent experiments were repeated at least three times, and data were represented as mean ± standard deviation of all duplicates within an individual experiment. Data were analyzed by t-test or one-way analysis of variance followed by the Tukey’s test for multiple comparisons to determine the differences between groups (denoted by an asterisk or different letters) using GraphPad Prism analysis software.
Results and discussion
Synthesis and characterization of GO, rGO, AgNPs, and rGO-Ag using lycopene
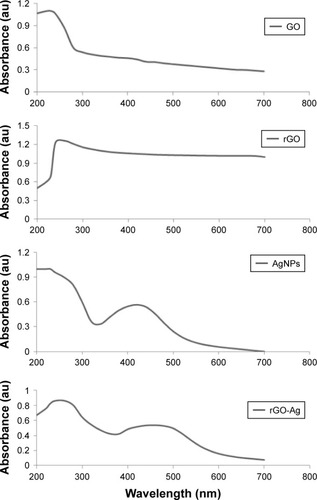
The precursor material GO for rGO-Ag synthesis was prepared by oxidation of Gt using strong oxidizing agents. In a typical synthesis process, an aqueous solution of GO with a concentration of 100 mg and 1 mM AgNO3 were mixed and stored at room temperature. Lycopene with a concentration of 5 µM was freshly prepared and added into the mixture of GO and AgNO3.Citation34 The synthesized GO, rGO, AgNPs, and rGO-Ag nanocomposites were initially characterized by UV–vis absorption spectroscopy (). UV–vis absorbance spectrum of GO exhibited two characteristic peaks at 230 and 300 nm, corresponding to the π–π* transitions of aromatic C−C bonds and n–π* transitions of C=O bonds, whereas the spectrum of rGO exhibited a characteristic band at 261 nm, indicating the restoration of the extensive conjugated sp2 carbon network. AgNPs showed a typical characteristic peak at 420 nm. Interestingly, rGO-Ag showed absorption peaks at 260 nm, and after the addition of AgNO3 into the suspension of GO-lycopene, there was a new absorbance band centered at 420 nm, which was assigned to the optical signatures of colloidal Ag, indicating the formation of Ag nanoparticles.Citation42 Observation of this peculiar peak, assigned to a surface plasmon, is well documented for various metal nanoparticles with sizes ranging from 2 to 100 nm.Citation42–Citation44 Meanwhile, the decoration of well-dispersed Ag on the surface of rGO was attributed to the direct redox reaction between lycopene and Ag+. In addition, the UV–vis spectroscopy suggested the simultaneous reduction of GO into rGO in the presence of lycopene. Similarly, Yang et al reported the green synthesis of silver-GO nanocomposites using tryptophan as a reducing and stabilizing agent.Citation45 Previously, several studies have reported the synthesis of silver-GO nanocomposites using plant extract, lactulose, and pepsin as reducing agents.Citation34,Citation35,Citation46 Our results are in accordance with the chemical reduction method using GO as substrate and stabilizer for the AgNPs. AgNPs-GO composites were synthesized through a facile solution-phase method by direct mixing of AgNO3 on GO matrix which was directly reduced by NaBH4.
Figure 1 Synthesis and characterization of GO, rGO, AgNPs, and rGO-Ag nanocomposites using UV–vis spectroscopy.
Notes: Spectra of GO exhibit a maximum absorption peak at ~230 nm, corresponding to the π–π transitions of aromatic C−C bonds. The absorption peak for rGO is red-shifted to 261 nm. AgNPs show a typical characteristic peak at 420 nm. A new peak at 420 nm is observed after deposition of AgNPs on the rGO surface; the band at 420 nm in the absorption spectrum of the rGO-Ag nanocomposites is attributed to surface plasmons and the presence of AgNPs. At least three independent experiments were performed for each sample, and reproducible results were obtained. The data present the results of a representative experiment.
Abbreviations: GO, graphene oxide; rGO, reduced graphene oxide; AgNPs, silver nanoparticles; rGO-Ag, reduced graphene oxide-silver.
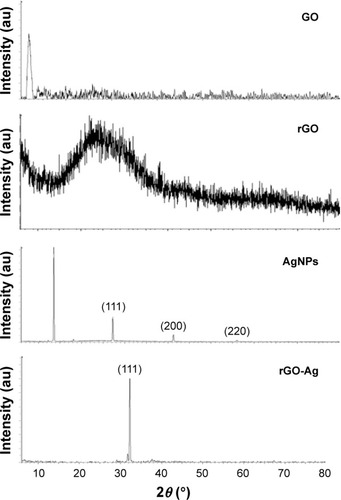
Next, we examined the crystal nature of GO, rGO, AgNPs, and rGO-Ag using X-ray diffraction (XRD; ). GO exhibited a strong peak at 11.2° corresponding to the (002) interplanar spacing of 0.78 Å, indicating the successful oxidation of Gt by modified Hummers method.Citation35,Citation47,Citation48 rGO exhibited a reflection peak at a low angle (2θ=25.9°) compared with the pattern of pristine Gt (2θ=26.5°). The XRD pattern of the synthesized AgNPs showed three different strong Bragg reflection peaks at 30.8°, 45.4°, and 64.5° corresponding to the planes of (111), (200), and (220), respectively, which can be indexed according to the facets of the face-centered cubic crystal structure of silver.Citation34 The results from rGO-Ag suggested that the sharp diffraction peak at 33.12° belonged to crystalline Ag, and also that it was more prominent than AgNPs, confirming the formation of high-purity Ag crystals in rGO-Ag nanocomposites.Citation28,Citation34,Citation35 The intensity ratio of (111) diffraction signals was higher than that shown in the standard file, indicating that the Ag nanoparticles are highly crystalline and abundant with (111) facets ().
Figure 2 XRD patterns of GO, rGO, AgNPs, and rGO-Ag nanocomposites.
Notes: In the XRD pattern of GO, a strong sharp peak at 2θ=11.2° corresponds to an interlayer distance of 7.6 Å. rGO has a broad peak centered at 2θ=25.9°, corresponding to an interlayer distance of 3.6 Å. AgNPs show three different strong Bragg reflection peaks at 30.8°, 45.4°, and 64.5° corresponding to the planes of (111), (200), and (220), respectively. The rGO-Ag nanocomposites show two different reflection peaks in the diffractogram at 33.12° corresponding to the (111) planes of fcc Ag. At least three independent experiments were performed for each sample, and reproducible results were obtained. The data present the results of a representative experiment.
Abbreviations: XRD, X-ray diffraction; GO, graphene oxide; rGO, reduced graphene oxide; rGO-Ag, reduced graphene oxide-silver; AgNPs, silver nanoparticles.
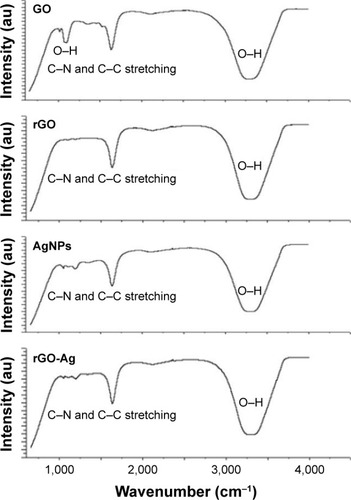
shows the Fourier transform infrared (FTIR) spectra of GO, rGO, AgNPs, and rGO-Ag. The spectra of rGO-Ag were completely different from GO.Citation35,Citation47,Citation48 The GO spectrum showed dominant peaks at 1,030, 1,620, and 3,400 cm−1. The peak at 1,030 cm−1 corresponded to the stretching vibration from the C−O−C bonds of epoxy or alkoxy groups. The peak at 1,720 cm−1 was attributed to C=O bonds in carboxylic acid and carbonyl moieties.Citation34 The adsorption band at ~1,620 cm−1 corresponded to the C=C bonding of aromatic rings within the GO carbon skeleton structure and also indicated C−N and C−C stretching. Interestingly, there was no significant peak characteristic of GO including the presence of different types of oxygen functionalities in GO between 3,400 and 3,600 cm−1 (O−H stretching vibrations), at 1,700 cm−1 (stretching vibrations from C=O) and at 1,220 cm−1 (C−OH stretching vibrations), which confirmed that GO was reduced thoroughly by lycopene.Citation35,Citation47,Citation48 The FTIR peak of rGO-Ag showed that O−H stretching vibration observed at 3,420 cm−1 was significantly reduced due to deoxygenation.Citation35,Citation47,Citation48 The FTIR results clearly indicated that AgNPs were decorated onto rGO. The obvious amide absorption peaks could be observed at 1,636 and 1,304 cm−1 in the spectra of rGO-Ag by simultaneous reduction of GO and Ag+ by lycopene. Furthermore, the typical OH group of GO observed at 1,030 cm−1 significantly reduced after reduction by lycopene.
Figure 3 FTIR spectra of GO, rGO, AgNPs, and rGO-Ag nanocomposites.
Note: Dried powders of GO, rGO, AgNPs, and rGO-AgNP nanocomposites were diluted with KBr to perform FTIR spectroscopy and spectrum GX spectrometry within the range of 500–4,000 cm−1.
Abbreviations: FTIR, Fourier transform infrared; GO, graphene oxide; rGO, reduced graphene oxide; AgNPs, silver nanoparticles; rGO-Ag, reduced graphene oxide-silver.
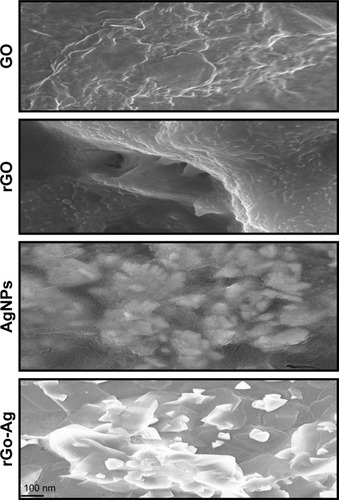
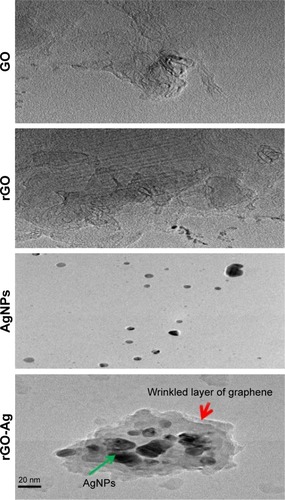
Scanning electron microscopy (SEM) studies were performed to examine the morphologies of GO, rGO, AgNPs, and rGO-Ag. As shown in , GO samples showed thick and multiple layers of aggregated and square-shaped crumpled sheets closely associated with each other forming a continuous conducting network.Citation34,Citation35,Citation40 The typical GO samples showed characteristic features of crumpled, folded, and closely restacked sheets, and the surface of GO exhibited a soft carpet-like morphology, possibly because of the presence of residual H2O molecules and hydroxyl or carboxyl groups.Citation34,Citation35,Citation40 rGO exhibited transparent rippled silk-like waves, or a flaky, scale-like, layered structure. Typical SEM images of the AgNPs showed well-dispersed spherical shape with an average size between 10 and 20 nm. SEM images of the rGO-Ag revealed that the as-formed AgNPs were homogeneously and uniformly deposited on the surface of the rGO nanosheets. The diameters of AgNPs were determined from the SEM and transmission electron microscopy (TEM) images, which were mainly in the range of 20–50 nm for Ag nanoparticles. The uniform and homogeneous decoration of metal nanoparticles on the rGO nanosheets indicated the successful reductions of both GO and Ag+ by lycopene.
Figure 4 SEM images of GO, rGO, AgNPs, and rGO-Ag nanocomposites.
Note: Representative SEM images of GO, rGO, AgNPs, and rGO-Ag nanocomposite dispersions at 500 µg/mL.
Abbreviations: SEM, scanning electron microscopy; GO, graphene oxide; rGO, reduced graphene oxide; AgNPs, silver nanoparticles; rGO-Ag, reduced graphene oxide-silver.
The surface morphology and size of GO, rGO, AgNPs, and rGO-Ag nanocomposites were determined by TEM analysis. shows the typical TEM images of GO, rGO, AgNPs, and rGO-Ag. GO exhibited a closely packed lamellar and plate structure with a clean surface. TEM images showed the typical flaky structure which had wrinkles and was wavy characteristic of transparent pure GO (). In contrast to GO, rGO showed typical sheetlike silky waves, wrinkled appearance, and clumped structure with a size of 20–100 nm. The lycopene-assisted synthesis produced AgNPs with significantly spherical shape with an average size of 20 nm.Citation34,Citation35,Citation40 The results from this studies were corrobo-rated with earlier reports on synthesis using various biomolecules such as tryptophan, plant extract, and pepsin.Citation34,Citation35,Citation40,Citation45 The morphologies and structures of rGO-Ag nanocomposites observed using TEM revealed rGO sheets with wrinkles and folds. The SEM and TEM images clearly showed that a large number of AgNPs were deposited onto GO, which may be ascribed to the strong interaction between lycopene and rGO via physical absorption in the form of hydrogen bonding and other molecular interactions.Citation49 The crystal-shaped AgNPs were deposited on the surface of rGO nanosheets.
Figure 5 TEM images of GO, rGO, AgNPs, and rGO-Ag nanocomposites.
Abbreviations: TEM, transmission electron microscopy; GO, graphene oxide; rGO, reduced graphene oxide; AgNPs, silver nanoparticles; rGO-Ag, reduced graphene oxide-silver.
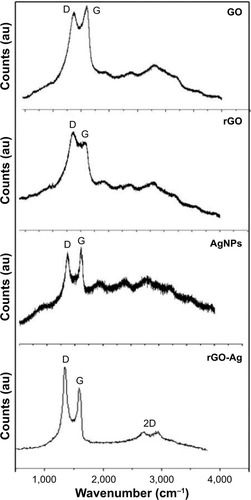
Raman spectroscopy is an ultimate tool to characterize the electronic and structural properties of carbon-based materials and also the structural property of nanocomposites.Citation35 The Raman spectroscopy images are shown in . The Raman spectrum of GO depicted that the G band was broadened and shifted to 1,601 cm−1, while a broadened D band at 1,349 cm−1 also appeared (). After the GO reduction by lycopene, the Raman spectrum of rGO showed a G band at 1,587 cm−1 and a D band at 1,354 cm−1. The Raman spectrum showed that the typical features of rGO are a D band at ~1,354 cm−1 and a G band at ~1,587 cm−1. The D band was assigned to the breathing mode of the k-point phonons with A1g symmetry, whereas the G band introduced the E2g phonon of the carbon sp2 atoms.Citation34,Citation35,Citation40 As shown in , the Raman spectrum of rGO-Ag depicted that the G band was broadened and shifted to 1,601 cm−1, while a broadened D band was observed at 1,351 cm−1 which is completely consistent with the Raman spectrum of rGO-Ag prepared using plant extracts.Citation35 The typical characteristic bands of graphene sheets in Raman spectra appeared including the G band (1,601 cm−1) that originated from the first-order scattering of the E2g phonons of the sp2-hybridized carbon atoms, the D band (1,351 cm−1) caused by a breathing mode of κ-point phonons with A1g symmetry of the defects involved in the sp3-hybridized carbon bonds such as hydroxyl and/or epoxide bonds, and the 2D band (2,690 cm−1) which is much sensitive to stacking of graphene sheets. As shown in , the G band of the rGO-Ag nanocomposites displayed at 1,601 cm−1 and the D band at 1,351 cm−1, consistent with previous research showing that the introduction of Ag caused the upshift of the G band by electron–phonon coupling.Citation35 The intensity ratio of the D to G bands (ID/IG) is often used as a measure of the defect levels in graphitic systems. The Raman spectra of AgNPs shown in are in significant agreement with previous results. Two strong peaks at 1,591 and 1,389 were observed corresponding to G and D bands. Upon the introduction of Ag, the ratio of ID/IG increased to 2.1 (rGO-Ag nanocomposites) from 1.54 (GO).Citation35 The presence of rGO-Ag in the composites enhanced the relative intensity ratio of D/G, which represents the degree of disorder. The 2D band is well known for distinguishing the thickness of the graphene sheets. After the simultaneous reductions of GO and Ag+ by lycopene, a broad 2D band at 2,690 cm−1 for the rGO-Ag nanocomposites was observed, which further confirmed the presence of a few layers of graphene sheets in the as-prepared nanocomposites. On the basis of the UV–vis, XRD, FTIR, SEM, TEM, and Raman spectroscopy characterizations, it can be concluded that the results can be attributed to successful preparation of rGO-Ag using lycopene as reducing agent.
Figure 6 Raman spectroscopy analyses of GO, rGO, AgNPs, and rGO-Ag nanocomposites.
Notes: Raman spectra of GO, rGO, AgNPs, and rGO-Ag nanocomposites were obtained using a laser excitation wavelength of 532 nm at the power of 1 mW, after the removal of background fluorescence. The ratio of ID/IG increased to 2.1 (rGO-Ag nanocomposites) from 1.54. At least three independent experiments were performed for each sample, and reproducible results were obtained. Two dimensional Raman (2D)-band is a second-order two-phonon process.
Abbreviations: GO, graphene oxide; rGO, reduced graphene oxide; AgNPs, silver nanoparticles; rGO-Ag, reduced graphene oxide-silver; ID, intensity of D band; IG, intensity of G band.
Dose-dependent effect of rGO-Ag and TSA on cell viability of human ovarian cancer cells
Based on the previous and current study, a significant cell viability reduction was observed in cells treated with rGO-Ag than other tested nanomaterials such as GO, rGO, and AgNPs. Therefore, further study was focused on rGO-Ag. In order to evaluate the combination effect of rGO-Ag nanocomposites and TSA on cell viability, we first examined the effect of as-prepared rGO-Ag nanocomposites which showed significant stability and solubility in water without any aggregation due to the strong interactions between the rGO sheets and Ag molecules.Citation34 To show the potential applications of rGO-Ag nanocomposites obtained by lycopene-mediated synthesis as anticancer agent, the in vitro cytotoxicity of the rGO-Ag nanocomposites on ovarian cancer cells (SKOV3) was determined using the MTT assay. The cells were treated with rGO-Ag (0.1–0.5 µM) or TSA (0.1–0.5 µM) for 24 h. The results clearly indicated that increasing concentration of either rGO-Ag nanocomposites or TSA significantly inhibited the cell viability of ovarian cancer cells in a dose-dependent manner (). SKOV3 cells treated with 0.30 µM rGO-Ag had a 50% reduction in cell viability (). Thus, the IC50 value of rGO-Ag nanocomposites in SKOV3 cells was determined to be 0.30 µM. As we expected, increasing concentration of rGO-Ag nanocomposites increased the loss of cell viability. Interestingly, when compared to rGO-Ag nanocomposites prepared using plant extract as reducing agent, rGO-Ag nanocomposites prepared using lycopene as reducing agent showed remarkable effect on cell viability, which is due to the type of capping agent used for their synthesis.Citation35 The reason for the strong inhibitory activity could be the type of cells we used for this experiment or the type of reducing agent used for synthesis of rGO-Ag nanocomposites.
Figure 7 Dose-dependent effects of rGO-Ag and TSA on the viability of human ovarian cancer cells (SKOV3).
Notes: (A) Cell viability of SKOV3 was determined after 24-h exposure to different concentrations of rGO-Ag. (B) Cell viability of SKOV3 was determined after 24-h exposure to different concentrations of TSA using the MTT assay. The results are expressed as the mean ± standard deviation of three independent experiments. A significant difference was observed from 0.1 to 0.5 µM. The viability of treated cells was compared to that of the untreated cells using Student’s t-test (*P<0.05).
Abbreviations: rGO-Ag, reduced graphene oxide-silver; TSA, trichostatin A.
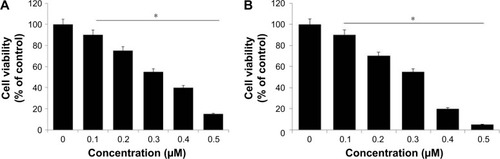
Next, we determined the effect of TSA on cell viability of SKOV3. The cells treated with TSA showed dose-dependent effect, as well as increasing concentration of TSA induced severe loss of cell viability. SKOV3 cells treated with 0.3 µM of TSA had a 50% reduction in cell viability (). Thus, the IC50 value of TSA in SKOV3 cells was determined to be 0.3 µM (300 nM). Our results corroborated with an earlier report which showed that TSA showed different antiproliferative and antitumor activities in eight breast carcinoma cell lines with an IC50 value between 26.4 and 308.1 nM.Citation19 The sensitivity of TSA and depsipeptide was analyzed across panels of lung cancer, breast cancer, and melanoma cell lines, and the results showed distinct sensitivities to one inhibitor and resistance to other inhibitor. However, TSA had greater specificity for cancer vs normal cells compared with other HDACIs.Citation50 Meng et al found that TSA inhibits the cell viability of SKOV3 in a dose-dependent manner.Citation51 In another study, rheumatoid arthritis fibroblasts (RA-FLSs) like synoviocytes were subjected to hypoxia for 24 h in the presence or absence of 2 µM TSA and tested for cell viability, apoptosis, invasion, and gene expression. The results from this study suggested that TSA at a concentration up to 2 µM did not affect the viability of normal FLSs, and similarly, the hypoxic exposure did not affect the viability and apoptosis of RA-FLSs after 48-h incubation. Remarkably, treatment with 2 µM TSA significantly inhibited the viability of hypoxic RA-FLSs, compared to control treated with DMSO. Moreover, 2 µM concentration of TSA induced significant apoptosis in RA-FLSs, leading to an approximately eightfold increase in the percentage of apoptosis.Citation52 A new HDACI AR-42 seems to be a potent inhibitor of HDAC activity and have the ability to significantly inhibit cell survival through its pleiotropic effects in both canine and human osteosarcoma cells.Citation53 Collectively, both rGO-Ag and TSA caused dose-dependent viability loss in SKOV3 cells.
Combination effect of rGO-Ag and TSA on cell viability and cell morphology of SKOV3
To develop strategies for killing cancer cells efficiently using the correct combination of two different anticancer agents, herein we selected rGO-Ag nanocomposites and TSA. Combined treatment with two different agents at low concentration is more efficient against cancer than treatment with either drug alone. We selected two compounds known to inhibit cell viability by ~25% at low concentration, rGO-Ag (0.20 µM) and TSA (0.20 µM), to study the synergistic effects on cell growth in vitro for further combination experiments. The cells were treated with rGO-Ag (0.20 µM) alone, TSA (0.20 µM) alone, or combination of both rGO-Ag (0.20 µM) and TSA (0.20 µM) for 24 h. MTT assays were performed to evaluate the effects of these combinations on cell viability. To find the maximal effect using low concentration of TSA and rGO-Ag we selected IC25. When the cells were treated with single agent alone, we observed there was growth reduction. However, when the same reagents were used in combination, they exhibited significant cytotoxicity (). Interestingly, rGO-Ag had similar anticancer activity when used in combination with TSA. Similarly, a novel HDACI panobinostat (LBH589) decreased cell viability of both chemosensitive and chemoresistant ovarian cancer cell lines.Citation54 Therefore, further experiments were carried out using low concentrations of rGO-Ag (0.20 µM) or TSA (0.20 µM) or combination of rGO-Ag (0.20 µM) and TSA (0.20 µM).
Figure 8 Effects of rGO-Ag alone or TSA alone or the combinatorial effect of rGO-Ag and TSA on cell viability and cell morphology of SKOV3.
Notes: (A) SKOV3 cells were treated with rGO-Ag (0.2 µM) alone, TSA (0.2 µM) alone, or combination of both rGO-Ag (0.2 µM) and TSA (0.2 µM) for 24 h. The cell viability was determined using MTT assay. The results are expressed as the mean ± standard deviation of three independent experiments. A significant difference was observed between control and treated cells. The viability of treated cells was compared to that of the untreated cells using Student’s t-test (*P<0.05). (B) Phase contrast microscopy data showing the morphological appearance of SKOV3 cells treated with rGO-Ag (0.2 µM) alone, TSA (0.2 µM) alone, or combination of both rGO-Ag (0.2 µM) and TSA (0.2 µM) for 24 h.
Abbreviations: rGO-Ag, reduced graphene oxide-silver; TSA, trichostatin A.
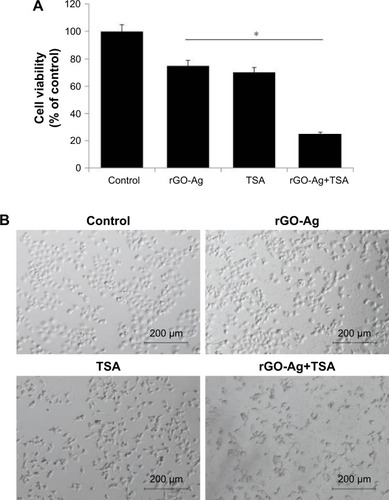
To gain further evidence for the combination effect, we analyzed the morphology of cells. The cells were treated with rGO-Ag (0.20 µM) alone, TSA (0.20 µM) alone, or combination of both rGO-Ag (0.20 µM) and TSA (0.20 µM) for 24 h. As shown in , SKOV3 cells treated with TSA alone for 24 h, compared with the control group, became larger or fingerlike, and the gap between the cells widened.Citation55 The cells treated with rGO-Ag or TSA alone shrank and became smaller and round in shape. When treated with rGO-Ag combined with TSA, cell density decreased significantly, and the number of dead cells obviously increased. Interestingly, the cells became elongated like neuronal cells, and increased cell attachment was observed. Similarly, altered morphology was observed in A549 cells treated with TSA and cisplatin. Combination treatment of TSA and cisplatin showed better efficacy than single drugs and significantly suppressed cell viability, migration, and spheroid formation and growth in human ovarian cancer cells.Citation51 The combined treatment of TSA and cisplatin synergistically inhibited cell proliferation, induced apoptosis, and increased the inhibition rate via significant decrease of cFLIP expression and increase of caspase-8 in A549 cells.Citation55 Similarly, TSA combined with palladium nanoparticles (PdNPs) showed an excellent synergistic effect on apoptosis in human cervical cancer cells.Citation25 TSA interacted synergistically with the proteasome inhibitor PS-341, resulting in inhibition of proliferation and a marked increase in apoptosis and rate of G2/M arrest in both human ovarian cancer cell lines including A2780 and taxane-resistant ovarian cancer cell lines including A2780T.Citation56 Altogether, the combination effect of rGO-Ag (0.20 µM) and TSA (0.20 µM) was significant on cell viability and morphology, which are preliminary characteristics of cell death.
rGO-TSA and TSA enhance production of ROS
ROS play an important role in a variety of normal biochemical and physiological functions and abnormal pathological processes; the continuous production of ROS is balanced by elimination of excess level of ROS from the biological system.Citation57 Mitochondrial respiratory chain is a major source of ROS generation in the cells. Anticancer com-pounds such as nanoparticles and chemotherapeutic agents cause malfunction of mitochondria, which in turn induce cell death in a variety of cancer cells.Citation34,Citation40,Citation57 Previously, several studies have suggested that a variety of chemotherapeutic agents such as HDACIs,Citation58 redox cycling agents,Citation59 proteasome inhibitors,Citation60 and silver and graphene nanoparticles induce oxidative stress in the cells and eventually lead to cell death.Citation34,Citation48,Citation61 To examine the change in intracellular ROS level caused by oxidative stress, SKOV3 cells were treated with rGO-Ag (0.20 µM) alone, TSA (0.20 µM) alone, or combination of both rGO-Ag (0.20 µM) and TSA (0.20 µM) for 24 h, and ROS levels were measured using the cell-permeable substrate DCFH-DA. As shown in , intracellular ROS levels were increased by both single treatment and treatment with combination of both rGO-Ag (0.20 µM) and TSA (0.20 µM). ROS-positive cells from each group were counted, and the intensity ratio was found to be increased in the combined treatment group, which indicates synergistic interaction between rGO-Ag and TSA. The fluorescence intensity directly indicated that the cell viability gradually decreased by combination treatment and that ROS induced by oxidative stress affect cell viability. Jeong and Cho reported that TSA could control the level of intracellular ROS through SOD2 and FOXO1 in human bone marrow mesenchymal stem cells.Citation106 Generally, silver, GO, zinc oxide, and PdNPs are known to induce ROS generation and eventually cause cell death.Citation36,Citation48,Citation61,Citation62 TSA induced apoptosis in breast cancer cells through mitochondrial respiratory chains and increased ROS generation.Citation63 Therefore, the combination of both rGO-Ag and TSA causes enhanced production of ROS and is responsible for cell death.
Figure 9 Combination effect of rGO-Ag and TSA on ROS level.
Notes: (A) Intracellular ROS levels were measured with fluorescence imaging using the DCFH-DA probe in cells cultured in the presence of rGO-Ag (0.2 µM) alone, TSA (0.2 µM) alone, or combination of both rGO-Ag (0.2 µM) and TSA (0.2 µM) for 24 h Scale bars =100 µm. (B) The quantitative measurement of ROS in SKOV3 cells using DCFH-DA. The results are expressed as the mean ± standard deviation of three independent experiments. There was a significant difference in the ROS generation of treated cells compared to that of the untreated cells as assessed using Student’s t-test (*P<0.05).
Abbreviations: Con, control; rGO-Ag, reduced graphene oxide-silver; TSA, trichostatin A; ROS, reactive oxygen species; DCFH-DA, dichloro-dihydro-fluorescein diacetate.
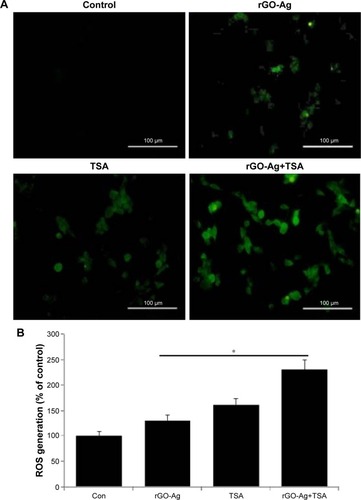
The role of rGO-Ag and TSA and the enhancement of ROS production by TSA were further analyzed quantitatively. The results revealed a pronounced increase in ROS levels, reflected by the oxidation-sensitive dye H2DCFDA. rGO-Ag administered alone did induce the generation of ROS, but the combination of both rGO-Ag and TSA showed a greater effect (). The data from these findings provide evidence that early ROS generation mediated by rGO-Ag plays a critical role in sensitizing human ovarian cancer cells to TSA-induced cell death. Our results are in line with previous studies that had demonstrated the increase in ROS generation when cells were exposed to structurally diverse HDACIs.Citation4,Citation25
Effect of rGO-Ag and TSA on the level of oxidative and antioxidative stress markers
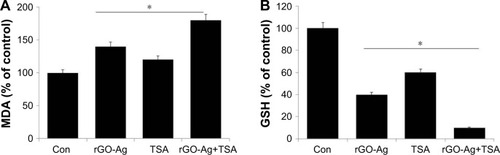
ROS could modulate various biological responses, including cellular proliferation, apoptosis, and necrosis.Citation57 ROS are able to control the level of oxidant and antioxidant enzymes.Citation57,Citation64 The exposure of cancer cells to chemotherapeutic agents, cytotoxic agents, and nanoparticles depletes the cellular antioxidants and leads to apoptosis probably by pushing the ROS stress level beyond the threshold.Citation25,Citation34,Citation57,Citation64,Citation65 Based on the considerations, we analyzed the level of MDA and GSH in SKOV3 cells treated with rGO-Ag (0.20 µM) alone, TSA (0.20 µM) alone, or combination of both rGO-Ag (0.20 µM) and TSA (0.20 µM) for 24 h. The results from this study indicated that rGO-Ag increased the level of MDA more (40%) than TSA (20%); however, the combination effect was very significant (80%) than the effect of rGO-Ag or TSA alone (). A previous report also suggested that the level of MDA was higher in cells treated with PdNPs rather than TSA.Citation25 The results of our study are also in line with other previously published reports, suggesting that AgNPs and combination of GO and AgNPs significantly increased the level of NO and MDA in human ovarian cancer cells.Citation34,Citation49 Similarly, the antioxidant marker GSH was dramatically decreased when SKOV3 cells were exposed to rGO-Ag or TSA or combination of rGO-Ag and TSA. Interestingly, rGO-Ag has potential effect on both MDA and GSH levels (). Our studies are consistent with previously published reports suggesting that PDNPs and combination of TSA and PdNPs significantly increase the level of oxidative stress in human cervical cancer cells.Citation25,Citation34,Citation66,Citation67 The ROS which increased as a result of combination treatment could easily react with membrane lipids, causing an alteration of membrane permeability, DNA damage and genomic instability, and loss of activity of enzymes and eventually proteins rendering the cells more susceptible to proteolytic degradation.Citation68 Some studies showed that rGO-Ag/TSA toxicity was accompanied by increased production of ROS and/or GSH depletion and decreased the activity of antioxidant enzymes, which contributed to decreased cell viability, genotoxic events, and/or apoptosis together with AgNPs toxicity in human lung cancer cells.Citation69,Citation70 Similarly, rGO increases ROS level in various types of cancer cells including human lung cancer, breast cancer, and ovarian cancer cells.Citation34,Citation71,Citation72 Altogether, the elevated level of ROS causes the imbalance of oxidant and antioxidant levels in the cells, which is one of the reasons for cell death.
Figure 10 Effect of rGO-Ag and TSA on MDA and GSH levels.
Notes: SKOV3 cells were treated with rGO-Ag (0.2 µM) alone, TSA (0.2 µM) alone, or combination of both rGO-Ag (0.2 µM) and TSA (0.2 µM) for 24 h. After incubation, the cells were harvested and washed twice with an ice-cold PBS solution. The cells were collected and disrupted by ultrasonication for 5 min on ice. The concentrations of (A) MDA and (B) GSH were measured on a microplate reader at wavelengths of 530 and 405 nm, respectively. *P<0.05.
Abbreviations: Con, control; rGO-Ag, reduced graphene oxide-silver; TSA, trichostatin A; MDA, malondialdehyde; GSH, glutathione; PBS, phosphate-buffered saline.
rGO-Ag and TSA increase the leakage of LDH and dead-cell protease activity
When cells are treated with cytotoxic compounds like HDACIs, nanoparticles, and anticancer drugs, the living cells are subjected to cell death as the cell membranes are compromised by swelling and lose membrane integrity before shutting down and releasing their intracellular contents into the surrounding environment. Among several cytotoxicity indicators, LDH is soluble and stable when compared to adenylate kinase and glucose-6-phosphate, and it is considered to be a preferred marker of cell death in in vitro cell models.Citation73 LDH is released into the surrounding extracellular space, and the presence of this enzyme in the culture medium indicates cell death. To measure the severity of toxicity, the cells were treated with rGO-Ag (0.20 µM) alone, TSA (0.20 µM) alone, or combination of both rGO-Ag (0.20 µM) and TSA (0.20 µM) for 24 h, and then LDH was measured. The percentage of LDH released into the culture medium (% LDH released) was measured as an index of cellular death. SKOV3 cells treated with combination of both rGO-Ag (0.20 µM) and TSA (0.20 µM) showed an increased percentage of leakage of LDH compared with untreated cells as well as cells treated with rGO-Ag (0.20 µM) alone or TSA (0.20 µM) alone (). Niki et alCitation74 reported that TSA suppresses myofibroblastic differentiation and proliferation of rat hepatic stellate cells in primary culture by LDH leakage, albumin secretion, epoxide hydrolase activity, and 7-ethoxycoumarin O-deethylase activity. The combination of TSA and PdNPs increases LDH leakage in human cervical cancer cells.Citation25 Collectively, the combination of rGO-Ag and TSA potentially induces cell death in SKOV3 cells through enhanced leakage of LDH.
Figure 11 Effect of rGO-Ag and TSA on leakage of LDH and dead-cell protease activity in SKOV3 cells.
Notes: (A) LDH activity was measured at 490 nm using the LDH cytotoxicity kit. The results are expressed as the mean ± standard deviation of three independent experiments. There was a significant difference in the LDH activity of treated cells compared to that of the untreated cells. (B) The level of dead-cell protease was determined by CytoTox-Glo cytotoxicity assay. The results are expressed as the mean ± standard deviation of three independent experiments. Differences between the treated and control groups were measured using Student’s t-test. Statistically significant differences between the treated and control groups are indicated by an asterisk (*P<0.05).
Abbreviations: Con, control; rGO-Ag, reduced graphene oxide-silver; TSA, trichostatin A; LDH, lactate dehydrogenase.
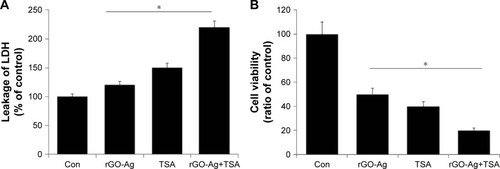
Next, we examined dead-cell protease activity, which is another marker of cell death. Recently, cell viability or cytotoxicity was measured using specific proteolytic profile, similar to LDH assays.Citation75 Here, cytotoxicity was measured by the release of protease(s) into the culture medium as a result of cell death, cleaving the substrates releasing a detectible reporting molecule, and was represented as the ratio of cell viability. To evaluate the dead-cell protease activity, SKOV3 cells were treated with rGO-Ag (0.20 µM) alone, TSA (0.20 µM) alone, or combination of both rGO-Ag (0.20 µM) and TSA (0.20 µM) for 24 h. The results revealed that the viability of SKOV3 cells significantly decreased to 50%, 60%, and 80%, respectively (). This clearly suggests that the combination of rGO-Ag and TSA induced significantly higher cytotoxicity than either rGO-Ag alone or TSA alone. The combined treatment with TSA and gemcitabine synergistically inhibited the growth of four different pancreatic adenocarcinoma cell lines and induced apoptosis via increased ROS generation and cytotoxicity.Citation76 GO-AgNPs induced significant leakage of LDH and cytotoxicity than either AgNPs or GO alone in human ovarian cancer cells.Citation34 Similarly, GO-Ag nanocomposites were more toxic than pristine GO and pristine AgNPs to both tumoral macrophages such as J774 and peritoneal macrophages collected from BALB/c mouse, which significantly induced more ROS production compared to pristine AgNPs.Citation107 When rat pheochromocytoma cells (PC12 cells) were treated with graphene and reduced graphene nanoparticles, they experienced mitochondrial injury and cytotoxic effects, such as the release of LDH, an increase in the activation of caspase-3, and the generation of ROS.Citation77 The results from this study clearly indicated that the treatment with combination of rGO-Ag and TSA causes significant toxicity than either rGO-Ag or TSA alone.
rGO-Ag and TSA cause mitochondrial dysfunction
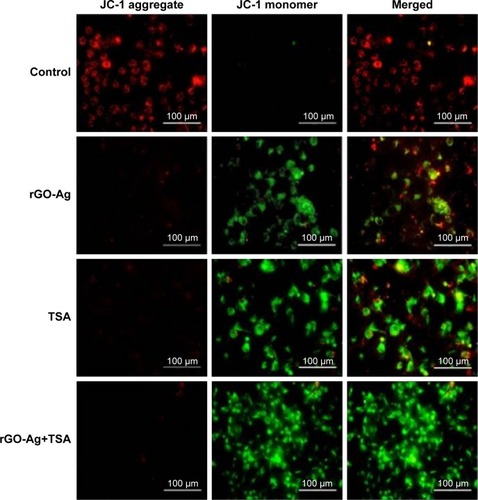
HDACIs induce apoptosis in cancer cells through either extrinsic (death receptor) or intrinsic (mitochondria) pathways via upregulating proapoptotic and downregulating antiapoptotic proteins, which have considerable therapeutic potential for the treatment of cancer.Citation78 ROS act as second messengers in a variety of signaling pathways involved in apoptosis by inducing cellular macromolecular damage–such as membrane lipid breakdown, DNA fragmentation, protein denaturation, and mitochondrial dysfunction–increase in the level of oxidants, and decrease in the level of antioxidants.Citation34,Citation47,Citation79 The loss of mitochondrial membrane potential (MMP) is an early event of apoptosis. In order to determine if ROS induced mitochondrial dysfunction, we measured MMP using JC-1 monomer assay. As shown in , decreases in mitochondrial energy transduction were observed following treatment of SKOV3 cells with rGO-Ag (0.20 µM) alone, TSA (0.20 µM) alone, or combination of both rGO-Ag (0.20 µM) and TSA (0.20 µM) for 24 h. The results showed disappearance of red fluorescence (aggregates) and emergence of green fluorescence (monomer) in all the treated SKOV3 cells but not in the control group, whereas green fluorescence was slightly lower in rGO-Ag-treated cells than in TSA-treated cells (). However, the cells treated with combination of both rGO-Ag and TSA showed significantly higher green fluorescence, indicating that rGO-Ag and TSA could cause MMP collapse, and eventually, both rGO-Ag and TSA could induce apoptosis through a mitochondria-mediated apoptotic pathway. Altogether, the results suggest that the combination triggered pronounced mitochondrial dysfunction. The loss of MMP was observed in cells treated with either rGO-Ag alone, TSA alone, or combination of both rGO-Ag and TSA, which is in agreement with the higher ratio of JC-1 monomers to JC-1 aggregates found in treated cells when compared to untreated cells. A recent study suggests that the combination of TSA and TRAIL effectively induces apoptosis in human renal carcinoma cells through loss of MMP.Citation80 Mitochondrial dysfunction is correlated with two major changes which include changes in the permeabilization of the outer mitochondrial membrane and the loss of the electrochemical gradient.Citation34,Citation81 Previously, several studies have reported that HDACIs have the potential to trigger depolarization of the mitochondrial membrane,Citation82,Citation83 which can induce ROS generation. In addition, HDACIs induce the release of proapoptotic Bax and trigger apoptosis via the mitochondrial pathway.Citation84 Graphene or GO-AgNP nanocomposites are known to increase intracellular ROS through depletion of the MMP after internalization and accumulation in the cell cytoplasm, perinuclear space, and nucleus, and finally induce apoptosis through activation of the mitochondrial pathway.Citation40,Citation85
Figure 12 Effects of rGO-Ag alone or TSA alone or the combinatorial effect of rGO-Ag and TSA on mitochondrial membrane permeability.
Notes: SKOV3 cells were treated with rGO-Ag (0.2 µM) alone, TSA (0.2 µM) alone, or combination of both rGO-Ag (0.2 µM) and TSA (0.2 µM) for 24 h. Mitochondrial membrane potential (Δψm) was evaluated using JC-1 assay. Red fluorescence indicates JC-1 aggregates within mitochondria in healthy cells, whereas green fluorescence indicates JC-1 monomers in the cytoplasm and loss of Δψm. Scale bars =100 µm.
Abbreviations: rGO-Ag, reduced graphene oxide-silver; TSA, trichostatin A.
Effect of rGO-Ag and TSA on proapoptotic and antiapoptotic gene expression
It is well known that nanoparticles such as silver, GO, rGO, and PdNPs, as well as chemotherapeutic agents and HDACIs can induce several genes involved in apoptosis including p52, Bax, Bak, and caspases, and downregulate Bcl-2, which are mainly regulating the cell death pathways including the activation of proapoptotic BH3-only Bcl-2 family proteins and mitochondrial membrane disruption, leading to activation of the mitochondrial apoptotic pathway. Therefore, we investigated the combination effect of rGO-Ag and TSA on proapoptotic and antiapoptotic genes which are mainly controlling the apoptotic pathway. SKOV3 cells were treated with rGO-Ag (0.20 µM) alone, TSA (0.20 µM) alone, or combination of both rGO-Ag (0.20 µM) and TSA (0.20 µM) for 24 h, and then gene expression analysis was performed. As reported earlier, AgNPs modulated HT22 cell cycle and proliferation and induced oxidative stress, which were accompanied by elevated levels of p53 and p21.Citation86 The cells treated with rGO-Ag alone, TSA alone, or combination of both rGO-Ag and TSA exhibited increased expression of p53, Bax, Bak, caspase-3, and caspase-9, and downregulation of Bcl-2 (). This corroborates with findings from earlier studies which showed that treatment with combination of GO and AgNPs and combination of salinomycin and AgNPs profoundly induced p53 and p21 expression in human breast cancer cells, ovarian cancer cells, and HT22 hippocampal neuronal cells.Citation34,Citation40,Citation87 Combination of TSA and quercetin induced apoptosis through p53 activation in mouse tumors compared to control or cells treated with TSA alone.Citation88 The results from previous studies and the findings of the present study show that the combination of rGO-Ag and TSA induces cell death in a p53-dependent manner in human ovarian cancer cells.
Figure 13 The effect of combined treatment of rGO-Ag and TSA on the expression of apoptotic and antiapoptotic genes.
Notes: Relative mRNA expression was analyzed using qRT-PCR in SKOV3 cells treated with rGO-Ag (0.2 µM) alone, TSA (0.2 µM) alone, or combination of both rGO-Ag (0.2 µM) and TSA (0.2 µM) for 24 h. The results are expressed as the mean ± standard deviation of three separate experiments. Differences between the treated and control groups were measured using Student’s t-test. Statistically significant differences between the treated and control groups are indicated by an asterisk (*P<0.05).
Abbreviations: Con, control; rGO-Ag, reduced graphene oxide-silver; TSA, trichostatin A; qRT-PCR, quantitative reverse transcription polymerase chain reaction.
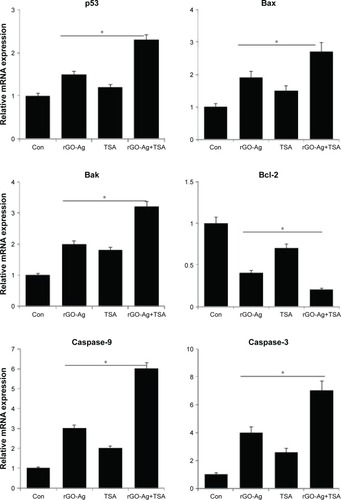
Bax is an important proapoptotic protein that triggers mitochondria-mediated apoptosis by permeabilizing mitochondrial outer membranes and is also essential in both p53-dependent and p53-independent apoptosis. Bax is directly activated by p53 and is a direct target of p53.Citation89 These suggest that both rGO-Ag and TSA induce apoptosis in SKOV3 cells in a Bax/Bak-dependent manner. HDACIs, including TSA, FK228, suberoylanilide hydroxamic acid (SAHA), and LBH589, decrease the expression of Bcl-2, Bcl-xL, and XIAP, and enhance the expression of proapoptotic proteins, such as Bax and Bak, thereby enhancing TRAIL-mediated cytotoxicity in a variety of cancer cells via the amplification of intrinsic as well as extrinsic apoptotic pathways.Citation90 HDACIs can disrupt mitochondrial membrane permeability and eventually induce the release of proteins, including cytochrome c and SMAC. Cytochrome c release leads to apoptosome formation and activation of caspase-9. Caspase-8 and caspase-9 can then cleave caspase-3, caspase-6, and caspase-7, terminating in apoptosis.Citation91 The most noteworthy finding from our studies is the stimulation of a strong proapoptotic transcriptional response, consisting of the downregulation of antiapoptotic Bcl2 gene and the upregulation of proapoptotic genes, which were transcriptionally altered in rGO-Ag- and TSA-treated cells, which is the major responsible apoptotic pathway in cancer cells.
rGO-Ag and TSA potentially induce apoptosis
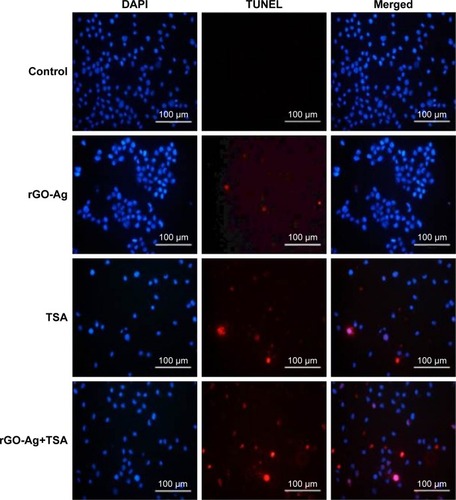
One of the major mechanisms involved in the activation of the mitochondrial pathway is the activation of the DNA damage response via ROS-mediated response. Previously, several studies have supported that the interactions of graphene and graphene-related materials with cells lead to excessive ROS generation. ROS is the major factor inducing apoptosis by various mechanisms of macromolecular damage, such as lipid peroxidation, DNA fragmentation, protein denaturation, and mitochondrial dysfunction.Citation34,Citation79,Citation92 Graphene and graphene-related nanoparticles possess significant genotoxic properties due to their small size, high surface area, and high surface charge. A previous study suggested that HDAC inhibition produces an increase in ROS and that this could contribute to the promotion of DNA damage.Citation93 A finding from a previous experiment in this study suggested that the combination of rGO-Ag and TSA potentially induces caspase-9 and caspase-3. As caspases are responsible for DNA fragmentation, we intended to determine if rGO-Ag/TSA induce cell death via DNA fragmentation. Therefore, TUNEL assay was performed to understand whether the combination of rGO-Ag and TSA could induce DNA fragmentation by ROS. SKOV3 cells were treated with rGO-Ag (0.20 µM) alone, TSA (0.20 µM) alone, or combination of both rGO-Ag (0.20 µM) and TSA (0.20 µM) for 24 h. The results indicated that treatment with rGO-Ag (0.20 µM) alone, TSA (0.25 µM) alone, or combination of both rGO-Ag (0.25 µM) and TSA (0.20 µM) led to a significant number of TUNEL-positive SKOV3 cells, whereas no apoptotic cells were observed in the control (). Interestingly, the combination of both rGO-Ag and TSA led to a pronounced degree of fragmentation when compared to the cells treated with single agent alone. This indicates that the combination of rGO-Ag and TSA could induce severe fragmentation of DNA associated with the induction of apoptosis. Previously, we found that combination of TSA and PdNPs induces significant level of apoptosis in human cervical cancer cells.Citation25 Similarly, rGO-Ag nanocomposites produced pronounced DNA fragmentation than GO and AgNPs alone. Consistent with our findings, previous studies have reported that HDACIs, sodium butyrate, and TSA can effectively induce growth arrest and apoptosis in a variety of cancer cell lines including colon cancer, T-cell lymphoma, and erythroleukemic cells.Citation94,Citation95 Altogether, observations from several studies indicated that the combination of two cytotoxic molecules such as GO and AgNPs or rGO-Ag and TSA produces a significant level of cytotoxicity and apoptosis.Citation25,Citation34
Figure 14 Effects of rGO-Ag alone or TSA alone or in combination on apoptosis in SKOV3 cells.
Notes: SKOV3 cells were treated with rGO-Ag (0.2 µM) alone, TSA (0.2 µM) alone, or combination of both rGO-Ag (0.2 µM) and TSA (0.2 µM) for 24 h. Apoptosis was assessed by TUNEL assay; the nuclei were counterstained with DAPI. Representative images show apoptotic (fragmented) DNA (red staining) and the corresponding cell nuclei (blue staining).
Abbreviations: rGO-Ag, reduced graphene oxide-silver; TSA, trichostatin A; TUNEL, terminal deoxynucleotidyl transferase-mediated dUTP nick end labeling.
rGO-Ag and TSA enhance the expression of Rad51
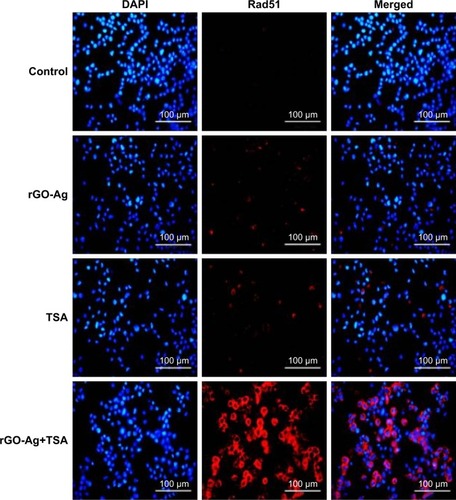
Cancer therapeutic agents exert their cytotoxic effects by inducing DNA damages including modification of bases, intra-strand cross-links, inter-strand cross-links (ICLs), DNA–protein cross-links, single-strand breaks, and double-strand breaks (DSBs).Citation96 To verify the combination effect of rGO-Ag and TSA on DNA DSBs, we used Rad51, a marker of DNA DSB repair, to measure the activity of homologous recombination in the repair of ICL. Rad51 is a DNA-dependent ATPase that forms a filament on single-stranded DNA and promotes strand invasion with a homologous double-stranded partner.Citation96 SKOV3 cells were treated with rGO-Ag (0.2 µM) or TSA (0.2 µM), or combination of both rGO-Ag (0.2 µM) and TSA (0.2 µM) for 24 h. The results depicted the more pronounced Rad51 foci formation in the cells treated with combination of rGO-Ag and TSA compared to cells treated with either rGO-Ag alone or TSA alone (). Rad51 foci appeared in many micronuclei 24 h after exposure. Although Rad51 foci may only mark a subset of the DSBs, the number of residual Rad51 foci per cell was invariably higher in the combined treatment group than in the single treatment group. The present study clearly demonstrates that rGO-Ag and TSA inhibited the growth of ovarian cancer cells through induction of apoptosis and DNA damage in vitro. Furthermore, both HDACI and the combination of graphene materials with AgNPs could induce apoptosis through DNA damage in ovarian cancer cells. Therefore, rGO-Ag/TSA acts as a potent genotoxin by inducing marked accumulation of DNA DSBs. The results indicated that treatment with rGO-Ag/TSA triggered a cascade that includes DNA damage and apoptosis. The evidences from previous studies suggest that high expression of Rad51 correlates with an enhanced propensity of tumor cells for invasiveness.Citation97 Doxorubicin treatment could induce the expression of Rad51 and increase Rad51 foci, leading to disruption of cell cycle. The cell cycle disruption is an important factor causing DNA damage and apoptosis in multiple myeloma cells.Citation98 In this study, we found that the combination of rGO-Ag and TSA was effective to induce apoptosis in cancer cells and cause rapid DNA damage response, represented by Rad51 foci formation.
Figure 15 Estimation of nuclear DNA damage in SKOV3 cells after exposure to rGO-Ag or TSA alone or combination of rGO-Ag and TSA for 24 h using RAD51 antibody.
Notes: Nuclear RAD51 foci was estimated in SKOV3 cells exposed to rGO-Ag (0.2 µM) alone, TSA (0.2 µM) alone, or combination of both rGO-Ag (0.2 µM) and TSA (0.2 µM) for 24 h. Scale bars =100 µm.
Abbreviations: rGO-Ag, reduced graphene oxide-silver; TSA, trichostatin A.
rGO-Ag and TSA promote accumulation of γH2AX
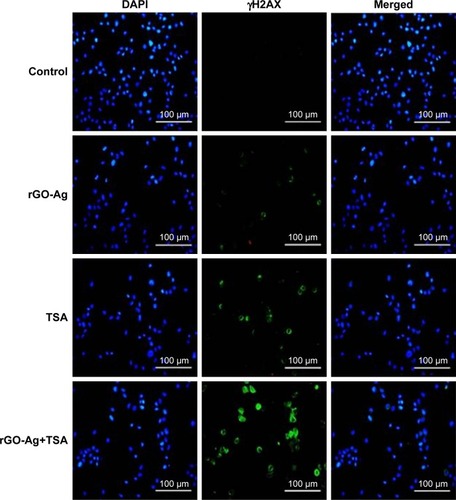
Mitochondrial pathway is critical for activation of the DNA damage response. Therefore, we verified whether rGO-Ag and TSA were able to promote the formation of DNA DSBs. One of the earliest events in the response to DNA breakage involves phosphorylation of H2AX (γH2AX) that surrounds ~2 Mb of each DSB, which serves as the site of breakage. γH2AX foci is a common biomarker of nuclear DNA damage, and thus, it was used to evaluate the DNA strand breaks caused by repair incision nucleases.Citation99,Citation100 We performed immunofluorescence-based assay to evaluate whether the combination of rGO-Ag and TSA could induce DSBs. To examine this effect, SKOV3 cells were treated with rGO-Ag (0.20 µM) alone, TSA (0.20 µM) alone, or combination of both rGO-Ag (0.20 µM) and TSA (0.20 µM) for 24 h. All the treated cells showed an increase in the percentage of γH2AX-positive cells, a marker of DSBs formation, and significant changes in γH2AX staining for both rGO-Ag (0.20 µM) and TSA were observed in SKOV3 cells (). As we expected, the combination treatment induced a significant increase in γH2AX-positive nuclei in SKOV3 cells. DNA DSBs are associated with the spreading of γH2AX to larger domains on either side of a DSB, and the results from our findings also suggested an increased accumulation of γH2AX in SKOV3 cells due to the action of rGO-Ag and TSA.Citation101 Interestingly, this is the first observation about the impact of rGO-Ag on DNA DSBs. Lee et al found that the HDACIs such as vorinostat (SAHA) could induce DNA DSBs in normal (HFS) and cancer (LNCaP, A549) cells.Citation101 In a study by Namdar et al, the combination of HDAC6 with tubacin or shRNA activated the accumulation of γH2AX, and the expression of growth arrest and DNA damage proteins (GADD153/DDIT3).Citation108 HDACIs such as TSA, BITC, and LAQ-824 also triggered ROS production, with increased γH2AX and Ku70 acetylation inducing apoptosis in a variety of cancer cells.Citation82,Citation102 Our studies are in line with previous studies reporting that the combination of TSA or other HDACIs with DNA-damaging agents synergistically induces cell death. Our studies are consistent with earlier reports, suggesting that carbon nanomaterials, including multiwalled CNTs and nanodiamonds, could induce the expression of chromosomal DNA-damage biomarkers, p53, MOGG-1, and Rad51, and DNA fragmentation in mouse embryonic stem cells and embryonic stem cells, respectively.Citation103,Citation104 In line with previous studies, Akhavan et alCitation105 reported in human mesenchymal stem cells that rGO-NPs induced DNA fragmentations and chromosomal aberrations by penetration into the cells, which resulted in interactions between the penetrated nanosheets and the cell nuclei.Citation105 Altogether, our studies confirmed that the combination of HDACIs with rGO-Ag enhances DNA damage and eventually leads to cell death. The biologically synthesized nanomaterials combined with low concentration of HDACIs potentially could induce apoptosis compared to chemotherapeutic agents at high concentration.
Figure 16 Estimation of nuclear DNA damage in SKOV3 cells after exposure to rGO-Ag or TSA alone or combination of rGO-Ag and TSA for 24 h using γH2AX antibody.
Notes: Nuclear γH2AX foci was estimated in SKOV3 cells exposed to rGO-Ag (0.2 µM) alone, TSA (0.2 µM) alone, or combination of both rGO-Ag (0.2 µM) and TSA (0.2 µM) for 24 h. Scale bars =100 µm.
Abbreviations: rGO-Ag, reduced graphene oxide-silver; TSA, trichostatin A.
Conclusion
Herein, we demonstrated the synthesis of rGO-AgNP nanocomposites using lycopene, a novel unexplored biomolecule. When the synthesized nanocomposites were observed, we found well-decorated AgNPs on the surface of rGO with an average size between 10 and 50 nm. Further, the cytotoxicity and apoptosis-inducing potential of the as-prepared rGO-Ag were evaluated in SKOV3 cells either alone or combination with TSA. The results showed that either rGO-Ag alone or TSA alone or combination of both rGO-Ag and TSA caused significant cytotoxicity and induced apoptosis, and evidence was gathered from a battery of assays including cell viability, cytotoxicity, mitochondrial membrane permeability, DNA fragmentation, and DNA DSBs. Interestingly, the combination of low doses of rGO-Ag and TSA caused excellent cytotoxicity and induced greater apoptosis in SKOV3 cells than single agents at high concentration. The results concluded that combination of two different agents acting by two different mechanisms has greater efficacy than single agent and significantly suppresses cell viability and increases apoptosis. The enhancement of apoptotic activity by the combination of rGO-Ag and TSA could be due to strong synergistic interaction between rGO-Ag and TSA, as well as synergistic action of rGO and AgNPs in rGO-Ag nanocomposites in a single platform. rGO-Ag potentiated the anticancer efficacy of low-dose TSA in human ovarian cancer cells through regulation of various mechanisms and could serve as a promising therapeutic agent for ovarian cancer. Finally, combination of chemotherapeutic agents such as HDACIs including TSA with low doses of nanoparticles like rGO-Ag is one of the most promising strategies to increase the efficacy of standard chemotherapy drugs, and this novel combination therapy would preferably reduce the undesired and toxic side effects. However, further studies are required to completely understand the molecular mechanisms by which combination therapy may treat tumors in each and every stage of cancer for the development of advance treatment strategies.
Acknowledgments
This study was supported by the KU-Research Professor Program of Konkuk University and Science and Technology Major Special Fund Project of Shandong Province in China (2015ZDZX07001).
Disclosure
GL Zhang is employed by Dong-E-E-Jiao Co., Ltd., DongE. The authors report no other conflicts of interest in this work.
References
- SiegelRLFedewaSAAndersonWFColorectal cancer incidence patterns in the United States, 1974–2013J Natl Cancer Inst20171098
- FerlayJParkinDMSteliarova-FoucherEEstimates of cancer incidence and mortality in Europe in 2008Eur J Cancer201046476578120116997
- SankaranarayananRFerlayJWorldwide burden of gynaecological cancer: the size of the problemBest Pract Res Clin Obstet Gynaecol200620220722516359925
- ZhangXFGurunathanSCombination of salinomycin and silver nanoparticles enhances apoptosis and autophagy in human ovarian cancer cells: an effective anticancer therapyInt J Nanomedicine2016113655367527536105
- RaziSGhonchehMMohammadian-HafshejaniAAziznejhadHMohammadianMSalehiniyaHThe incidence and mortality of ovarian cancer and their relationship with the Human Development Index in AsiaEcancermedicalscience20161062827110284
- AhlgrenJDChemotherapy for pancreatic carcinomaCancer19967836546638681304
- SmithLHMorrisCRYasmeenSParikh-PatelACressRDRomanoPSOvarian cancer: can we make the clinical diagnosis earlier?Cancer200510471398140716116591
- RimanTDickmanPWNilssonSNordlinderHMagnussonCMPerssonIRSome life-style factors and the risk of invasive epithelial ovarian cancer in Swedish womenEur J Epidemiol200419111011101915648594
- Collaborative Group on Epidemiological Studies of Ovarian CancerBeralVDollRHermonCPetoRReevesGOvarian cancer and oral contraceptives: collaborative reanalysis of data from 45 epidemiological studies including 23,257 women with ovarian cancer and 87,303 controlsLancet2008371960930331418294997
- TsilidisKKAllenNEKeyTJMenopausal hormone therapy and risk of ovarian cancer in the European prospective investigation into cancer and nutritionCancer Causes Control20112281075108421637986
- PoorolajalJJenabiEMasoumiSZBody mass index effects on risk of ovarian cancer: a meta-analysisAsian Pac J Cancer Prev201415187665767125292044
- RaziAAfghahFVaradanVIdentifying gene subnetworks associated with clinical outcome in ovarian cancer using Network Based Coalition GameConf Proc IEEE Eng Med Biol Soc201520156509651326737784
- WuYLLiWHWuCFLuLWangJWClinical observation on the combination therapy in treating Candida vaginitis caused by CandidaChin J Nosocomiol2015251740364038 Chinese [with English abstract]
- DiyabalanageHVGrandaMLHookerJMCombination therapy: histone deacetylase inhibitors and platinum-based chemotherapeutics for cancerCancer Lett201332911823032720
- KimESLeeJKHistone deacetylase inhibitors decrease the antigen presenting activity of murine bone marrow derived dendritic cellsCell Immunol20102621525720096829
- SharmaVKoulNJosephCDixitDGhoshSSenEHDAC inhibitor, scriptaid, induces glioma cell apoptosis through JNK activation and inhibits telomerase activityJ Cell Mol Med20101482151216119583803
- MishraSKMandalMMazumdarAKumarRDynamic chromatin remodeling on the HER2 promoter in human breast cancer cellsFEBS Lett20015071889411682064
- RanganathanPRangnekarVMExploiting the TSA connections to overcome apoptosis-resistanceCancer Biol Ther20054439139215908800
- VigushinDMAliSPacePETrichostatin A is a histone deacetylase inhibitor with potent antitumor activity against breast cancer in vivoClin Cancer Res20017497197611309348
- PlattaCSGreenblattDYKunnimalaiyaanMChenHThe HDAC inhibitor trichostatin A inhibits growth of small cell lung cancer cellsJ Surg Res2007142221922617612559
- WuZQZhangRChaoCZhangJFZhangYQHistone deacetylase inhibitor trichostatin A induced caspase-independent apoptosis in human gastric cancer cellChin Med J (Engl)2007120232112211818167185
- SonnemannJHülsISiglerMHistone deacetylase inhibitors and aspirin interact synergistically to induce cell death in ovarian cancer cellsOncol Rep200820121922418575740
- YouBRParkWHTrichostatin A induces apoptotic cell death of HeLa cells in a Bcl-2 and oxidative stress-dependent mannerInt J Oncol201342135936623165748
- HuangfuDMaehrRGuoWInduction of pluripotent stem cells by defined factors is greatly improved by small-molecule compoundsNat Biotechnol200826779579718568017
- ZhangXFYanQShenWGurunathanSTrichostatin A enhances the apoptotic potential of palladium nanoparticles in human cervical cancer cellsInt J Mol Sci20161781354
- GurunathanSKimJHSynthesis, toxicity, biocompatibility, and biomedical applications of graphene and graphene-related materialsInt J Nanomedicine2016111927194527226713
- ShenJFShiMLiNFacile synthesis and application of Ag-chemically converted graphene nanocompositeNano Res201035339349
- DasMRSarmaRKSaikiaRKaleVSShelkeMVSenguptaPSynthesis of silver nanoparticles in an aqueous suspension of graphene oxide sheets and its antimicrobial activityColloids Surf B Biointerfaces2011831162221109409
- MaHZengJHarringtonSHydrothermal fabrication of silver nanowires-silver nanoparticles-graphene nanosheets composites in enhancing electrical conductive performance of electrically conductive adhesivesNanomaterials (Basel)201666119
- XuSLiuYWangTLiJPositive potential operation of a cathodic electrogenerated chemiluminescence immunosensor based on luminol and graphene for cancer biomarker detectionAnal Chem201183103817382321513282
- de FariaAFMartinezDSMeiraSMAnti-adhesion and anti-bacterial activity of silver nanoparticles supported on graphene oxide sheetsColloids Surf B Biointerfaces201411311512424060936
- ZhouYYangJHeTShiHChengXLuYHighly stable and dispersive silver nanoparticle-graphene composites by a simple and low-energy-consuming approach and their antimicrobial activitySmall20139203445345423637081
- TangJChenQXuLGraphene oxide-silver nanocomposite as a highly effective antibacterial agent with species-specific mechanismsACS Appl Mater Interfaces2013593867387423586616
- GurunathanSHanJWParkJHReduced graphene oxide-silver nanoparticle nanocomposite: a potential anticancer nanotherapyInt J Nanomedicine2015106257627626491296
- GurunathanSParkJHChoiYJHanJWKimJHSynthesis of graphene oxide-silver nanoparticle nanocomposites: an efficient novel antibacterial agentCurrent Nanoscience2016126762773
- ZhangXFLiuZGShenWGurunathanSSilver nanoparticles: synthesis, characterization, properties, applications, and therapeutic approachesInt J Mol Sci2016179 pii: E1534
- Marambio-JonesCHoekEMVAReview of the antibacterial effects of silver nanomaterials and potential implications for human health and environmentJ Nanopart Res201012515311551
- YunJWangWBaeTSPreparation of flexible organic solar cells with highly conductive and transparent metal-oxide multilayer electrodes based on silver oxideACS Appl Mater Interfaces20135209933994124060352
- LokCNHoCMChenRSilver nanoparticles: partial oxidation and antibacterial activitiesJ Biol Inorg Chem200712452753417353996
- ZhangXFGurunathanSBiofabrication of a novel biomolecule-assisted reduced graphene oxide: an excellent biocompatible nanomaterialInt J Nanomedicine2016116635664927994461
- WangJSalihiECŠillerLGreen reduction of graphene oxide using alanineMater Sci Eng C Mater Biol Appl2017721628024564
- GurunathanSKalishwaralalKVaidyanathanRBiosynthesis, purification and characterization of silver nanoparticles using Escherichia coliColloids Surf B Biointerfaces200974132833519716685
- SastryMPatilAVMayyaKSIncorporation of colloidal metal particles in thermally evaporated fatty amine films via selective electrostatic interactionsLangmuir1997131644904492
- SastryMGangulyPDetermination of C 1s core level chemical shifts in some Langmuir−Blodgett films using a modified Sanderson formalismJ Phys Chem A19981024697702
- YangSBChoiHLeeDSChoiCGChoiSYKimIDImproved optical sintering efficiency at the contacts of silver nanowires encapsulated by a graphene layerSmall201511111293130025521110
- RoyIRanaDSarkarGPhysical and electrochemical characterization of reduced graphene oxide/silver nanocomposites synthesized by adopting green approachRSC Adv20155322535725364
- GurunathanSHanJWDayemAAEppakayalaVKimJHOxidative stress-mediated antibacterial activity of graphene oxide and reduced graphene oxide in Pseudomonas aeruginosaInt J Nanomedicine201275901591423226696
- GurunathanSHanJWKimJHGreen chemistry approach for the synthesis of biocompatible grapheneInt J Nanomedicine201382719273223940417
- LiDZhangWYuXWangZSuZWeiGWhen biomolecules meet graphene: from molecular level interactions to material design and applicationsNanoscale2016847194911950927878179
- ChangJVargheseDSGillamMCDifferential response of cancer cells to HDAC inhibitors trichostatin A and depsipeptideBr J Cancer2012106111612522158273
- MengFSunGZhongMYuYBrewerMAAnticancer efficacy of cisplatin and trichostatin A or 5-aza-2′-deoxycytidine on ovarian cancerBr J Cancer2013108357958623370212
- ZhangYZhangBTrichostatin A, an inhibitor of histone deacetylase, inhibits the viability and invasiveness of hypoxic rheumatoid arthritis fibroblast-like synoviocytes via PI3K/Akt signalingJ Biochem Mol Toxicol201630416316926509796
- MurahariSJalkanenALKulpSKSensitivity of osteosarcoma cells to HDAC inhibitor AR-42 mediated apoptosisBMC Cancer20171716728109246
- GarrettLAGrowdonWBRuedaBRFosterRInfluence of a novel histone deacetylase inhibitor panobinostat (LBH589) on the growth of ovarian cancerJ Ovarian Res2016915827633667
- ZhangXJiangSJShangBJiangHJEffects of histone deacetylase inhibitor trichostatin A combined with cisplatin on apoptosis of A549 cell lineThorac Cancer20156220220826273359
- JinXFangYHuYSynergistic activity of the histone deacetylase inhibitor trichostatin A and the proteasome inhibitor PS-341 against taxane-resistant ovarian cancer cell linesOncol Lett20171364619462628588720
- PelicanoHCarneyDHuangPROS stress in cancer cells and therapeutic implicationsDrug Resist Updat2004729711015158766
- AdachiMZhangYZhaoXSynergistic effect of histone deacetylase inhibitors FK228 and m-carboxycinnamic acid bis-hydroxamide with proteasome inhibitors PSI and PS-341 against gastrointestinal adenocarcinoma cellsClin Cancer Res200410113853386215173094
- LecanePSKaramanMWSirisawadMMotexafin gadolinium and zinc induce oxidative stress responses and apoptosis in B-cell lymphoma linesCancer Res20056524116761168816357179
- Pérez-GalánPRouéGVillamorNMontserratECampoEColomerDThe proteasome inhibitor bortezomib induces apoptosis in mantle-cell lymphoma through generation of ROS and Noxa activation independent of p53 statusBlood2006107125726416166592
- GurunathanSHanJWEppakayalaVKimJHGreen synthesis of graphene and its cytotoxic effects in human breast cancer cellsInt J Nanomedicine201381015102723687445
- HanZYanQGeWCytotoxic effects of ZnO nanoparticles on mouse testicular cellsInt J Nanomedicine2016115187520327785022
- SunSHanYLiuJTrichostatin A targets the mitochondrial respiratory chain, increasing mitochondrial reactive oxygen species production to trigger apoptosis in human breast cancer cellsPLoS One201493e9161024626188
- LaurentANiccoCChéreauCControlling tumor growth by modulating endogenous production of reactive oxygen speciesCancer Res200565394895615705895
- DonadelliMCostanzoCBeghelliSSynergistic inhibition of pancreatic adenocarcinoma cell growth by trichostatin A and gemcitabineBiochim Biophys Acta2007177371095110617555830
- SriramMIKalishwaralalKBarathmanikanthSGurunathaniSSize-based cytotoxicity of silver nanoparticles in bovine retinal endothelial cellsNanosci Methods2012115677
- El-SonbatySMFungus-mediated synthesis of silver nanoparticles and evaluation of antitumor activityCancer Nanotechnol201344–5737926069502
- MartindaleJLHolbrookNJCellular response to oxidative stress: signaling for suicide and survivalJ Cell Physiol2002192111512115731
- FoldbjergROlesenPHougaardMDangDAHoffmannHJAutrupHPVP-coated silver nanoparticles and silver ions induce reactive oxygen species, apoptosis and necrosis in THP-1 monocytesToxicol Lett2009190215616219607894
- FoldbjergRDangDAAutrupHCytotoxicity and genotoxicity of silver nanoparticles in the human lung cancer cell line, A549Arch Toxicol201185774375020428844
- ChangHWuXWuCChenYJiangHWangXCatalytic oxidation and determination of β-NADH using self-assembly hybrid of gold nanoparticles and grapheneAnalyst2011136132735274021594262
- GurunathanSHanJParkJHKimJHAn in vitro evaluation of graphene oxide reduced by Ganoderma spp. in human breast cancer cells (MDA-MB-231)Int J Nanomedicine201491783179724741313
- DeckerTLohmann-MatthesMLA quick and simple method for the quantitation of lactate dehydrogenase release in measurements of cellular cytotoxicity and tumor necrosis factor (TNF) activityJ Immunol Methods1988115161693192948
- NikiTRomboutsKDe BleserPA histone deacetylase inhibitor, trichostatin A, suppresses myofibroblastic differentiation of rat hepatic stellate cells in primary cultureHepatology199929385886710051490
- NilesAWorzellaTScurriaMMultiplexed viability, cytotoxicity and apoptosis assays for cell-based screeningCell Notes2006161215
- JoHJKimYParkHWThe unreliability of MTT assay in the cytotoxic test of primary cultured glioblastoma cellsExp Neurobiol201524323524526412973
- ZhangYAliSFDervishiECytotoxicity effects of graphene and single-wall carbon nanotubes in neural phaeochromocytoma-derived PC12 cellsACS Nano2010463181318620481456
- GrantSDaiYHistone deacetylase inhibitors and rational combination therapiesAdv Cancer Res201211619923723088872
- WaiwijitUKandhavivornWOonkhanondBCytotoxicity assessment of MDA-MB-231 breast cancer cells on screen-printed graphene-carbon paste substrateColloids Surf B Biointerfaces201411319019724090714
- HanMHParkCKwonTKThe histone deacetylase inhibitor trichostatin A sensitizes human renal carcinoma cells to TRAIL-induced apoptosis through down-regulation of c-FLIPLBiomol Ther (Seoul)2015231313825593641
- KimataMMatobaSIwai-KanaiEp53 and TIGAR regulate cardiac myocyte energy homeostasis under hypoxic stressAm J Physiol Heart Circ Physiol20102996H1908H191620935145
- RosatoRRAlmenaraJAMaggioSCRole of histone deacetylase inhibitor-induced reactive oxygen species and DNA damage in LAQ-824/fludarabine antileukemic interactionsMol Cancer Ther20087103285329718852132
- RosatoRRKollaSSHockSKHistone deacetylase inhibitors activate NF-kappaB in human leukemia cells through an ATM/NEMO-related pathwayJ Biol Chem201028513100641007720065354
- ChenPSWangCCBortnerCDValproic acid and other histone deacetylase inhibitors induce microglial apoptosis and attenuate lipopolysaccharide-induced dopaminergic neurotoxicityNeuroscience2007149120321217850978
- LiYLiuYFuYThe triggering of apoptosis in macrophages by pristine graphene through the MAPK and TGF-beta signaling pathwaysBiomaterials201233240241122019121
- MytychJZebrowskiJLewinskaAWnukMProlonged effects of silver nanoparticles on p53/p21 pathway-mediated proliferation, DNA damage response, and methylation parameters in HT22 hippocampal neuronal cellsMol Neurobiol20175421285130026843106
- GurunathanSParkJHHanJWKimJHComparative assessment of the apoptotic potential of silver nanoparticles synthesized by Bacillus tequilensis and Calocybe indica in MDA-MB-231 human breast cancer cells: targeting p53 for anticancer therapyInt J Nanomedicine2015104203422226170659
- ChanSTYangNCHuangCSLiaoJWYehSLQuercetin enhances the antitumor activity of trichostatin A through upregulation of p53 protein expression in vitro and in vivoPLoS One201381e5425523342112
- FischerMCensus and evaluation of p53 target genesOncogene201736283943395628288132
- FuldaSModulation of TRAIL-induced apoptosis by HDAC inhibitorsCurr Cancer Drug Targets20088213214018336196
- DaiYRahmaniMPeiXYFarnesyltransferase inhibitors interact synergistically with the Chk1 inhibitor UCN-01 to induce apoptosis in human leukemia cells through interruption of both Akt and MEK/ERK pathways and activation of SEK1/JNKBlood200510541706171615494423
- WangYZongLWangXTGF-β improves myocardial function and prevents apoptosis induced by anoxia-reoxygenation, through the reduction of endoplasmic reticulum stressCan J Physiol Pharmacol201694191726488543
- CornagoMGarcia-AlberichCBlasco-AnguloNHistone deacetylase inhibitors promote glioma cell death by G2 checkpoint abrogation leading to mitotic catastropheCell Death Dis20145e143525275596
- HagueAManningAMHanlonKAHuschtschaLIHartDParaskevaCSodium butyrate induces apoptosis in human colonic tumour cell lines in a p53-independent pathway: implications for the possible role of dietary fibre in the prevention of large-bowel cancerInt J Cancer19935534985058397167
- KoyamaFSawadaHFujiHAdenoviral-mediated transfer of Escherichia coli uracil phosphoribosyltransferase (UPRT) gene to modulate the sensitivity of the human colon cancer cells to 5-fluorouracilEur J Cancer200036182403241011094317
- MehtaAHaberJESources of DNA double-strand breaks and models of recombinational DNA repairCold Spring Harb Perspect Biol201469a01642825104768
- MaackeHOpitzSJostKOver-expression of wild-type Rad51 correlates with histological grading of invasive ductal breast cancerInt J Cancer200088690791311093813
- AlagpulinsaDAAyyadevaraSShmookler ReisRJA small-molecule inhibitor of RAD51 reduces homologous recombination and sensitizes multiple myeloma cells to doxorubicinFront Oncol2014428925401086
- RogakouEPPilchDROrrAHIvanovaVSBonnerWMDNA double-stranded breaks induce histone H2AX phosphorylation on serine 139J Biol Chem199827310585858689488723
- RogakouEPSekeri-PataryasKEHistone variants of H2A and H3 families are regulated during in vitro aging in the same manner as during differentiationExp Gerontol199934674175410579635
- LeeJHChoyMLNgoLFosterSSMarksPAHistone deacetylase inhibitor induces DNA damage, which normal but not transformed cells can repairProc Natl Acad Sci U S A201010733146391464420679231
- TaddeiARocheDBickmoreWAAlmouzniGThe effects of histone deacetylase inhibitors on heterochromatin: implications for anticancer therapy?EMBO Rep20056652052415940285
- ZhuLChangDWDaiLHongYDNA damage induced by multiwalled carbon nanotubes in mouse embryonic stem cellsNano Lett20077123592359718044946
- XingYXiongWZhuLOsawaEHussinSDaiLDNA damage in embryonic stem cells caused by nanodiamondsACS Nano2011532376238421370893
- AkhavanOGhaderiEAkhavanASize-dependent genotoxicity of graphene nanoplatelets in human stem cellsBiomaterials201233328017802522863381
- JeongSGChoGWTrichostatin A modulates intracellular reactive oxygen species through SOD2 and FOXO1 in human bone marrow-mesenchymal stem cellsCell Biochem Funct2015331374325515622
- de LunaLAde MoraesACConsonniSRComparative in vitro toxicity of a graphene oxide-silver nanocomposite and the pristine counterparts toward macrophagesJ Nanobiotechnology2016141226912341
- NamdarMPerezGNgoLMarksPASelective inhibition of histone deacetylase 6 (HDAC6) induces DNA damage and sensitizes transformed cells to anticancer agentsProc Natl Acad Sci U S A201010746200032000821037108