
Abstract
Purpose
Breast cancer stem cells (CSCs) are responsible for the initiation, recurrence, and metastasis of breast cancer. Sufficient evidence has established that breast cancer cells can spontaneously turn into breast CSCs. Thus, it is essential to simultaneously target breast CSCs and cancer cells to maximize the efficacy of breast cancer therapy. HER2 has been found to be overexpressed in both breast CSCs and cancer cells. We developed salinomycin-loaded polymer–lipid hybrid anti-HER2 nanoparticles (Sali-NP-HER2) to target both HER2-positive breast CSCs and cancer cells.
Methods
The antitumor activity of Sali-NP-HER2 constructed by conjugating anti-HER2 antibodies to polymer–lipid salinomycin nanoparticles was evaluated in vitro and in vivo.
Results
Sali-NP-HER2 efficiently bound to HER2-positive breast CSCs and cancer cells, resulting in enhanced cytotoxic effects compared with non-targeted nanoparticles or salinomycin. In mice bearing breast cancer xenografts, administration of Sali-NP-HER2 exhibited superior efficacy in inhibiting tumor growth. Sali-NP-HER2 reduced the breast tumorsphere formation rate and the proportion of breast CSCs more effectively than non-targeted nanoparticles or salinomycin alone.
Conclusion
Sali-NP-HER2 represents a promising approach in treating HER2-positive breast cancer by targeting both breast CSCs and cancer cells.
Introduction
Breast cancer is a leading cause of death among women globally and the second most common cancer in both sexes.Citation1,Citation2 Overall survival is significantly hampered by cancer drug resistance, recurrence, and metastasis,Citation3,Citation4 and breast cancer stem cells (CSCs) are considered responsible for these factors.Citation5,Citation6 Thus, eliminating breast CSCs may increase the therapeutic efficacy of breast cancer.
Salinomycin, which reduces the proportion of breast CSCs, has been reported to be a potent drug against breast CSCs.Citation7–Citation9 The anti-CSC mechanisms of salinomycin include blockade of the Wnt/β-catenin pathway.Citation9,Citation10 Sufficient evidence has suggested that breast cancer cells could spontaneously and stochastically turn into CSCs de novo.Citation11,Citation12 Hence, the simultaneous elimination of both CSCs and cancer cells could maximize therapeutic efficacy against cancer.Citation13–Citation15 Although salinomycin has shown potent activity toward CSCs, its cytotoxic effects on cancer cells are not substantial.Citation13–Citation15 Improving the cytotoxic effect of salinomycin on breast cancer cells would be a significant breakthrough.
Targeted nanoparticles have become powerful drug delivery systems, since they can improve the potency of chemotherapy drugs against cancer cells overexpressing antigens such as HER2.Citation16–Citation20 HER2 overexpression occurs in 25%–30% of human breast cancers and leads to a particularly aggressive form of the disease.Citation21 Thus, HER2 is a validated target in breast cancer. Several studies have indicated that, in HER2-overexpressing cancer cell lines, breast CSCs presented increased HER2 levels compared with breast cancer cells, and HER2 contributed to the tumorigenesis and invasion of breast CSCs.Citation8,Citation22 Trastuzumab, the anti-HER2 antibody, was shown to effectively target breast CSCs in HER2-positive cancer cells.Citation8 Thus, since HER2 is overexpressed in both breast CSCs and cancer cells, we hypothesize that HER2 could be a potential target to mediate effective delivery of salinomycin to breast CSCs and cancer cells.
A large number of nanoparticles have been approved for clinical use or have entered clinical trials.Citation16 Nanoparticles of biodegradable polymers and liposomes are the two dominant categories. Nanoparticles of biodegradable polymers are characterized by their controlled drug release, superior stability, and drug-loading capacity, while their biocompatibility is not as good as that of liposomes. However, the clinical use of liposomes is limited by uncontrollable drug release, instability, and insufficient drug loading.Citation23 Novel polymer–lipid hybrid nanoparticles that combine the advantages and overcome the disadvantages of the two types of drug nanocarriers would offer a solution. Several research groups have developed polymer–lipid hybrid nanoparticles that possess controlled drug-release properties, high bio-compatibility, and a favorable pharmacokinetic profile, representing a robust drug-delivery platform.Citation19,Citation24
We developed salinomycin-loaded polymer–lipid hybrid nanoparticles conjugated with anti-HER2 antibodies to promote the efficient delivery of salinomycin to breast CSCs and cancer cells. We isolated breast CSCs using aldehyde dehydrogenase (ALDH) as a breast CSC marker.Citation25,Citation26 The targeting efficacy and antitumor activity of the salinomycin-loaded polymer–lipid anti-HER2 nanoparticles (Sali-NP-HER2) against both breast CSCs and cancer cells were investigated.
Materials and methods
Reagents and cell lines
Salinomycin sodium, poly(d,l-lactide-co-glycolide) (PLGA, 50:50, Mw 40,000–75,000 Da), bFGF, and EGF were purchased from Sigma-Aldrich (St Louis, MO, USA). Soybean lecithin was provided by Wako Pure Chemical Industries, Ltd. (Osaka, Japan). The 1,2-distearoyl-sn-glycero-3-phosphoethanolamine-N-(methoxy(polyethylene glycol)-2000) (DSPE-PEG2000), 1,2-distearoyl-sn-glycero-3-phosphoethanolamine-N-(maleimide(polyethylene glycol)-2000) (DSPE-PEG2000-Mal), and 1,2-dioleoyl-sn-glycero-3-phosphoethanolamine-N-carboxyfluorescein (ammonium salt) (CFPE) were purchased from Avanti Polar Lipids (Alabaster, AL, USA). Recombinant humanized anti-HER2 monoclonal antibody (rhuMAb HER2) was kindly provided by the National Engineering Research Center for Antibody Medicine (Shanghai, China), and Fab′ of rhuMAb HER2 (anti-HER2 Fab′) was prepared as described previously.Citation27 The secondary antibody, FITC-labeled goat anti-human IgG (H+L), was provided by Zymed (South San Francisco, CA, USA). Traut’s reagent (2-iminothiolane) was purchased from Pierce (Rockford, IL, USA). Roswell Park Memorial Institute (RPMI) 1640 medium, fetal bovine serum (FBS), B27, and insulin–transferrin–selenium (ITS) were provided by Thermo Fisher Scientific (Waltham, MA, USA). Cell Counting Kit-8 (CCK-8) was obtained from Dojindo (Kumamoto, Japan). All organic reagents of analytical grade were purchased from Sinopharm (Shanghai, China).
Human breast cancer cell lines BT-474 and MDA-MB-361 were purchased from the American Type Culture Collection (ATCC, Manassas, VA, USA). BT-474 cells were grown in RPMI 1640 medium containing 10% FBS, 2 mM l-glutamine, 10 mM N-2-hydroxyethylpiperazine-N′-2-ethanesulfonic acid (HEPES), 1 mM sodium pyrophosphate, 4.5 g/mL glucose, 1.5 g/mL sodium carbonate, and 10 μg/mL insulin in a humidified atmosphere of 5% CO2 at 37°C. MDA-MB-361 cells were grown in Leibovitz’s L-15 medium supplemented with 20% FBS in a humidified atmosphere of 5% CO2 at 37°C.
HER2 expression of breast cancer cells
Breast cancer cells were incubated with rhuMAb HER2 (1 μg/mL) for 30 min at 4°C, and then rinsed and incubated with FITC-labeled goat anti-human IgG for 30 min at 4°C. Cellular HER2 expression, as reflected by the percentage of HER2 positively stained cells and HER2 mean fluorescence intensity (MFI), was analyzed with a FACScan flow cytometer (BD, Franklin Lakes, NJ, USA).
Identification and isolation of ALDH−positive (ALDH+) cells
ALDH+ cells with high ALDH enzymatic activity were identified and sorted using the ALDEFLUOR kit (StemCell Technologies, Vancouver, BC, Canada) and FACSAria (BD). Briefly, cells were suspended in ALDH assay buffer containing ALDH substrate-BODIPY-aminoacetaldehyde (BAAA) and incubated at 37°C for 40 min. To distinguish between ALDH+ and ALDH−negative (ALDH−) cells, a fraction of the cells was incubated under identical conditions in the presence of 50 mM of the ALDH inhibitor diethylaminobenzaldehyde.
Development of polymer–lipid hybrid nanoparticles
The polymer–lipid hybrid nanoparticles were developed by a one-step process of nanoprecipitation.Citation19,Citation24 Briefly, 2 mg of salinomycin was dissolved with PLGA acetonitrile solution (1 mg/mL). After 0.5 mg soybean lecithin and 0.15 mg DSPE-PEG2000 were dissolved in a 4% ethanol aqueous solution heated to 65°C (1% CFPE [molar ratio] was added for fluorescent nanoparticles), the PLGA acetonitrile solution was added into the preheated lipid aqueous solution dropwise (1 mL/min), followed by vortexing for 3 min. The solution was stirred gently for 3 h at 25°C. Next, free molecules and the remaining organic solvent were removed by dialysis against phosphate-buffered saline (PBS, pH 7.4) using a dialysis tube (Spectra/Por 6 membrane, MWCO 1,000; Spectrum Labs, Cincinnati, OH, USA). The nanoparticles were mixed with 3% w/w sucrose as a cryoprotectant and freeze-dried to obtain a fine powder.
The polymer–lipid hybrid anti-HER2 nanoparticles were prepared as described earlier, except that DSPE-PEG2000 was replaced by DSPE-PEG2000-Mal. Anti-HER2 Fab′ was first thiolated by 2-iminothiolane as described previously,Citation28 and 0.5 mg thiolated anti-HER2 Fab′ was mixed with 2 mL of the nanoparticles prepared earlier. The mixture was then incubated at 16°C overnight to form polymer–lipid hybrid anti-HER2 nanoparticles. Using Amicon® Ultra-4 centrifugal filter devices (Merck Millipore, Billerica, MA, USA), the unconjugated anti-HER2 Fab′ was removed, collected, and quantitated using a BCA protein assay kit obtained from Biyuntian Biotechnology Research Institute (Haimen, China). The antibody conjugation efficiency was calculated as the percentage of conjugated antibody to the total amount of antibody added: conjugated antibody = total amount of added antibody - amount of unconjugated antibody in the flow-through liquid.
The following nanoparticles were designated: Sali-NP-HER2, salinomycin-loaded polymer–lipid nanoparticles (Sali-NP), polymer–lipid anti-HER2 nanoparticles (NP-HER2), CFPE-labeled salinomycin-loaded polymer–lipid anti-HER2 nanoparticles (CFPE-Sali-NP-HER2), and CFPE-labeled salinomycin-loaded polymer–lipid nanoparticles (CFPE-Sali-NP).
Physicochemistry of nanoparticles
The size and zeta potential of nanoparticles were measured with a dynamic light-scattering detector (Zetasizer, Nano-ZS; Malvern Instruments, Malvern, UK). Nanoparticle morphology was assessed by transmission electron microscopy (TEM) (H-600; Hitachi, Tokyo, Japan).
Drug encapsulation and loading efficacy of nanoparticles
The drug encapsulation and loading efficacy of salinomycin in nanoparticles were measured by high-performance liquid chromatography (HPLC, L-2000; Hitachi), after the lyophilized nanoparticles were dissolved in dichloromethane.Citation14 A reverse-phase C-18 column (Diamonsil, 250×4.6 mm, 5 μm; Dikma Technologies, Inc, Lake Forest, CA, USA) was used. The mobile phase was acetonitrile/deionized water/tetrahydrofuran/phosphoric acid (85/10/5/0.01, v/v), and the flow rate was 1.5 mL/min. The detection wavelength and column temperature were 210 nm and 30°C, respectively. Drug-loading efficiency was calculated as ME/MN ×100%, with ME being the mass of encapsulated drugs, and MN being the mass of nanoparticles. The drug encapsulation efficiency was calculated as ME/MT ×100%, with MT being the mass of total drugs. The CFPE concentration in nanoparticles was calculated according to CFPE calibration curves constructed by standard lead CFPE solutions.
In vitro drug release
Five milliliters of nanoparticle solution were added to a dialysis tube (Spectra/Por 6 membrane, MWCO 1,000; Spectrum Labs). The sealed tube was inserted into a flask containing 1 L PBS with or without 10% FBS in a 37°C water bath with stirring. One milliliter of the dialysate was taken out at different time points, and the salinomycin in the dialysate was determined as described earlier.
Targeting efficacy of nanoparticles to breast cancer cells
The targeting efficacy of nanoparticles to breast cancer cells was measured by flow cytometry and HPLC. For flow cytometry, breast cancer cells were seeded in 12-well plates with a density of 1×10⁶ cells per well and incubated for 4 h with free CFPE, CFPE-Sali-NP, or CFPE-Sali-NP-HER2 (CFPE concentration: 50 ng/mL). In the competitive assay, 50 mg/mL of anti-HER2 Fab′ was preincubated with the cells for 30 min, before treatment with CFPE-Sali-NP-HER2. Next, the cells were analyzed using a FACScan flow cytometer. For HPLC analysis, breast cancer cells were seeded in 12-well plates with a density of 1×10⁶ cells per well overnight. The cells were then incubated with free salinomycin, Sali-NP, or Sali-NP-HER2 at a concentration of 50 μg/mL salinomycin for 4 h. In the competitive assay, 50 mg/mL of anti-HER2 Fab′ was preincubated with the cells for 30 min, before treatment with Sali-NP-HER2. Next, the cells were rinsed 3 times with PBS, trypsinized, and harvested by adding 0.5 mL methanol. After sonication using a probe-type sonicator for 1 min, the cell lysate was centrifuged, and the salinomycin content in the supernatant was measured by HPLC as described earlier. The protein concentration in the cell lysate was measured using a BCA protein assay kit. Salinomycin was quantified as the mass of salinomycin associated with the cells divided by the mass of cellular protein.
Cell proliferation assays
Cells were seeded at a density of 1×10⁴ cells per well in 96-well plates for 12 h and treated with a series of concentrations of nanoparticles or salinomycin for 72 h. Absorbance was used to measure cell viability using a microplate reader (Multiskan MK3; Thermo Fisher Scientific).
Effect of treatments on CSC proportion in breast cancer cells
Breast cancer cells were seeded at a density of 2×10⁵ per well in 12-well plates for 12 h. The cells were incubated with nanoparticles or 5 μg/mL salinomycin for 48 h. Next, cells were rinsed to remove free drug, and further incubated for 3 days. The proportion of ALDH+ cells was analyzed by FACSAria using the method described earlier. Alternatively, the cells were removed from the culture plate and cultured at a density of 200 cells per well in ultra-low adherent 96-well plates (Corning Incorporated, NY, USA) to generate tumorspheres. The cell culture is stem cell-conditioned culture medium, which consists of DMEM-F12 with 20 ng/mL bFGF, 20 ng/mL EGF, 1× B27, and 1× ITS. After 7 days, the number of tumorspheres was counted under an inverted light microscope. The tumorspheres possess solid and round structures, and the cells appear fused together. The rate of tumorsphere formation was defined as the tumorsphere number formed in 7 days in the treatment group divided by the tumorsphere number formed in 7 days in the untreated group. The rate of tumorsphere formation in the untreated group was used as a control and defined as 100%.
Animal studies
Mice (female, 4–6 weeks, ~20 g) were purchased from the Experimental Animal Center of Shandong (Jinan, China). All procedures were approved by the Committee on Animals of Liaocheng University (Shandong, China), and all procedures were performed in accordance with the guidelines of the Committee on Animals of Liaocheng University (Shandong, China).
In vivo antitumor assay
The antitumor assay was performed on mice bearing breast cancer xenografts as described below. Briefly, 5×10⁶ BT-474 cells were injected subcutaneously into BALB/c nude mice (day 0). By day 10, the tumor growth was visible (~50 mm3). From day 10, mice were injected with nanoparticles (7.5 mg salinomycin/kg, intravenous) through the tail vein. Salinomycin (7.5 mg salinomycin/kg) dissolved in ethanol was administered by intraperitoneal injection. Therapy was given once every 2 days for a total of nine times. The tumor volume was calculated as (widthCitation2 × length)/2 and monitored. The effect of the drugs on the CSC proportion was evaluated on day 28. After the mice were euthanized, the tumors were excised, and the CSC proportion of the tumor cells was evaluated by analyzing the proportion of ALDH+ cells and tumorsphere formation assay as described earlier.
Statistical analysis
Data were analyzed using SPSS 13.0 (IBM SPSS, Armonk, NY, USA). Direct comparisons between two groups were conducted using Student’s non-paired t-test, and one-way analysis of variance (ANOVA) with the Newman–Keuls method was used to compare the mean values of three or more groups. P<0.05 was considered statistically significant.
Results
HER2 expression in breast cancer cells
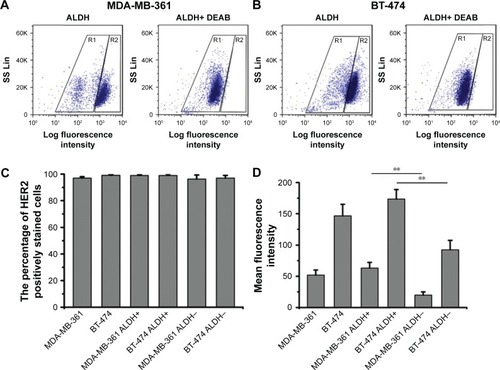
The ALDH+ cells with high ALDH enzymatic activity were identified and sorted by flow cytometry. As shown in , 79% of MDA-MB-361 cells were ALDH+, and 67% of BT-474 cells were ALDH+. As shown in , HER2 was found to be expressed in nearly 100% of the breast cancer cells, indicating that HER2 is highly expressed in breast cancer cells. To quantify HER2 expression intensity in breast cancer cells, the MFI of HER2 was used as an evaluation index (). The HER2 MFI in BT-474 cells increased 3-fold compared with that of MDA-MB-361 cells. Notably, we found a positive correlation between ALDH activity and HER2 cell surface expression. ALDH+ cells from MDA-MB-361 cells showed a 2.7-fold higher HER2 MFI than the ALDH− population (P<0.01) (). Similar results were obtained with ALDH+ BT-474 cells, which showed a 2-fold higher HER2 MFI compared with the ALDH− population.
Figure 1 Expression of HER2 in breast cancer cells, analyzed by flow cytometry.
Notes: Representative fluorescence-activated cell sorting analysis of (A) MDA-MB-361 and (B) BT-474 cells tested by ALDEFLUOR assay. In the right image (ALDH+ DEAB), cells incubated with ALDH substrate (BAAA) and the specific inhibitor of ALDH, DEAB, were used to establish the baseline fluorescence of these cells (R1) and to define the ALDEFLUOR-positive region (R2). (C) Percentage of HER2 positively stained cells in breast cancer cells. (D) HER2 mean fluorescence intensity in breast cancer cells. Data are expressed as mean ± SD (n=3). **P<0.01.
Abbreviations: ALDH, aldehyde dehydrogenase; BAAA, BODIPY-aminoacetaldehyde; DEAB, diethylaminobenzaldehyde.
Preparation and characteristics of nanoparticles
A one-step nanoprecipitation process was adopted to develop Sali-NP, and Sali-NP-HER2 was further prepared by conjugating anti-HER2 Fab′ with Sali-NP by a maleimide–thiol reaction, with an antibody conjugation efficiency of 24% (). As shown in , the size of the Sali-NP-HER2 nanoparticles was 135.6 nm, slightly larger than Sali-NP (123.2 nm). The polydispersity index of the nanoparticles was lower than 0.2, meaning that their size distribution was homogeneous. The encapsulation efficiency of both nanoparticles was ~55%, and their drug-loading efficiency was higher than 8%, indicating that the nanoprecipitation is effective for encapsulating salinomycin in nanoparticles. The TEM analysis indicated that both types of nanoparticles had a spherical shape, and the dim ring around the core demonstrated the well-defined core–shell structure of the nanoparticles ().
Table 1 Characterization of nanoparticles
Figure 2 Nanoparticle development, morphology, and drug release.
Notes: (A) Nanoparticle preparation. (B) TEM image of nanoparticles. Bars represent 200 nm. (C) Cumulative salinomycin release from the nanoparticles in PBS or PBS with 10% FBS. The two groups were compared by Student’s non-paired t-test at various time points. Data are expressed as mean ± SD (n=3). *P<0.05.
Abbreviations: FBS, fetal bovine serum; PBS, phosphate-buffered saline; PLGA, poly(d,l-lactide-co-glycolide); Sali-NP, salinomycin-loaded polymer–lipid nanoparticles; Sali-NP-HER2, salinomycin-loaded polymer–lipid hybrid anti-HER2 nanoparticles; TEM, transmission electron microscopy.
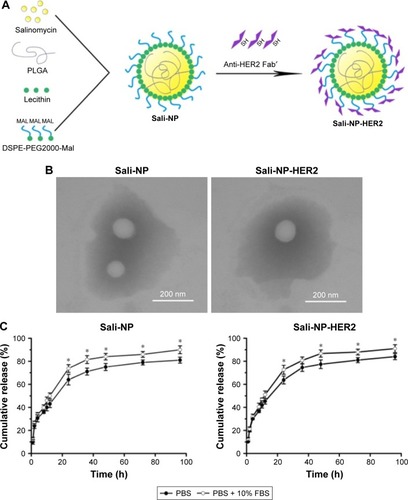
As shown in , both types of nanoparticles showed an initial burst of ~50% in the first 12 h. In the following 84 h, the cumulative release reached 80%. Both types exhibited slightly faster release in PBS with 10% FBS than in PBS alone after 24 h (P<0.05). Altogether, both types of nanoparticles exhibited sustained drug release during a period of 96 h.
Targeting efficacy of nanoparticles in breast cancer cells
We used flow cytometry to evaluate the targeting efficacy of the nanoparticles (). In MDA-MB-361 ALDH+ and ALDH− cells, the MFI of the CFPE-Sali-NP-treated group was significantly higher than that of the CFPE-treated group (P<0.05 in MDA-MB-361 ALDH+ cells; P<0.001 in MDA-MB-361 ALDH− cells), suggesting that the nanoparticles had significantly increased targeting efficacy than free drugs (). Notably, the MFI of the CFPE-Sali-NP-HER2-treated group was higher than that of the CFPE-Sali-NP-treated group (P<0.01) and decreased after pretreatment with anti-HER2 Fab′ (P<0.01), suggesting that anti-HER2 Fab′ could efficiently increase the targeting efficacy of Sali-NP-HER2. With respect to BT-474 cells, similar results were gained (). CFPE-Sali-NP-HER2 exhibited significantly increased targeting efficacy compared with CFPE-Sali-NP in both BT-474 ALDH+ and ALDH− cells (P<0.001 in BT-474 ALDH+ cells; P<0.01 in BT-474 ALDH− cells).
Figure 3 In vitro cellular uptake of nanoparticles in breast cancer cells.
Notes: (A and B) In vitro cellular uptake of nanoparticles, evaluated by flow cytometry. Breast cancer cells were incubated with free CFPE, CFPE-Sali-NP, or CFPE-Sali-NP-HER2 for 4 h. In the competitive assay (CFPE-Sali-NP-HER2 + anti-HER2 Fab′), 50 mg/mL of anti-HER2 Fab′ was preincubated with the cells for 30 min prior to treatment with CFPE-Sali-NP-HER2. (C and D) In vitro cellular uptake of nanoparticles, evaluated by HPLC. Breast cancer cells were incubated with free salinomycin, Sali-NP, or Sali-NP-HER2 at a concentration of 50 μg/mL salinomycin for 4 h. In the competitive assay (Sali-NP-HER2 + anti-HER2 Fab′), 50 mg/mL of anti-HER2 Fab′ was preincubated with the cells for 30 min prior to treatment with Sali-NP-HER2. The intracellular uptake of salinomycin was calculated as intracellular salinomycin mass divided by cellular protein mass. Differences between groups were compared by one-way ANOVA and the Newman–Keuls method. Data are expressed as mean ± SD (n=3). *P<0.05; **P<0.01; ***P<0.001.
Abbreviations: ANOVA, analysis of variance; CFPE, 1,2-dioleoyl-sn-glycero-3-phosphoethanolamine-N-carboxyfluorescein (ammonium salt); CFPE-Sali-NP, CFPE-labeled salinomycin-loaded polymer–lipid nanoparticles; CFPE-Sali-NP-HER2, CFPE-labeled salinomycin-loaded polymer–lipid anti-HER2 nanoparticles; HPLC, high-performance liquid chromatography; Sali-NP, salinomycin-loaded polymer–lipid nanoparticles; Sali-NP-HER2, salinomycin-loaded polymer–lipid hybrid anti-HER2 nanoparticles.
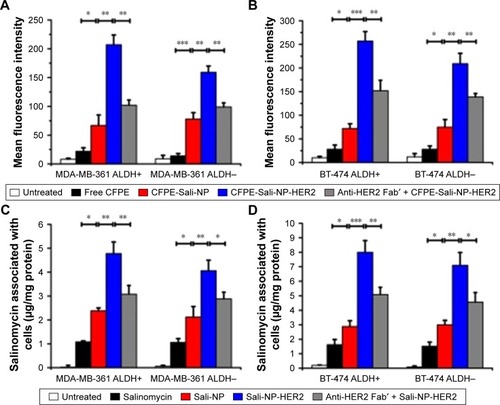
Furthermore, the salinomycin concentration in the Sali-NP-treated group was significantly higher than that of the salinomycin-treated group in both MDA-MB-361 ALDH+ and ALDH− cells (P<0.05) (). Notably, the salinomycin concentration in the Sali-NP-HER2-treated group was significantly higher than in the Sali-NP-treated group (P<0.01) and decreased substantially after pretreatment with anti-HER2 Fab′ (P<0.05), indicating that anti-HER2 Fab′ can efficiently increase the quantity of cell-associated salinomycin in Sali-NP-HER2. Similar results were observed in BT-474 cells ().
In summary, nanoparticles facilitated the cellular delivery of salinomycin, and anti-HER2 Fab′ further improved the targeting efficacy of nanoparticles in ALDH+ and ALDH− breast cancer cells.
CCK-8 assay
CCK-8 assays for nanoparticles and salinomycin were evaluated in ALDH+ and ALDH− breast cancer cells (). NP-HER2, the anti-HER2 nanoparticles not containing salinomycin did not exhibit any cytotoxic effects, whereas salinomycin, Sali-NP, and Sali-NP-HER2 inhibited cellular proliferation in a concentration-dependent manner. shows that in MDA-MB-361 ALDH+ cells, the half-maximal inhibitory concentration (IC50) of Sali-NP-HER2 (1.56 μg/mL) was significantly lower than that of Sali-NP (3.45 μg/mL) (P<0.05) and salinomycin (7.98 μg/mL) (P<0.01). In MDA- MB-361 ALDH− cells, the IC50 of Sali-NP-HER2 (7.80 μg/mL) was significantly lower than that of Sali-NP (18.35 μg/mL) (P<0.05) and salinomycin (28.01 μg/mL) (P<0.01). Thus, Sali-NP-HER2 was 2.2 and 5.1 times more effective than Sali-NP and salinomycin in MDA-MB-361 ALDH+ cells, respectively. In addition, Sali-NP-HER2 was 2.4 and 3.6 times more effective than Sali-NP and salinomycin in MDA-MB-361 ALDH− cells, respectively. Similar results were obtained in BT-474 cells. Sali-NP-HER2 was 2.4 and 7.9 times more effective than Sali-NP and salinomycin in BT-474 ALDH+ cells, respectively. In BT-474 ALDH− cells, Sali-NP-HER2 was 2.0 and 4.0 times more effective than Sali-NP and salinomycin, respectively.
Table 2 The IC50 values of salinomycin and nanoparticles in breast cancer cells
Figure 4 Cell proliferation assay.
Notes: ALDH+ and ALDH− breast cancer cells were seeded in 96-well plates with a density of 1×10⁴ cells per well overnight. The cells were incubated with the nanoparticles or salinomycin for 72 h, and cell viability was evaluated using the CCK-8 assay. (A) MDA-MB-361 ALDH+, (B) MDA-MB-361 ALDH−, (C) BT-474 ALDH+, and (D) BT-474 ALDH−. Data are expressed as mean ± SD (n=3).
Abbreviations: ALDH, aldehyde dehydrogenase; CCK-8, Cell Counting Kit-8; Sali-NP, salinomycin-loaded polymer-lipid nanoparticles; Sali-NP-HER2, salinomycin-loaded polymer–lipid hybrid anti-HER2 nanoparticles.
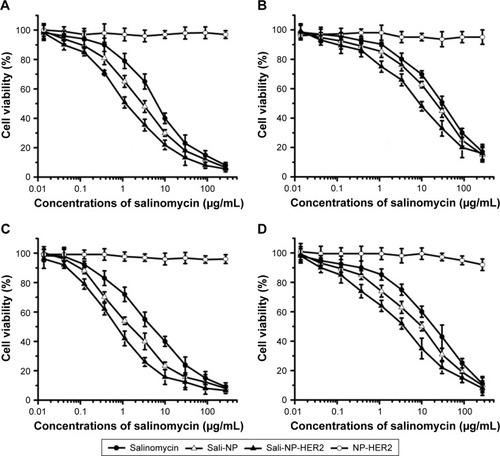
Furthermore, the IC50 of salinomycin in MDA-MB-361 ALDH+ cells (7.98 μg/mL) was significantly lower than that of salinomycin in MDA-MB-361 ALDH− cells (28.01 μg/mL) (P<0.01), and the IC50 of salinomycin in BT-474 ALDH+ cells (5.97 μg/mL) was significantly lower than that of salinomycin in BT-474 ALDH− cells (20.61 μg/mL) (P<0.05), suggesting that salinomycin preferentially eliminated breast CSCs. The IC50 of Sali-NP-HER2 in MDA-MB-361 ALDH+ cells (1.56 μg/mL) was significantly lower than that of Sali-NP-HER2 in MDA-MB-361 ALDH− cells (7.80 μg/mL) (P<0.05), and the IC50 of Sali-NP-HER2 in BT-474 ALDH+ cells (0.76 μg/mL) was significantly lower than that of Sali-NP-HER2 in BT-474 ALDH− cells (5.18 μg/mL) (P<0.05), suggesting that Sali-NP-HER2 also preferentially eliminated breast CSCs.
Taken together, these findings suggest that Sali-NP-HER2 exhibits superior activity toward ALDH+ and ALDH− breast cancer cells and significantly enhanced cytotoxic effects toward breast CSCs, compared with common breast cancer cells.
Effect of nanoparticles on the proportion of CSCs in breast cancer cells
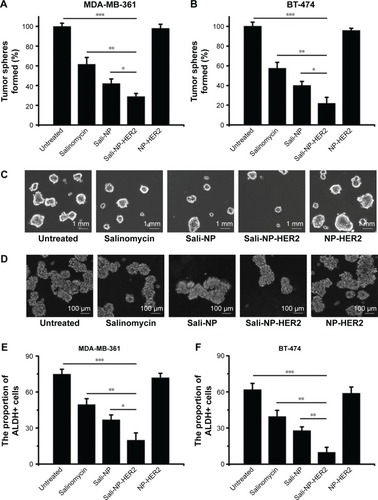
The effect of nanoparticles on the proportion of CSCs in breast cancer cell lines was examined by tumorsphere formation rate and the proportion of ALDH+ cells (). The rate of tumorsphere formation in suspension cultures has been reported to correlate with the proportion of CSCs.Citation13,Citation14 As shown in , salinomycin significantly reduced the number of MDA-MB-361 tumorspheres relative to the untreated control (P<0.05). Notably, Sali-NP-HER2 treatment resulted in a 4-fold decrease in the number of MDA-MB-361 tumorspheres relative to the untreated control and also fewer tumorspheres compared with salinomycin treatment (P<0.01) and Sali-NP treatment (P<0.05). Consistently, Sali-NP-HER2 significantly decreased the proportion of ALDH+ cells in MDA-MB-361 cells compared with salinomycin (P<0.01) and Sali-NP (P<0.05) (). Similar results were obtained in BT-474 cells (). Sali-NP-HER2 treatment resulted in a 5-fold decrease in the number of BT-474 tumorspheres and fewer tumorspheres than salinomycin treatment (P<0.05) and Sali-NP treatment (P<0.05) (). In addition, Sali-NP-HER2 significantly decreased the proportion of ALDH+ cells in BT-474 cells compared with salinomycin (P<0.01) and Sali-NP (P<0.05) (). Altogether, Sali-NP-HER2 showed enhanced therapeutic efficacy toward breast CSCs.
Figure 5 Effect of treatments on the percentage of CSCs.
Notes: Effect of the treatments on the proportion of CSCs in breast cancer cells, as reflected by the tumorsphere formation rate (A and B) and the proportion of ALDH+ cells (E and F). Representative images of tumorspheres formed by (C) MDA-MB-361 cells and (D) BT-474 cells are shown. The rate of tumorsphere formation is defined as the number of tumorspheres formed in 7 days in the treatment group divided by the number of tumorspheres formed in 7 days in the untreated group; the rate of tumorsphere formation in the untreated group is used as a control and defined as 100%. The two groups were compared by one-way ANOVA with the Newman–Keuls method. Data are expressed as mean ± SD (n=6). *P<0.05; **P<0.01; ***P<0.001.
Abbreviations: ANOVA, analysis of variance; ALDH, aldehyde dehydrogenase; CSCs, cancer stem cells; Sali-NP, salinomycin-loaded polymer–lipid nanoparticles; NP-HER2, polymer–lipid anti-HER2 nanoparticles; Sali-NP-HER2, salinomycin-loaded polymer–lipid hybrid anti-HER2 nanoparticles.
Antitumor activity of nanoparticles in vivo
Because of the lack of salinomycin, NP-HER2 exhibited no antitumor activity (). Sali-NP-HER2 achieved the best therapeutic efficacy, resulting in a 79% decrease in tumor volume, whereas Sali-NP and salinomycin obtained only moderate therapeutic efficacy (63% decrease and 43% decrease, respectively). Tumor volume in the Sali-NP-HER2-treated group was significantly smaller than tumor volume in other groups (Sali-NP-HER2 vs Sali-NP: P<0.05; Sali-NP-HER2 vs salinomycin: P<0.01; Sali-NP-HER2 vs NP-HER2: P<0.001; Sali-NP-HER2 vs saline: P<0.001) (). Tumor weight was compared between the groups (). Tumor weight in the Sali-NP-HER2-treated group was significantly lower than tumor weight in other groups (Sali-NP-HER2 vs Sali-NP: P<0.01; Sali-NP-HER2 vs salinomycin: P<0.01; Sali-NP-HER2 vs NP-HER2: P<0.001; Sali-NP-HER2 vs saline: P<0.001).
Figure 6 In vivo antitumor assay in mice bearing subcutaneous BT-474 tumors.
Notes: BT-474 tumors reached ~50 mm3 in size by day 10. From day 10, mice were injected with nanoparticles (7.5 mg salinomycin/kg, i.v.) through the tail vein, and salinomycin (7.5 mg salinomycin/kg) dissolved in ethanol was administered by intraperitoneal injection. Therapy was given nine times on alternate days (indicated by arrows), and tumor volume was calculated. (A) Tumor growth curve. (B) Excised tumors. (C) The excised tumors were weighed at the end point. On day 28, the effect of the drug treatments on the CSC proportion in BT-474 tumors in vivo was evaluated by (D) the rate of tumorsphere formation and (E) the proportion of ALDH+ cells from the excised tumors. (F) Representative images of tumorspheres from (D) are shown. The two groups were compared by one-way ANOVA with the Newman–Keuls method. Data are expressed as mean ± SD (n=8). *P<0.05; **P<0.01; ***P<0.001.
Abbreviations: ANOVA, analysis of variance; ALDH, aldehyde dehydrogenase; CSC, cancer stem cell; i.v., intravenous; Sali-NP, salinomycin-loaded polymer–lipid nanoparticles; NP-HER2, polymer–lipid anti-HER2 nanoparticles; Sali-NP-HER2, salinomycin-loaded polymer–lipid hybrid anti-HER2 nanoparticles.
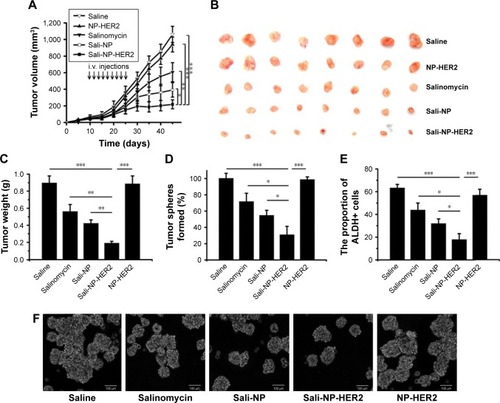
The therapeutic efficacy of nanoparticles against breast CSCs was also evaluated (). As expected, NP-HER2 did not affect tumorsphere formation of BT-474 cells compared with tumorsphere formation of the saline-treated control. Notably, Sali-NP-HER2 exhibited the best therapeutic efficacy against breast CSCs and induced a 4-fold decrease in BT-474 tumorsphere number relative to the saline control (). In addition, Sali-NP-HER2 treatment resulted in fewer tumorspheres compared with Sali-NP treatment (P<0.05) and salinomycin treatment (P<0.05). We also evaluated the proportion of ALDH+ breast cancer cells in the excised tumors (). Salinomycin significantly decreased the proportion of ALDH+ breast cancer cells compared with the saline control (P<0.05). Sali-NP-HER2 treatment decreased the proportion of ALDH+ breast cancer cells more efficiently than salinomycin (P<0.05) and Sali-NP (P<0.05). The relative proportion of the ALDH+ breast cancer cells was 3-fold lower after treatment with Sali-NP-HER2 than after treatment with saline. Thus, Sali-NP-HER2 efficiently decreased the population of breast CSCs in vivo.
Discussion
The treatment of breast cancer is a priority in public health. To maximize therapeutic efficacy, both breast CSCs and cancer cells must be eliminated. We constructed Sali-NP-HER2 to achieve effective salinomycin delivery to HER2-overexpressing breast CSCs and cancer cells.
The components of Sali-NP-HER2, including PLGA, soybean lecithin, DSPE-PEG2000, and anti-HER2 antibodies, are all US Food and Drug Administration-approved materials or drugs. Salinomycin was tested in a pilot clinical trial and exhibited good safety.Citation9,Citation13 We expect Sali-NP-HER2 to exhibit good safety as well, as required for nanoparticles in clinical use.Citation29
We found that HER2 was substantially expressed in both breast CSCs and cancer cells, and more importantly, HER2 expression increased significantly in breast CSCs compared with breast cancer cells. Our results were consistent with those of previous studies, in which breast CSCs exhibited increased HER2 levels compared with common breast cancer cells.Citation6,Citation8 Since HER2 expression in normal mammary epithelial cells or breast cancer cells enhances the tumor-initiating cell component driving tumorigenesis, invasion, and metastasis, it is plausible that HER2 expression would increase in breast CSCs compared with breast cancer cells.Citation8,Citation32 Thus, HER2 represents not only a promising target in breast cancer cells but also in breast CSCs.
CSCs emerge as a promising target in cancer therapy, and development of efficient CSC-specific therapies may enhance survival rates.Citation25 Nanoparticles show potential against CSCs because of their controlled and targeted drug delivery and efficient pharmacokinetics and biodistribution.Citation30 Targeted nanoparticles could improve drug delivery to cancer cells.Citation17–Citation19 Similarly, targeted nanoparticles with CSC marker-specific ligands are expected to preferentially eliminate CSCs. Wang et al developed single-walled carbon nanotubes (SWNTs) with CD133 mAb (anti-CD133-SWNTs) to target glioblastoma CD133+ cells.Citation31 However, targeted nanoparticles with CSC marker-specific ligands may spare the bulk cancer cells which do not express CSC markers.Citation25 Considering that sufficient evidence has established that cancer cells can spontaneously turn into CSCs, the common marker overexpressed in both CSCs and cancer cells is a promising target. HER2 has also been found to be overexpressed in breast CSCs in HER2-overexpressing cancer cells.Citation8,Citation22 Thus, HER2 could be used to target both breast CSCs and cancer cells. Our data showed that the presence of an anti-HER2 antibody was crucial in maintaining the targeting efficacy of Sali-NP-HER2 in HER2-overexpressing breast CSCs and cancer cells. Flow cytometry and HPLC showed that Sali-NP-HER2 could efficiently target HER2-overexpressing breast CSCs and cancer cells, resulting in enhanced cytotoxic effect compared with Sali-NP or salinomycin. In mice bearing BT-474 breast cancer xenografts, administration of Sali-NP-HER2 displayed superior efficacy in inhibiting tumor growth compared with Sali-NP and salinomycin. Sali-NP-HER2 inhibited breast CSCs more effectively than Sali-NP and salinomycin both in vitro and in vivo. The superior activity of Sali-NP-HER2 is attributable to the targeting efficacy but not the intrinsic activity of the conjugated HER2 antibody. In our study, NP-HER2, the blank polymer–lipid hybrid anti-HER2 nanoparticles, did not exhibit cytotoxic effects on breast cancer cells and did not affect the proportion of CSCs in breast cancer cells. Importantly, in the mice bearing breast cancer xenografts, NP-HER2 did not exhibit any antitumor activity compared with the saline control.
Conclusion
HER2 is a target for drug delivery to both breast CSCs and cancer cells. Sali-NP-HER2 represents a promising treatment for breast cancer by eliminating both breast CSCs and cancer cells.
Acknowledgments
This work was supported by the National Natural Science Foundation of China (81402512 and 81771964), Liaocheng Municipal Science and Technology Development Planning project (2014GJH11), Shandong Provincial Science and Technology Development Planning project (2014GGB019AF), Natural Science Foundation of Shandong Province, China (ZR2013HZ002 and ZR2016EL04), and Special Funds for the Construction of Taishan Scholars. We thank Sunlipo Biotech Research Center for Nanomedicine (Shanghai, China) for providing technical supports in the preparation of nanoparticles.
Disclosure
The authors report no conflicts of interest in this work.
References
- BensonJRJatoiIThe global breast cancer burdenFuture Oncol20128669770222764767
- FerlayJHéryCAutierPSankaranarayananRBreast cancer epidemiologyLiCGlobal Burden of Breast Cancer12New YorkSpringer2010119
- Gonzalez-AnguloAMMorales-VasquezFHortobagyiGNOverview of resistance to systemic therapy in patients with breast cancerAdv Exp Med Biol2007608112217993229
- ScullyOJBayBHYipGYuYBreast cancer metastasisCancer Genomics Proteomics20129531132022990110
- ReyaTMorrisonSJClarkeMFWeissmanILStem cells, cancer, and cancer stem cellsNature2001414685910511111689955
- KaiKArimaYKamiyaTSayaHBreast cancer stem cellsBreast Cancer2010172808519806428
- GuptaPBOnderTTJiangGIdentification of selective inhibitors of cancer stem cells by high-throughput screeningCell2009138464565919682730
- MagnificoAAlbanoLCampanerSTumor-initiating cells of HER2-positive carcinoma cell lines express the highest oncoprotein levels and are sensitive to trastuzumabClin Cancer Res20091562010202119276287
- NaujokatCSteinhartRSalinomycin as a drug for targeting human cancer stem cellsJ Biomed Biotechnol20122012895065823251084
- YueWHamaïATonelliGInhibition of the autophagic flux by salinomycin in breast cancer stem-like/progenitor cells interferes with their maintenanceAutophagy20139571472923519090
- MeachamCEMorrisonSJTumour heterogeneity and cancer cell plasticityNature2013501746732833724048065
- ChafferCLBrueckmannIScheelCNormal and neoplastic nonstem cells can spontaneously convert to a stem-like stateProc Natl Acad Sci U S A2011108197950795521498687
- MaoXLiuJGongZiRGD-conjugated DSPE-PEG2000 nanomicelles for targeted delivery of salinomycin for treatment of both liver cancer cells and cancer stem cellsNanomedicine (Lond)201510172677269526355733
- XieFZhangSLiuJCodelivery of salinomycin and chloroquine by liposomes enables synergistic antitumor activity in vitroNanomedicine (Lond)201611141831184627391366
- KrishnamurthySNgVWGaoSTanMHHedrickJLYangYYCodelivery of dual drugs from polymeric micelles for simultaneous targeting of both cancer cells and cancer stem cellsNanomedicine (Lond)201510182819283226377155
- Brannon-PeppasLBlanchetteJONanoparticle and targeted systems for cancer therapyAdv Drug Deliv Rev20126411206212
- ChoiHSLiuWLiuFDesign considerations for tumour-targeted nanoparticlesNat Nanotechnol201051424719893516
- GaoJFengSSGuoYAntibody engineering promotes nanomedicine for cancer treatmentNanomedicine (Lond)2010581141114521039191
- GaoJXiaYChenHPolymer-lipid hybrid nanoparticles conjugated anti-HER2 antibody for targeted drug delivery to hepatocellular carcinomaNanomedicine (Lond)20149227929323721168
- YardenYBiology of HER2 and its importance in breast cancerOncology2001612 suppl113
- HerbstRSReview of epidermal growth factor receptor biologyInt J Radiat Oncol Biol Phys2004592 suppl2126
- LiuSWichaMSTargeting breast cancer stem cellsJ Clin Oncol201028254006401220498387
- GaoJChenHSongHAntibody-targeted immunoliposomes for cancer treatmentMini Rev Med Chem201313142026203524251805
- ChanJMZhangLYuetKPPLGA-lecithin-PEG core-shell nanoparticles for controlled drug deliveryBiomaterials20093081627163419111339
- GaoJLiWGuoYFengSSNanomedicine strategies for sustained, controlled and targeted treatment of cancer stem cellsNanomedicine (Lond)201611243261328227854161
- Charafe-JauffretEGinestierCIovinoFAldehyde dehydrogenase 1-positive cancer stem cells mediate metastasis and poor clinical outcome in inflammatory breast cancerClin Cancer Res2010161455520028757
- GaoJKouGWangHPE38KDEL-loaded anti-HER2 nanoparticles inhibit breast tumor progression with reduced toxicity and immunogenicityBreast Cancer Res Treat20091151294118481173
- GaoJSunJLiHLyophilized HER2-specific PEGylated immunoliposomes for active siRNA gene silencingBiomaterials20103192655266420035999
- AiJBiazarEJafarpourMNanotoxicology and nanoparticle safety in biomedical designsInt J Nanomedicine201161117112721698080
- GaoJGuoYFengSSNanomedicine for treatment of cancer stem cellsNanomedicine (Lond)20149218118424552558
- WangCHChiouSHChouCPChenYCHuangYJPengCAPhotothermolysis of glioblastoma stem-like cells targeted by carbon nanotubes conjugated with CD133 monoclonal antibodyNanomedicine201171697920620237
- KorkayaHPaulsonAIovinoFWichaMSHER2 regulates the mammary stem/progenitor cell population driving tumorigenesis and invasionOncogene200827476120613018591932