
Abstract
Background
Silver nanoparticles (AgNPs) exhibit strong antibacterial and anticancer activity owing to their large surface-to-volume ratios and crystallographic surface structure. Owing to their various applications, understanding the mechanisms of action, biological interactions, potential toxicity, and beneficial effects of AgNPs is important. Here, we investigated the toxicity and differentiation-inducing effects of AgNPs in teratocarcinoma stem cells.
Materials and methods
AgNPs were synthesized and characterized using various analytical techniques such as UV–visible spectroscopy, X-ray diffraction, energy-dispersive X-ray spectroscopy, and transmission electron microscopy. The cellular responses of AgNPs were analyzed by a series of cellular and biochemical assays. Gene and protein expressions were analyzed by reverse transcription-quantitative polymerase chain reaction and western blotting, respectively.
Results
The AgNPs showed typical crystalline structures and spherical shapes (average size =20 nm). High concentration of AgNPs induced cytotoxicity in a dose-dependent manner by increasing lactate dehydrogenase leakage and reactive oxygen species. Furthermore, AgNPs caused mitochondrial dysfunction, DNA fragmentation, increased expression of apoptotic genes, and decreased expression of antiapoptotic genes. Lower concentrations of AgNPs induced neuronal differentiation by increasing the expression of differentiation markers and decreasing the expression of stem cell markers. Cisplatin reduced the viability of F9 cells that underwent AgNPs-induced differentiation.
Conclusion
The results showed that AgNPs caused differentially regulated cytotoxicity and induced neuronal differentiation of F9 cells in a concentration-dependent manner. Therefore, AgNPs can be used for differentiation therapy, along with chemotherapeutic agents, for improving cancer treatment by targeting specific chemotherapy-resistant cells within a tumor. Furthermore, understanding the molecular mechanisms of apoptosis and differentiation in stem cells could also help in developing new strategies for cancer stem cell (CSC) therapies. The findings of this study could significantly contribute to the nanomedicine because this study is the first of its kind, and our results will lead to new strategies for cancer and CSC therapies.
Introduction
Nanotechnology is an interdisciplinary science through which nanomaterials are generated for new applications in medicine. Nanotechnology has progressed significantly in various areas of research, including biotechnology, biomedical sciences, electronics, mechanics, cosmetics, and food. Silver nanoparticles (AgNPs), one of the most common commercialized nanomaterials, have gained much interest in both academics and industry owing to their unique physical, chemical, and biological properties. AgNPs have been widely used in a range of biomedical applications, including as antibacterial, antiviral, antifungal, antiangiogenic, and anticancer agents as well as in drug delivery, diagnosis, treatment, medical device coatings, and personal health care products.Citation1–Citation4
An interesting characteristic of AgNPs is that they can be used both as cytotoxic agents and as differentiation-inducing agents. The cytotoxic effects of AgNPs have been reported in different types of cancer and non-cancer cells, including human peripheral blood mononuclear cells,Citation5 human alveolar epithelial cells (A549),Citation6,Citation7 murine and human alveolar macrophage cells,Citation8 rat liver cells,Citation9 male somatic cells and spermatogonial stem cells (SSCs),Citation10,Citation11 neuroendocrine cells,Citation12 human breast cancer cells,Citation13 human ovarian cancer cells,Citation14 human embryonic stem cell (ESC)-derived fibroblasts, and L-929 cells. AgNPs induce toxicity by releasing silver ions into the cells, which activate ion channels and increase the cell membrane’s permeability to both potassium and sodium, by interacting with mitochondria, and by inducing apoptosis via both intrinsic and extrinsic pathways through the generation of reactive oxygen species (ROS).Citation15,Citation16 The toxicity of AgNPs depends on their size, shape, surface charge, concentration, and surface functionalization.Citation17 The size of AgNPs also plays a major role in inflammation and genotoxicity.Citation18 In addition, AgNPs can induce differentiation of several neuronal cells, depending on their concentration and the cell type.
Differentiation is an important phenomenon in cancer cells, and differentiation therapy holds a great promise for cancer treatment.Citation19 The differentiation of cancer cells into normal tissue cells, which contributes to tumor regression, is induced by certain factors, including genetic processes, nutrient conditions, and chemicals.Citation20 Recent advancements in stem cell research show that stem cells used as seed cells have unique properties that are vital to the development of engineered tissue constructs, including high proliferation rates, self-renewal, and specialized differentiation under specific conditions.Citation21 In addition, differentiated stem cells are less resistant to chemotherapy than non-differentiated cells. AgNPs act as either differentiation-inducing or cytotoxic agent, depending on their concentration and the cell type. For instance, AgNPs were shown to promote osteogenic differentiation of urine-derived stem cells by inducing actin polymerization, increasing cytoskeletal tension, and activating RhoA.Citation21 In contrast, AgNPs were found to inhibit differentiation via autophagy blockade and lysosomal impairment in THP-1 monocytes.Citation22 Several studies have reported that AgNPs play an important role in tissue engineering scaffolds, with a reduced incidence of infection and significant cell compatibility.Citation23,Citation24 In one study, the cellular uptake of AgNPs did not influence the osteogenic differentiation of human mesenchymal stem cells (hMSCs).Citation25 AgNPs have been shown to induce neuronal differentiation of SH-SY5Y cells via modulation of ROS, phosphatases, and kinase signaling pathways.Citation26 In another study, substrates coated with AgNPs, which serve as favorable anchoring sites, showed significantly enhanced neurite outgrowth.Citation27 Androgen deprivation and chemical compounds were found to induce differentiation of neuroendocrine cells in prostate cancer.Citation28,Citation29 All these studies suggest that the restoration of normal function or differentiated phenotypes in cancer cells is possible by the tumor-suppressive function of AgNPs.
Cellular signaling is an interconnected network process that is important for the regulation of diverse processes such as protein synthesis, cell growth, cell survival, motility, cell architecture and polarity, differentiation, and programmed cell death. Individual signaling molecules can control different signaling complexes at different intracellular locations.Citation30 Epidermal growth factor (EGF) and its receptor (EGFR) control responses ranging from proliferation and survival to wound healing and migration in different cell types.Citation31 Previous studies have identified that at subtoxic levels, AgNPs interfered in both EGF and nerve growth factor signal transduction in SSCs and human lung carcinoma cells.Citation11,Citation32,Citation33 Comfort et al reported that the nanoparticle-induced interference of EGF signaling took place in four different phases, namely, interaction of nanoparticles with EGF, Akt and Erk phosphorylation, Akt activity, and EGF-dependent gene regulation, in the human epithelial cell line A-431.Citation33 Furthermore, Comfort et al reported that after chronic exposure to AgNPs in the pg/mL range, cells displayed an augmented stress profile and modified EGF signaling efficiency, as well as increased p38 activation, actin disorganization, heightened ki67 expression, and extensive gene modification. EGFR is known to activate the downstream kinases such as the PI3K/Akt and ras/Erk cascades. Akt is a critical player in a multitude of processes, including immune functionality, metabolism, cell survival, and growth.Citation34,Citation35
Erk controls various cellular processes, including proliferation, mitosis, and differentiation.Citation36 Recently, Dayem et al reported that the treatment of SH-SY5Y with biologically synthesized AgNPs led to cell morphological changes, a significant increase in neurite length, enhanced differentiation of neuronal cells by increase in intracellular ROS and activation of several kinases such as Erk and Akt, and the downregulation of DUSP expression.Citation26 Given that embryonal carcinoma (EC) cells mimic the early embryo, they are used as an in vitro model for studying the developmental aspects. These stem cells can be induced to differentiate in vitro into cell types that resemble those found at various stages of early mouse development.Citation37 In addition, EC cells, which are the malignant stem cells of teratocarcinomas, are considered similar to early embryonic cells. Furthermore, EC cells can be easily derived from early embryonic cells or germ cells in vivo and in vitro, and the morphological, biochemical, and immunochemical properties of EC cells are very similar to those of the inner cell mass or the primitive ectoderm cells of the blastocyst-stage embryo. Finally, the mode of differentiation of EC cells is very similar to that of the apparently corresponding cells in the embryo, which can give rise to a variety of cell types, and also to all differentiated types of cells in the embryo. With the growing application of AgNPs in the medical field, it is essential to better understand their mechanisms of action, biological interactions, and potential toxicity/differentiation-inducing effect. Therefore, this study was designed to critically assess the cytotoxicity and differentiation-inducting effect of AgNPs in F9 teratocarcinoma stem cells.
Materials and methods
Materials
DMEM, penicillin–streptomycin solution, and trypsin–EDTA solution were purchased from Thermo Fisher Scientific (Waltham, MA, USA). FBS, in vitro cell proliferation kit, and cell-counting kit-8 (CCK-8) were obtained from Dojindo Laboratories (Kumamoto, Japan). In Vitro Toxicology Assay Kit (TOX7), 2′,7′-dichlorodihydrofluorescein diacetate (DCFH-DA), in situ cell death detection kit (TMR red), and AgNO3 were purchased from Sigma-Aldrich (St Louis, MO, USA). Cationic fluorescent indicator (JC-1) was obtained from Molecular Probes (Eugene, OR, USA). Rabbit anti-p-Akt, total Akt, p-p38, total p38, rabbit anti-p-Erk, and total Erk were purchased from Cell Signaling (Danvers, MA, USA). p-p53, total p53 pro- and cleaved caspase-3, caspase-9, Bax, Bcl-2, and β-actin were purchased from Abcam (Cambridge, UK).
Synthesis and characterization of AgNPs
The synthesis and characterization of AgNPs was carried out according to a previously described method.Citation3,Citation7,Citation11 Briefly, Escherichia coli were grown in Luria-Bertani broth without NaCl. The flasks were incubated for 21 h in a shaker set at 200 rpm and 37°C. After the incubation period, the culture was centrifuged at 10,000 rpm, and the supernatant was used for the synthesis of AgNPs. To produce bio-AgNPs, the culture supernatant was treated with 5 mM AgNO3 and incubated for 5 h at 60°C at pH 8.0.
Cell culture and treatment
F9 mouse embryonic carcinoma cells were purchased from the Korean Cell Line Bank (KCLB) and maintained in DMEM supplemented with 10% FBS and 1% antibiotic–antimycotic solution. Cells were grown to confluence at 37°C in 5% CO2. Experiments were performed in 96-, 24-, and 12-well plates and 100-mm cell culture dishes, as occasion demanded. Cells were treated with various concentrations of AgNPs or two different doses of AgNPs (12.5 and 25 μg/mL), retinoic acid (RA; 1 μM), and cisplatin (1 μM).
Cell viability
Cell viability was measured using CCK-8 (CK04-01; Dojindo Laboratories). Briefly, F9 cells were plated in 96-well flat-bottom culture plates containing various concentrations of AgNPs, AgNO3, or cisplatin. After 24-h culture at 37°C and 5% CO2 in a humidified incubator, CCK-8 solution (10 μL) was added to each well, and the plate was incubated for another 2 h at 37°C. The absorbance was measured at 450 nm using a microplate reader (Multiskan FC; Thermo Fisher Scientific).
Membrane integrity
The membrane integrity of F9 cells was evaluated using an LDH Cytotoxicity Detection Kit. Briefly, cells were exposed to various concentrations of AgNPs for 24 h. Subsequently, 100 μL of cell-free supernatant from each well was transferred in triplicate into the wells of a 96-well plate, and then 100 μL of the lactate dehydrogenase (LDH) reaction mixture was added to each well. After 3 h of incubation under standard conditions, the optical density of the final solution was determined at a wavelength of 490 nm using a microplate reader.
Determination of intracellular ROS
The F9 cells were treated with AgNPs or AgNO3 for 24 h. ROS were measured according to a previous method based on the intracellular peroxide-dependent oxidation of DCFH-DA (Molecular Probes) to form the fluorescent compound 2′,7′-dichlorofluorescein (DCF).Citation7,Citation11 Cells were seeded onto 24-well plates at a density of 5×10⁴ cells per well and cultured for 24 h. After washing twice with PBS, fresh medium containing AgNPs or AgNO3 was added, and the cells were incubated for 3 h. For the control, 20 μM DCFH-DA was added to the cells and incubated for a further 30 min at 37°C. The cells were then rinsed with PBS, and 2 mL of PBS was added to each well and the fluorescence intensity was determined using a spectrofluorometer (Gemini EM) with excitation at 485 nm and emission at 530 nm. DCFH-DA (20 μM) was then added, and the cells were incubated for 30 min at 37°C before measuring the changes in DCF fluorescence as described.
JC-1 assay
The F9 cells were treated with AgNPs or AgNO3 for 24 h. The change in mitochondrial transmembrane potential was determined using the cationic fluorescent dye JC-1 (Molecular Probes). Fluorescence of JC-1 aggregates and JC-1 monomers was measured at an excitation wavelength of 488 nm and emission wavelengths of 583 and 525 nm, respectively, using a Gemini EM fluorescence microplate reader (Molecular Devices, Sunnyvale, CA, USA).
Terminal deoxynucleotidyl transferase dUTP nick end labeling (TUNEL) assay
The F9 cells were treated with AgNPs or AgNO3 for 24 h. Apoptotic DNA fragmentation was detected using a DNA fragmentation imaging kit (Roche, Basel, Switzerland), following the manufacturer’s instructions and as described previously.Citation11 Based on the TUNEL reaction, fluorescence detection of cells with apoptotic DNA strand breaks was performed. To examine total cell numbers, nuclei were labeled simultaneously with DAPI. Merged images of both channels were obtained using a fluorescence microscope (Olympus, Tokyo, Japan) at 100× magnification.
Flow cytometry analysis
A flow cytometry analysis was performed according to a method described previously.Citation11 The F9 cells were treated with AgNPs or AgNO3 for 24 h, after which they were trypsinized and aliquoted. Aliquots containing 2.5×10⁵–5.0×10⁵ cells were stained for 30 min with the fluorescent dyes JC-1 and DCFH-DA. Thereafter, the cells were washed with PBS, centrifuged at 1,200 g, and resuspended in storage buffer (PBS containing 1% FBS). Cells were analyzed using a FACSCalibur flow cytometer and Cell Quest software (BD Biosciences, San Jose, CA, USA). A total of 104 events were collected during each run.
Reverse transcription-quantitative polymerase chain reaction (RT-qPCR)
Total RNA was extracted from the cells treated with required concentrations of AgNPs or AgNPs (12.5 μg/mL), or AgNPs (25 μg/mL), or AgNO3 (12.5 μg/mL) for 24 h using the Arcturus PicoPure RNA isolation kit (Arcturus Bioscience, Mountain View, CA, USA), and then samples were prepared according to the manufacturer’s instructions. Real-time RT-qPCR was conducted using a Vill7 (Applied Biosystems, Foster City, CA, USA) and SYBR Green as the double-stranded DNA-specific fluorescent dye (Applied Biosystems). Target gene expression levels were normalized to GAPDH expression, which was unaffected by treatment. The real-time RT-qPCR primer sets are shown in . The real-time RT-qPCR was performed independently in triplicate for each of the different samples; the data are presented as the mean values of gene expression measured in treated samples versus the control.
Table 1 Primers used for real-time quantitative polymerase chain reaction for the analysis of differentiation and expression of apoptotic and antiapoptotic markers in stem cells
Western blotting
The F9 cells (8×10⁴ cells/dish) were seeded on 100-mm cell culture plates (Sarstedt, Nümbrecht, Germany) and cultured in the presence of AgNPs, or AgNO3, or cisplatin. The protein was then estimated using the Pierce BCA protein assay kit (Thermo Fisher Scientific): 20 μg of the protein per track was separated using SDS-PAGE with 10% (w/v) acrylamide:bis-acrylamide (29:1) resolving gel, transferred onto a PVDF membrane by the semi-dry transfer method, and blocked with TBST (5% [w/v] skim milk in TBST) overnight. Subsequently, the membranes were treated with each primary antibody at 1:1,000 dilution for 2 h. Finally, after washing with TBST thrice, secondary anti-rabbit IgG-HRP (Enzo) antibody was added at a 1:2,000 dilution for 45 min and detected using the X-ray film.
Statistical analysis
Independent experiments were repeated at least three times, and data are presented as mean ± standard deviation for all duplicates within an individual experiment. Data were analyzed by t-test or multivariate analysis or one-way analysis of variance followed by the Tukey test for multiple comparisons to determine the differences between groups denoted by an asterisk using GraphPad Prism analysis software.
Results and discussion
Synthesis and characterization of AgNPs
AgNPs were synthesized according to a previously described method.Citation3,Citation7 The synthesized AgNPs were characterized using various analytical techniques, including UV–visible spectroscopy, X-ray diffraction (XRD), transmission electron microscopy (TEM), and energy-dispersive X-ray spectroscopy (EDX). UV–visible spectroscopy is a valuable tool for the analysis of nanoparticles. The typical characteristic broad and strong peak of AgNPs was observed at 420 nm, indicating successful synthesis (). The characteristic of this peak, assigned to a surface plasmon, has been well documented for various metal nanoparticles with sizes ranging from 2 to 100 nm.Citation38,Citation39
Figure 1 Synthesis and characterization of AgNPs.
Notes: (A) UV–visible spectra of AgNPs. The absorption spectra of AgNPs exhibited a strong broad peak at 420 nm, which was attributed to the surface plasmon resonance of the particles. (B) X-ray diffraction pattern of AgNPs. The diffraction peaks at 39.7°, 46.9°, and 67.7° corresponded to the 111, 200, and 220 lattice planes of silver, respectively. (C) Analysis of AgNPs surface morphology. Several fields were photographed and used to determine the diameter of AgNPs using TEM. The average diameter was 20 nm. Scale bar =20 nm. (D) Histogram of the particle sizes determined from TEM images. (E) EDX spectra of AgNPs.
Abbreviations: AgNPs, silver nanoparticles; TEM, transmission electron microscopy; EDX, energy-dispersive X-ray spectroscopy.
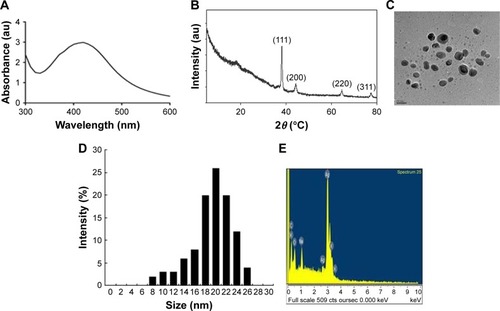
The crystalline nature of AgNPs was confirmed using XRD. The diffracted intensities were recorded from 20° to 80°. The XRD pattern of AgNPs showed four intensive peaks at 38.7°, 45.9°, 64.7°, and 75.3, corresponding to the 111, 200, and 220, and 311 lattice planes for silver, respectively (). The average size of the particles was 20 nm.Citation7 Similarly, AgNPs synthesized using the leaf extract of Artemisia princeps as a bioreductant and aqueous leaf extract of Urtica dioica showed average sizes of 20 and 25 nm, respectively.Citation40,Citation41
TEM is an indispensable technique to directly analyze the structure, size, and shape of AgNPs. TEM micrographs of the biologically synthesized AgNPs revealed distinct, uniformly distributed, and significantly spherical-shaped particles with sizes ranging between 8 and 26 nm (). As we reported earlier, E. coli culture supernatants can produce AgNPs with an average size of 50 nm, depending on the temperature, pH, concentration of AgNO3, and concentration of culture supernatant.Citation3 Han et al reported that E. coli culture supernatants can produce AgNPs with an average size of 20 nm by increasing the concentration of AgNO3 and using high temperature.Citation7 Gram-positive bacteria such as Bacillus licheniformis and Bacillus thuringiensis produced AgNPs with an average size of 50 and 15 nm, respectively.Citation42,Citation43 Altogether, the results obtained from the XRD pattern are in significant agreement with TEM image pattern, which suggests the crystalline nature of AgNPs.
We performed EDX to identify the elemental composition of the biologically prepared AgNPs. As shown in , the EDX profile showed a strong silver signal along with weak oxygen and carbon peaks, which may have originated from the binding of biomolecules from the culture to the AgNPs surfaces, thus confirming the formation of AgNPs and indicating the reduction of silver ions to elemental silver. Metallic silver nanocrystals typically show an optical absorption peak at approximately 3 keV due to surface plasmon resonance.Citation44 Our findings suggest that the synthesis of AgNPs was pure, given the high percentage of silver.
Effect of AgNPs on F9 cell toxicity
To determine the viability of F9 cells, the cells were treated with different concentrations of AgNPs and AgNO3, the latter of which was used as a positive control. The viability of F9 cells was decreased significantly compared to that of the negative control (). Notably, AgNO3 exhibited enhanced toxicological effects on F9 cells, compared to the effects of AgNPs, which is due to the fast release of silver ions from AgNO3.Citation11 We observed similar results when male-and female-derived somatic and germ cells were treated with AgNPs and AgNO3. Several studies have reported that the AgNPs could induce a variety of toxicity mechanisms, including generation of ROS, in an intrinsic and extrinsic manner in different types of cancer cells including human breast cancer cells, A549 human lung carcinoma cells, T24 bladder carcinoma cells, and male somatic cells and SSCs.Citation7,Citation10,Citation13,Citation40,Citation45,Citation46
Figure 2 Cytotoxicity assessment of AgNPs in F9 cells.
Notes: (A) Viability of F9 cells was determined 24 h after exposure to different concentrations of AgNPs, using the WST-8 assay. The results are expressed as the mean ± standard deviation of three independent experiments. A significant difference was observed for AgNPs concentration above 6.125 μg/mL. (B) LDH activity was measured at 490 nm using the LDH cytotoxicity kit. The results are expressed as the mean ± standard deviation of three independent experiments. The viability of treated and untreated cells was compared using Student’s t-test (P<0.05). There was a significant difference observed in the LDH activity of AgNPs-treated cells compared to that of the untreated cells using Student’s t-test (*P<0.5).
Abbreviations: AgNPs, silver nanoparticles; LDH, lactate dehydrogenase.
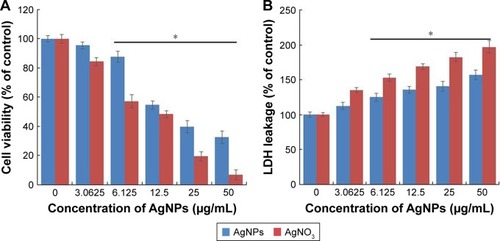
Next, we examined the leakage of LDH in AgNPs- and AgNO3-treated cells. LDH is a well-known indicator of cell death. When the cells were treated with AgNPs and AgNO3, the amount of LDH leaked into the media increased in a dose-dependent manner (). However, the leakage was remarkably higher in AgNO3-treated cells than in AgNPs-treated cells, which indicates that AgNO3 induces more severe toxicity than AgNPs does. The leakage of LDH could be a result of oxidation stress and loss of membrane integrity caused by AgNPs and the release of Ag ions. The cytotoxicity of AgNPs is consistent with previous reports on a variety of cancer cell lines including human breast, lung, and ovarian cancer cells.Citation7,Citation13,Citation40
AgNPs induce ROS generation
Generally, cells treated with exogenous reagents such as chemotherapeutic agents, nanoparticles, and cytotoxic agents are always subjected to the precarious effects of exogenously or endogenously produced highly reactive oxidizing molecules, which eventually leads to cell structure damage, and ROS generation is also involved in a wide variety of physiological and pathological processes in animal cells.Citation47 To determine the intracellular ROS level after exposure of F9 cells to AgNPs and AgNO3, we performed flow cytometry analysis and fluorescence microscopy using DCFH-DA. DCFH-DA is a widely used indicator which is converted into the highly fluorescent substance DCF inside the cells after cleavage of the acetate groups by intracellular esterases and oxidation by ROS.Citation48 We measured the distribution of the fluorescence intensity in the presence or absence of AgNPs or AgNO3. It was found that the treatment of F9 cells with AgNPs (53.37%) or AgNO3 (73.21%) led to a marked shift to greater fluorescence peak intensities compared to the untreated control () (P<0.05). Moreover, ROS generation induced by AgNPs resulted in high FITC fluorescence intensity, indicating an increased susceptibility to oxidative stress ().
Figure 3 Effect of AgNPs on ROS generation.
Notes: (A) F9 cells were treated with or without 12.5 μg/mL of AgNPs or 6.125 μg/mL of AgNO3 for 24 h, and ROS generation was measured using flow cytometry. (B) Treated cells were measured for DCFH-DA-FITC by fluorescence microscopy analysis. Scale bar =200 μm. (C) The bar graph indicates the ratio between control and treated samples. The results are expressed as the mean ± standard deviation of three independent experiments. There was a significant difference observed in the ROS generation in the AgNPs- or AgNO3-treated cells compared to that of the untreated cells using Student’s t-test (*P<0.5, ***P<0.01).
Abbreviations: AgNPs, silver nanoparticles; ROS, reactive oxygen species; DCFH-DA, 2′,7′-dichlorodihydrofluorescein diacetate; BF, bright field; FITC, fluorescein isothiocyanate.
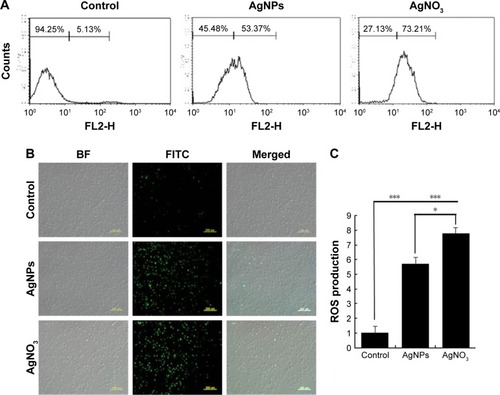
Next, to determine whether treatment with AgNPs and AgNO3 would generate oxidative stress in F9 cells, the cells were stained with DCFH-DA and examined for the production of ROS by measuring the cell population positive for DCF-derived fluorescence after the treatment. Treatment with AgNPs and AgNO3 stimulated ROS generation in cells (). The amount of ROS generated in cells treated with AgNO3 was higher than that in cells treated with AgNPs, whereas the amount in cells treated with AgNPs was higher than untreated cells. The increased fluorescence intensities are shown in . It is well known that AgNPs can exhibit cytotoxic, antitumor, and antiangiogenic activities through the induction of oxidative stress by generating ROS in various types of cells, including Dalton’s lymphoma ascites cells, human breast, lung, and ovarian cancer cells, and mouse testicular cells.Citation3,Citation7,Citation10,Citation11,Citation13,Citation49 Previous toxicological studies suggest that the intracellularly accumulated nanopar-ticles release toxic silver ions that induce ROS generation, thereby unbalancing the redox homeostasis of the cells.Citation50,Citation51 Finally, the intracellular ROS target biomolecules such as proteins, DNA, and lipids and disrupt cellular organelles, inducing membrane disorder, cytoskeletal disruption, and genotoxic lesions, all of which together contribute to the initiation of the apoptotic process by both the intrinsic and extrinsic pathways. Consequently, AgNPs-induced ROS and oxidative stress play an important role in cytotoxicity.
AgNPs cause mitochondrial dysfunctions in F9 cells
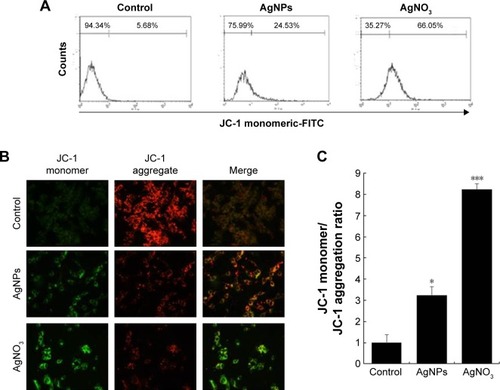
Mitochondria are important to maintain the energy supply and normal functions of cells, as well as being involved in the induction of apoptosis, programmed cell death, and cellular calcium and redox homeostasis.Citation52 For instance, chemotherapeutic agents, such as doxorubicin, target cancer cells and change the structure and function of mitochondria. Mitochondria are the major producer and source of ROS in cells, and the bulk of mitochondrial ROS is generated at the electron transport chain.Citation53 AgNPs are known to induce ROS in a variety of cancer cells, including human breast, lung, and ovarian cancer cells. The increase in the rate of ROS generation is responsible for the accumulation of ROS-associated damages in DNA, proteins, and lipids and may result in progressive cell dysfunctions including mitochondrial dysfunction. To investigate the impact of AgNPs and AgNO3 on the disruption of active mitochondria, we used JC-1 dye, which is widely used in apoptosis studies to monitor mitochondrial health. In healthy cells that have high mitochondrial membrane potential (ΔΨm), JC-1 spontaneously forms complexes known as J-aggregates that show intense red fluorescence. In contrast, in apoptotic or unhealthy cells with low ΔΨm, JC-1 remains in the monomeric form, showing only green fluorescence in higher level.Citation54 F9 cells incubated with AgNPs and AgNO3 underwent mitochondrial damage, resulting in changes in the ΔΨm. Consequently, the JC-1 monomer level was significantly increased by AgNPs, which resulted in high FITC fluorescence intensity, indicating an increased susceptibility to oxidative stress (). The percentage of JC-1 monomer-positive cells increased with AgNPs and AgNO3 exposure, compared to that of untreated cells, indicating that the ΔΨm decreased. Similarly, fluorescence microscopy analysis also showed that after AgNPs exposure, the number of JC-1 monomer-positive cells increased, indicating that ΔΨm decreased (). The ratios of JC-1 monomers to aggregates are shown in . These results confirm that AgNPs exposure enhances AgNPs-induced, mitochondrion-mediated apoptosis. The findings from this study clearly revealed that the fluorescence intensity of the red JC-1 aggregates decreased whereas the intensity of the green JC-1 monomers increased upon AgNPs treatment in F9 cells, indicating that AgNPs play a significant role in the loss of ΔΨm. Hsin et al reported that AgNPs treatment induced mitochondrial-mediated apoptosis in NIH3T3 cells via an ROS- and JNK-dependent mechanism. Previously, we found that AgNPs induced mitochondrial-mediated apoptosis in A549 cells.Citation40,Citation54,Citation55 AgNPs treatment resulted in an increase in mitochondrial depolarization accompanied with decreased levels of ATP in human lung carcinoma cells.Citation45 A previous study also suggested that nanoparticles can enter mitochondria and induce the generation of ROS, thus potentiating structural damage and eventually leading to apoptosis.Citation16
Figure 4 AgNPs-induced loss of mitochondrial membrane potential.
Notes: (A) F9 cells were treated with or without 12.5 μg/mL of AgNPs or 6.125 μM of AgNO3 for 24 h. JC-1 monomer (green) and aggregate (red) formation was measured using flow cytometry. (B) Representative fluorescence images of JC-1 monomer/aggregate formation. (C) The bar graph indicates the JC-1 monomer:JC-1 aggregate formation ratio. The results are expressed as the mean ± standard deviation of three independent experiments. There was a significant difference observed in the ratio for AgNPs- or AgNO3-treated cells compared to that for the untreated cells by the Student’s t-test (*P<0.5, and ***P<0.01).
Abbreviation: AgNPs, silver nanoparticles.
AgNPs induce apoptosis in F9 cells
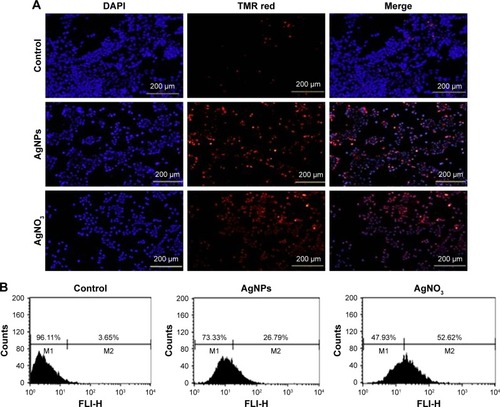
The ROS-mediated mechanism of AgNPs-induced apoptosis is important in various types of cancer cells. Excess production of ROS leads to oxidative stress and is eventually responsible for cellular and DNA damage.Citation56 DNA damage induces extracellular and intracellular signals that activate signaling pathways involved in structural, biochemical, and functional changes such as cell morphology, membrane blebbing, nuclear condensation, and DNA fragmentation, resulting in cell death.Citation57 Apoptosis can be confirmed by two factors: irregular reduction in cell size and DNA fragmentation. Therefore, to determine the effect of AgNPs and AgNO3 on apoptosis in F9 cells, a TMR red assay was performed; apoptotic cells were identified using TMR (red) fluorescence staining, and the level of apoptosis was assessed. Treatment with AgNPs and AgNO3 revealed a significant number of positively stained cells, representing apoptotic DNA fragmentation. In contrast, control groups showed fewer or no apoptotic cells (). As expected, ROS acted as signal molecules promoting oxidative DNA damage.Citation13 Several studies have supported that AgNPs can induce biochemical and molecular changes in a variety of cultured cells including THP-1 monocytes, Dalton’s lymphoma ascites cells, MDA-MB-231 human breast cancer cells, and human ovarian cancer cells.Citation13,Citation14,Citation49,Citation58 To gain further evidence for apoptosis, we determined the efficiency of AgNPs in causing apoptosis using flow cytometry. The results were consistent with those of the fluorescence microscopy; apoptosis was significantly higher in AgNPs-treated cells than in untreated cells ().
Figure 5 AgNPs-induced apoptosis in F9 cells.
Notes: (A) F9 cells were treated with or without 12.5 μg/mL of AgNPs or 6.125 μM of AgNO3 for 24 h. Then, the apoptosis of cells was assessed using the TUNEL assay; the nuclei were counterstained with DAPI. Representative images show apoptotic (fragmented) DNA (red staining) and the corresponding cell nuclei (blue staining). (B) Apoptotic efficiency was measured using flow cytometry.
Abbreviations: AgNPs, silver nanoparticles; TUNEL, terminal deoxynucleotidyl transferase dUTP nick end labeling.
AgNPs upregulate the expression of apoptotic genes and downregulate the expression of antiapoptotic genes in F9 cells
Programmed cell death/apoptosis is governed by the upregulation of proapoptotic genes (p53, p21, Bax, and caspases) and downregulation of antiapoptotic genes (Bcl-2), which are activated/deactivated by various intracellular and extracellular signals induced by AgNPs as well as by the activation of death receptors, mitochondrial responses, and caspases.Citation4,Citation59 Based on this, the mRNA expression level of certain apoptotic markers, such as p53, p21, Bax, and caspase-9 and caspase-3, and that of Bcl-2 were investigated in F9 cells by real-time qPCR analysis (). The cells were exposed to AgNPs and AgNO3 for 24 h. The relative mRNA expression levels of the assayed apoptotic markers were found to vary signifi-cantly. The levels of p53, p21, Bax, caspase-9, and caspase-3 were upregulated in the AgNPs- and AgNO3-treated cells. AgNPs are known to induce p53 expression, causing p53-dependent cell death in various types of cancer cells, including human breast and ovarian cancer cells.Citation4,Citation60 p53, a major transcription factor for the initiation of apoptosis, regulates p21, Bax, and Bcl-2 in a concentration-dependent manner.Citation60 The levels of p53, p21, Bax, caspase-9, and caspase-3 in the treated group were significantly higher than those in the control group, whereas the expression of Bcl-2 was significantly lower in the treated group than in the control. The severity of apoptosis was merely increased by interbalance of Bax and Bcl-2 expression. The mitochondrial-mediated intrinsic apoptotic pathway is activated owing to the disruption of mitochondrial membranes and eventually leads to the formation of mitochondrial pores, which is essential for the translocation of proapoptotic proteins such as Bax from the cytosol into the outer membrane of the mitochondria. The expression of Bcl-2 was modulated by AgNPs; however, significant downregulation was observed in cells treated with AgNO3 rather than AgNPs. Caspases are important factors of apoptosis, which are tightly linked to their structural makeup, and their induction plays a major role in the apoptotic pathway.Citation13,Citation60–Citation62 Higher levels of ROS in mitochondria cause impairment of outer mitochondrial membrane permeability, followed by the release of cytochrome c and procaspase-2, procaspase-3, and procaspase-9. Our findings suggest that the correlation between the upregulation of the proapoptotic genes p53, p21, Bax, and caspase-9 and caspase-3 and the downregulation of the antiapoptotic gene Bcl-2 is critical to AgNPs-induced apoptosis in F9 cells. Therefore, processes such as the induction of oxidative stress, mitochondrial damage, DNA fragmentation, and apoptosis are major regulatory mechanisms in AgNPs-induced cell death in F9 cells.
Figure 6 Effect of AgNPs on pro- and antiapoptotic gene expression.
Notes: (A) F9 cells were treated with or without 12.5 μg/mL of AgNPs or 6.125 μM of AgNO3 for 24 h, and the relative mRNA expression was analyzed by RT-qPCR. (B) Protein expression was analyzed using western blot. (C) The bar graph indicates the signal intensity ratio between control and treated groups. The results are expressed as the mean ± standard deviation of three separate experiments. The treated groups showed statistically significant differences from the control group determined using Student’s t-test (*P<0.05 and **P<0.1).
Abbreviations: AgNPs, silver nanoparticles; RT-qPCR, reverse transcription-quantitative polymerase chain reaction.
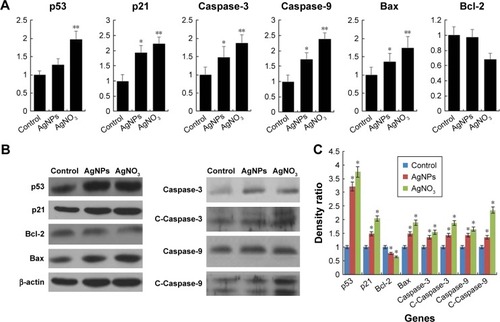
The protein expression levels of p53, p21, Bax, caspase-9 and caspase-3, and Bcl-2 in F9 cells were investigated by western blot analysis (). As expected, the expressions of p53, p21, Bax, and caspase-9 and caspase-3 were significantly higher in AgNPs- and AgNO3-treated groups than in the untreated control group, whereas the expression of Bcl-2 was significantly lower in AgNPs-treated cells. The cleavage products of caspase-9 and caspase-3 were also significantly higher in AgNPs- and AgNO3-treated cells than in untreated cells, which clearly indicate that cell death occurred in a caspase-dependent manner. Previously, we have shown that biologically synthesized AgNPs from Bacillus tequilensis and Calocybe indica induce death in human breast cancer cells in a p53-mediated caspase-3-dependent manner.Citation60 The results suggest that the increased level of caspase-9/caspase-3 in AgNPs-treated cells could contribute to cell death through apoptosis.Citation60 The expression of Bcl-2 and Bax proteins and the relative levels of the available dimerization partners shift the balance of cell fate toward either viability or death.Citation63 We demonstrated a relatively inverse relationship between Bcl-2 and Bax gene expression. A remarkable effect of both AgNPs and AgNO3 on the regulation of Bax/Bcl-2 gene expression was observed, with approximately 50% reduction of the Bax/Bcl-2 index (). Altogether, our findings suggest that a balance in the expression of these genes might be responsible for the control of apoptosis.
AgNPs induce the expression of differentiation markers and extracellular matrix (ECM) proteins
The toxicity of AgNPs is dependent on their size, shape, surface chemistry, and concentration as well as on the type of cells.Citation4 AgNPs are known to induce differentiation based on their concentration in a time-dependent manner in various types of stem cells including human adipose-derived stem cells, hMSCs, and osteoblasts.Citation64,Citation65 Previous studies have shown that internalized silica nanoparticles have no apparent deleterious effects on the morphology, proliferation, viability, and differentiation efficiency of mesenchymal stem cells.Citation66,Citation67 The findings from our study suggest that biologically prepared AgNPs seem to be less toxic than AgNO3 at tested concentrations in F9 cells. Therefore, we selected AgNPs for further analysis to demonstrate the effect of AgNPs on differentiation of F9 cells. Because differentiation therapy seems to be a positive approach for various types of cancers, to determine the effect of AgNPs on differentiation, F9 cells were treated with two different concentrations of AgNPs (3.0625 and 12.5 μg/mL). The primary indicator for the assessment of differentiation is changes in the morphological appearance of cancer cells. When F9 cells are treated with AgNPs, they differentiate into neuron-like cells; the neuronal differentiation process is accompanied by remarkable morphological changes such as neurite growth. After 24 h of exposure to AgNPs, F9 cells exhibited elongated neurite-like morphology (). Our results are in agreement with those of previous reports in which SH-SY5Y cells treated with AgNPs showed neuronal differentiation.Citation26,Citation27
Figure 7 Effect of AgNPs on expression of differentiation markers.
Notes: (A) F9 cells were treated with or without RA (1 μM) for 72 h or AgNPs (6.125 or 12.5 μg/mL) for 24 h, and differentiation was observed by phase contrast microscopy. (B) Real-time quantitative PCR was performed to analyze the expression of various neuronal differentiation markers. The results are expressed as the mean ± standard deviation of three separate experiments. The treated groups showed statistically significant differences from the control group determined using Student’s t-test (***P<0.001).
Abbreviations: AgNPs, silver nanoparticles; RA, retinoic acid; PCR, polymerase chain reaction.
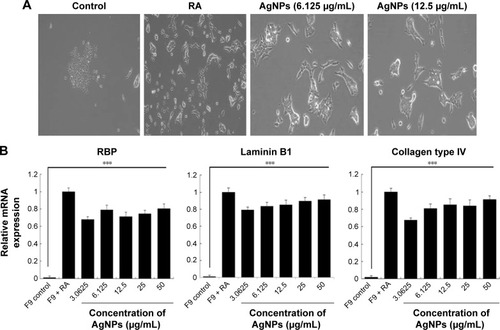
Next, we examined the expression of ECM proteins during the differentiation of F9 EC cells induced by AgNPs; we analyzed the expression of ECM components during the differentiation of F9 cells induced by RA as a positive control. We measured the expression level of three different genes involved in differentiation, that is, those encoding RBP, laminin B1, and collagen type IV. The cellular retinoic acid-binding proteins play a role in the interaction between RA and RA receptors to regulate the accessibility of RA to affect the prognosis of cancer.Citation68 ECM proteins such as collagen type IV and laminin are components of connective tissue. AgNPs-treated F9 cells showed significantly higher expression levels of RBP, collagen type IV, and laminin than the untreated group did. However, the cells treated with RA showed slightly higher expression levels of these proteins than those treated with AgNPs did (). Interestingly, AgNPs induced the expression of these differentiation markers within 24 h, whereas RA only induced similar expression level pattern after 72 h of exposure. These results suggest that ECM molecules play an important role in the morphological changes of F9 cells.
Effect of AgNPs on expression of pluripotency markers
To assess the effect of AgNPs on the proliferation of F9 cells, the cells were cultured with or without AgNPs for 24 h; once again, we used RA as the positive control. We performed qPCR to measure the levels of the pluripotency-associated genes Nanog, Oct4, and Rex1. All the tested genes were suppressed by both AgNPs and RA (). In this study, we revealed that AgNPs regulate mRNA levels through changes in mRNA expression in F9 cells. Moreover, AgNPs are able to reduce the pluripotency of F9 cells by repressing pluripotency genes, thus inducing their differentiation into ectodermal cells. AgNPs could play an important role in inducing differentiation by epigenetic modifications through alteration of the expression of genes associated with DNA methylation, histone acetylation, and histone methylation, similar to RA.Citation69 RA is known to be involved in a variety of processes during early embryonic development, including cell proliferation and differentiation and organogenesis.Citation70
Figure 8 Effect of AgNPs on expression of stem cell markers.
Notes: (A) F9 cells were treated with or without RA (1 μM) for 72 h or AgNPs (3.0625 to 50 μg/mL) for 24 h. Flow cytometry was performed to analyze the expression of the Nanog stem cell marker. (B) Real-time quantitative PCR was performed to analyze the expression of various other stem cell markers. The results are expressed as the mean ± standard deviation of three separate experiments. The treated groups showed statistically significant differences from the control group determined using the Student’s t-test (*P<0.05, **P<0.01, and ***P<0.001).
Abbreviations: AgNPs, silver nanoparticles; RA, retinoic acid; PCR, polymerase chain reaction; NS, not significant.
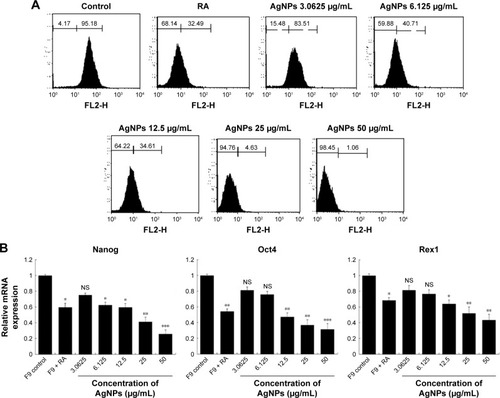
Nanog, expressed in pluripotent cells, is required for the self-renewal of mouse embryonic stem cells (mESCs) and is essential for early embryonic development.Citation71,Citation72 Nanog is a highly divergent homeodomain-containing protein commonly accorded a central position in the transcriptional network of pluripotency.Citation73–Citation76 Nanog, Sox2, and Oct3/4 are critical transcription factors involved in ESC self-renewal and differentiation and play a significant role in tumorigenesis.Citation77 Several clinical studies have shown the elevated expression of Nanog in a variety of cancers, including retinoblastoma,Citation78 prostate cancer,Citation79 and ovarian cancer, supporting our hypothesis,Citation80 Piestun et al reported that Nanog overexpression promotes the proliferation and transformation of NIH3T3 cells.Citation81 Collectively, previous studies demonstrated that the abnormal expression of Nanog in stem cells and tumor tissues plays a critical role in transformation, tumorigenicity, and metastasis. Therefore, we investigated whether the expression of Nanog changed during cell differentiation, by flow cytometry in F9 cells exposed to various concentrations of AgNPs. The results revealed that the expression of Nanog decreased significantly based on the concentration of AgNPs, compared to that in the control (), indicating that changes took place on the cell surface markers. The downregulation of Nanog upon treatment with AgNPs could facilitate the differentiation process. Nanog is expressed in pluripotent embryo cells, derivative ESCs, and the developing germline cells of mammals and birds.Citation72,Citation82–Citation84 Forced expression of Nanog is sufficient to drive the cytokine-independent self-renewal of undifferentiated ESCs.Citation82 Altogether, the results suggest that pluripotency markers such as Nanog, Oct4, and Rex1 are sensitive to AgNPs.
Cisplatin reduces the viability of F9 cells that underwent AgNPs-induced differentiation
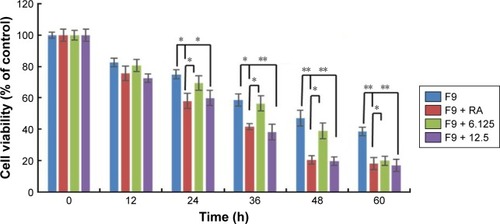
Most cancers originate from a subset of self-renewing cells, which are responsible for establishing a tumor through continuous self-renewal and differentiation. The successful elimination of differentiated cells is an important goal for the development of effective strategies to reduce the level of cancer. Chemoresistance is a critical factor in cancer treatment. Therefore, developing new approaches is essential; differentiation therapy is one such attractive new approach. To determine the effect of cisplatin on differentiated F9 cells, the cells were first treated with two different concentrations of AgNPs (12.5 and 25 μg/mL); RA (1 μM) was used as the positive control. Interestingly, both concentrations of AgNPs induced differentiation within 24 h, whereas RA-treated cells showed differentiation only after 72 h. Cisplatin (1 μM) significantly inhibited the proliferation of the differentiated F9 cells after 24-h treatment with AgNPs (). Moreover, the effect of cisplatin on the cells that underwent AgNPs- and RA-induced differentiation increased with the time of exposure, indicating that the killing effect of cisplatin is time- and dose-dependent. The severity of cancer depends on subset of self-renewing cells, primarily cancer stem cells (CSCs), which is the primary reason for chemoresistance in advanced stage of tumor through continuous self-renewal and differentiation. Therefore, elimination of CSCs is a primary factor in the development of effective strategies to achieve complete remission of cancers. Our findings suggest that AgNPs poten-tiated the effect of cisplatin on the cell viability of F9 cells, revealing that AgNPs have the capacity to resensitize cells to cisplatin cytotoxicity by directly/indirectly targeting CSCs. Hence, the data revealed that the combination of AgNPs and cisplatin could increase the anticancer efficacy against cancer stem-like cells.
Figure 9 Cisplatin reduces viability of F9 cells that underwent AgNPs-induced differentiation.
Notes: F9 cells differentiated using RA (1 μM) for 72 h or AgNPs (6.125 or 12.5 μg/mL) for 24 h were treated with or without cisplatin (1 μM) for another 24 h, and then cell viability was measured. The results are expressed as the mean ± standard deviation of three separate experiments. The treated groups showed statistically significant differences from the control group determined using Student’s t-test (*P<0.05 and **P<0.01).
Abbreviations: AgNPs, silver nanoparticles; RA, retinoic acid.
Cisplatin reduces AgNPs-induced expression of various differentiation markers in F9 cells
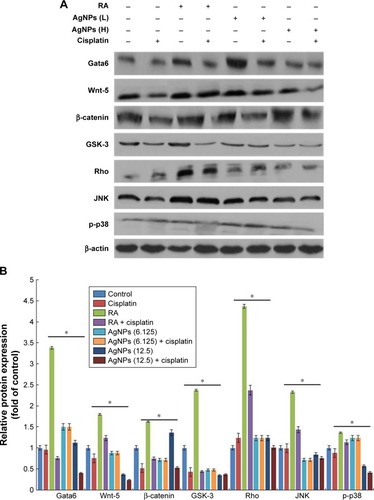
The effect of cisplatin on several AgNPs-induced differentiation markers, including Gata6, Wnt-5, β-catenin, GSK-3, Rho, JNK, and p-p38, was investigated. Several intrinsic factors such as Gata4, Gata6, and Brachyury are a subset of transcription factors capable of inducing cellular reprograming and are critical for the early stages of differentiation to primitive endoderm and mesendoderm lineages.Citation85 The F9 cells were treated with RA plus AgNPs at low (6.125 μg/mL) and high concentrations (12.5 μg/mL). Cells treated with AgNPs showed significantly higher expression of Gata6 compared to RA-treated cells, whereas F9 cells treated with RA and AgNPs at low and high concentrations plus cisplatin showed reduced expression of Gata6, which clearly indicates that cisplatin inhibits differentiation process by modulating Gata6 expression (). The intensity of expression of various markers is shown in . Recently, Wamaitha et al reported that Gata6 is a multipurpose and potent reprograming factor, and Gata4 expression is uniquely sufficient to induce rapid reprograming of mESCs to induced embryonic endoderm stem cells.Citation86 Several members of the Wnt gene family are expressed in very specific patterns in the embryonic mesoderm and have been involved in the regulation of hematopoiesis.Citation87,Citation88 Wnt5 signaling is critical for regulating normal developmental processes, including stem cell self-renewal, proliferation, differentiation, migration, adhesion, and polarity.Citation89,Citation90 Wnt factors are a group of these signaling molecules that act on stem cells within the stem cell niche to help maintain their capacity for self-renewal, and they can activate the β-catenin-dependent pathway.Citation91,Citation92 Similar to those of previous studies, our findings suggest that F9 cells treated with RA or AgNPs showed upregulation of Wnt5 expression, whereas F9 cells treated with RA or AgNPs in the presence of cisplatin showed reduced expression levels of Wnt5 and Gata6, which confirms that cisplatin inhibits the AgNPs-induced differentiation process via Wnt5 signaling. Yang et al reported that Wnt5a is involved in the endothelial differentiation of ESCs via both Wnt/β-catenin and PKC signaling pathways and regulates embryonic vascular development.Citation93 Rho GTPases are involved in the self-renewal, multipotential differentiation ability, migration, and adhesion of stem cells.Citation94 In this study, F9 cells treated with RA or AgNPs showed upregulation of Rho expression, whereas the cells treated with RA or AgNPs plus cisplatin exhibited reduced expression of Rho, which confirms that cisplatin inhibits the AgNPs-induced Rho activation of differentiation in F9 cells. Rho kinase is known to be involved in RhoA-induced cellular responses, including cytoskeletal rearrangement and smooth muscle cell differentiation.Citation95,Citation96 The JNK is a member of the MAPK group of signaling proteins.Citation97 JNK is not required for the proliferation or self-renewal of ESCs, but it is required for their differentiation.Citation97 Genome-wide location analysis revealed that JNK could bind to a large set of active promoters during the differentiation of stem cells into neurons.Citation98 Binétruy et al reported that the MAPK pathways, such as the Erk, JNK, and p38 MAPK pathways, are involved in the regulation of differentiation of ESCs into mature cells.Citation99 p38 MAPK is activated in established megakaryocytic cell lines and is involved in erythroid differentiation.Citation100 Here, the tested MAPKs, namely JNK and p38, were upregulated in the F9 cells treated with RA, as well as in cells treated with low and high concentration of AgNPs, whereas the cells treated in the presence of cisplatin showed diminished expression levels of both JNK and p38. Altogether, these findings suggest that cisplatin inhibits AgNPs-induced expression of Gata6, Wnt-5, β-catenin, GSK-3, Rho, JNK, and p-p38 and eventually induces differentiation process. However, cisplatin is able to reduce the expression of differentiation markers induced by AgNPs.
Figure 10 Role of cisplatin in AgNPs-induced expression of differentiation markers.
Notes: (A) F9 cells differentiated using RA (1 μM) for 72 h or AgNPs (6.125 or 12.5 μg/mL) for 24 h were treated with or without cisplatin (1 μM) for another 24 h, and then the expression of various proteins involved in differentiation was analyzed using western blot. Results were normalized to β-actin. The results are expressed as the mean ± standard deviation of three separate experiments. (B) The bar graph indicates the signal intensity ratio between control and treated groups. The treated groups showed statistically significant differences from the control group determined using Student’s t-test (*P<0.05). L, represents low concentration of AgNPs, H, represents high concentration of AgNPs.
Abbreviations: AgNPs, silver nanoparticles; RA, retinoic acid.
Inhibitory effect of cisplatin on AgNPs-modulated cell proliferation markers in F9 cells
Cell proliferation and differentiation show a remarkable inverse relationship, and differentiation usually coincides with proliferation arrest and permanent exit from the division cycle.Citation101 The loss of differentiation can lead to a variety of diseases and is a hallmark of cancer cells. Therefore, we examined the expression of various markers involved in proliferation in the presence and absence of cisplatin, because cisplatin is known to inhibit proliferation in a variety of cancer cells. We examined the status of EGFR activation or deactivation in the presence of low and high concentrations of AgNPs, with cisplatin and without cisplatin. Signal transduction is the primary mechanism through which cells recognize and respond to an external stimulus. EGF and its corresponding receptor family have well-documented responses ranging from proliferation and survival to wound healing and migration.Citation31,Citation33 This is accomplished by activation of the EGFR signal transduction network through phosphorylation or dephosphorylation of downstream signaling targets such as PI3K/Akt and the Ras/Erk cascades.Citation102 Similarly, Erk activation has been shown to control proliferation, regulation of mitosis, and cell differentiation.Citation36 The F9 cells treated with RA or low and high concentrations of AgNPs showed increased total EGFR levels, whereas in the presence of cisplatin, the total EGFR was reduced. The phosphorylation status of EGFR significantly reduced in all tested samples, except with the high-concentration AgNPs. The status of Erk in F9 cells treated with RA showed increased basal levels of Erk, and no difference was observed between RA- and RA-plus-cisplatin-treated samples. The expression levels of total Erk and p-Erk were significantly reduced in both the cells treated with low and high concentration of AgNPs in the presence and absence of cisplatin, indicating that AgNPs play a critical role in the maintenance of the expression of Erk in cellular biological functions (). However, no significant changes were observed in the level of Erk in AgNPs-treated cells. The intensity of expression of various proliferation markers is shown in . Interestingly, in the presence of cisplatin, the expression levels of all tested proliferation markers were significantly reduced. Human keratinocyte HaCaT cells exposed to AgNPs produced higher levels of ROS and disrupted EGF signaling, ultimately resulting in attenuated levels of Akt and Erk phosphorylation;Citation34 therefore, disruption of signaling pathways depends on the size and metallic composition of the nanoparticles.
Figure 11 Role of cisplatin in AgNPs-modulated expression of proteins of various proliferation markers.
Notes: (A) F9 cells differentiated using RA (1 μM) for 72 h or AgNPs (6.125 or 12.5 μg/mL) for 24 h were treated with or without cisplatin (1 μM) for 24 h, and then the expression of various proteins involved in proliferation was analyzed using western blot. Results were normalized to β-actin. The results are expressed as the mean ± standard deviation of three separate experiments. (B) The bar graph indicates the signal intensity ratio between control and treated groups. The treated groups showed statistically significant differences from the control group determined using Student’s t-test (*P<0.05). L, represents low concentration of AgNPs, H, represents high concentration of AgNPs.
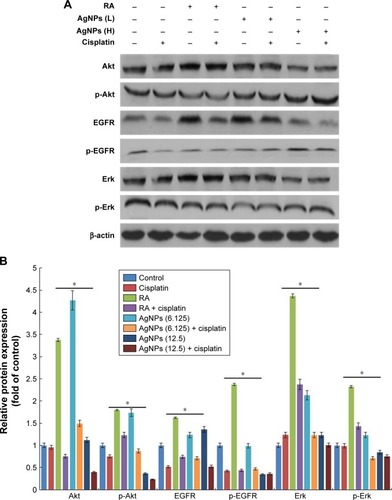
The primary aim of this experiment was to explore the effect of two different concentrations of AgNPs on various signaling molecules, and their interference in cellular perturbation was assessed through phosphorylation. The F9 cells were treated with RA or low and high concentrations of AgNPs in the presence of cisplatin, which is known to inhibit the proliferation of a variety of cancer cells. Akt kinases are involved in a variety of cellular processes including cell proliferation, survival, change in size, response to nutrient availability, tissue invasion, and angiogenesis.Citation103 The F9 cells treated with RA showed upregulation of both Akt and p-Akt, whereas cells treated with low and high concentrations of AgNPs exhibited no significant difference in the expression of total Akt. Interestingly, in the cells treated with cisplatin, the expression level of Akt was unaffected; however, the level of p-Akt was slightly higher in RA-treated cells than in untreated cells. When the F9 cells were treated with low and high concentrations of AgNPs, the expression of total Akt was not significantly affected; however, when the cells were treated with low and high concentrations of AgNPs plus cisplatin, the total Akt expression was significantly reduced. The data suggest that AgNPs at concentrations of 12.5 and 25 μg/mL increase the phosphorylation of Akt, compared to that in untreated cells; however, in the presence of cisplatin, the phosphorylation of Akt is significantly reduced (). The results clearly confirm that AgNPs play a critical role in the phosphorylation of Akt, which ultimately modulates the differentiation versus proliferation process. Glial cell line-derived neurotrophic factor promotes SSC proliferation in vitro via the SFK/PI3K/Akt pathway, which leads to the upregulation of N-myc.Citation104 Bovine retinal endothelial cells treated with AgNPs with an average size of 50 nm showed reduced level of Akt phosphorylation, leading to inhibition of cell viability.Citation105,Citation106 Braydich-Stolle et alCitation32 reported that at concentrations of 10 μg/mL and above, AgNPs induced a significant decline in SSC proliferation, which was also dependent on their size and coating. Comfort et alCitation33 reported that AgNPs inhibited both p-Akt and p-Erk by approximately 20% via EGFR-dependent phosphorylation in human epithelial A-431 cells. In contrast, chronic exposure of HaCaT cells to AgNPs revealed higher levels of phosphorylation states for both Akt and Erk.Citation34 The increase or decrease of cell proliferation via Akt phosphorylation depends on the size, shape, and surface coating of AgNPs. Collectively, these findings suggest that AgNPs play an important role in the differentiation process by modulating cell survival kinases by decreasing/increasing the expression of Akt, EGFR, and Erk. Furthermore, in the presence of cisplatin, the expression of survival proteins including total Akt, EGFR, and Erk is significantly reduced, which could favor the differentiation process by decreasing the proliferation process in F9 cells. Therefore, AgNPs could be suitable agents for both differentiation and inhibition of cell viability; however, all these events occur in a concentration-dependent manner.
Conclusion
AgNPs can be used in various biomedical applications, including antibacterial, anticancer, antiangiogenic, and anti-inflammatory agents, owing to their unique physical and chemical properties. In this study, we investigated the mechanism by which AgNPs exhibit cytotoxicity and regulate stem cell differentiation for therapeutic purposes. We prepared AgNPs, using a biological system as a template, and then characterized them using various analytical techniques. The synthesized AgNPs were spherical in shape with an average size of 20 nm. The AgNPs potentially induced apoptosis by regulating various cellular mechanisms, including the reduction of cell viability by increasing LDH and ROS levels, loss of ΔΨm, upregulation of the proapoptotic genes p53, p21, Bax, and caspase-9 and caspase-3, and down-regulation of the antiapoptotic gene Bcl-2. Interestingly, the AgNPs induced neuronal differentiation by upregulating various biomarkers involved in differentiation, such as RBP, laminin B1, and collagen type IV, and downregulating various pluripotency markers, including Nanog, Sox2, and Oct3/4, which are critical transcription factors involved in self-renewal and differentiation. AgNPs could regulate both apoptosis and differentiation by modulating various signaling molecules in a concentration-dependent manner. Furthermore, the viability of cells that underwent AgNPs-induced differentiation was remarkably inhibited by cisplatin. Altogether, these results suggest that in cancer chemotherapeutic regimens, AgNPs can promote apoptosis and tumor cell differentiation in a concentration-dependent manner. These mechanistic studies of AgNPs signaling continue to suggest novel drug targets and will improve the therapeutic strategies for cancer and other neurodegenerative diseases. Our emerging knowledge of these molecular mechanisms could provide a rational basis for understanding the role of AgNPs in cancer therapy both as cytotoxic and neuronal differentiation-inducing agents for developing cytotoxicity-or differentiation-based cancer chemotherapies that could further support the potential therapeutic value of AgNPs for cancer.
Acknowledgments
This work was supported by WTU Joint Research Grants of Konkuk University.
Disclosure
The authors report no conflicts of interest in this work.
References
- ChenXSchluesenerHJNanosilver: a nanoproduct in medical applicationToxicol Lett2008176111218022772
- GeLLiQWangMOuyangJLiXXingMMNanosilver particles in medical applications: synthesis, performance, and toxicityInt J Nanomedicine201492399240724876773
- GurunathanSKalishwaralalKVaidyanathanRBiosynthesis, purification and characterization of silver nanoparticles using Escherichia coliColloids Surf B Biointerfaces200974132833519716685
- ZhangXFGurunathanSCombination of salinomycin and silver nanoparticles enhances apoptosis and autophagy in human ovarian cancer cells: an effective anticancer therapyInt J Nanomedicine2016113655367527536105
- ShinSHYeMKKimHSKangHSThe effects of nanosilver on the proliferation and cytokine expression by peripheral blood mononuclear cellsInt Immunopharmacol20077131813181817996693
- ParkSLeeYKJungMCellular toxicity of various inhalable metal nanoparticles on human alveolar epithelial cellsInhal Toxicol200719Suppl 1596517886052
- HanJWGurunathanSJeongJKOxidative stress mediated cytotoxicity of biologically synthesized silver nanoparticles in human lung epithelial adenocarcinoma cell lineNanoscale Res Lett20149145925242904
- SotoKGarzaKMMurrLECytotoxic effects of aggregated nanomaterialsActa Biomater20073335135817275430
- HussainSMHessKLGearhartJMGeissKTSchlagerJJIn vitro toxicity of nanoparticles in BRL 3A rat liver cellsToxicol In Vitro200519797598316125895
- ZhangXFChoiYJHanJWDifferential nanoreprotoxicity of silver nanoparticles in male somatic cells and spermatogonial stem cellsInt J Nanomedicine2015101335135725733828
- HanJWJeongJKGurunathanSMale- and female-derived somatic and germ cell-specific toxicity of silver nanoparticles in mouseNanotoxicology201610336137326470004
- HussainSMJavorinaAKSchrandAMDuhartHMAliSFSchlagerJJThe interaction of manganese nanoparticles with PC-12 cells induces dopamine depletionToxicol Sci200692245646316714391
- GurunathanSHanJWEppakayalaVJeyarajMKimJHCytotoxicity of biologically synthesized silver nanoparticles in MDA-MB-231 human breast cancer cellsBiomed Res Int2013201353579623936814
- GurunathanSHanJWParkJHReduced graphene oxide-silver nanoparticle nanocomposite: a potential anticancer nanotherapyInt J Nanomedicine2015106257627626491296
- KoneBCKaletaMGullansSRSilver ion (Ag+)-induced increases in cell membrane K+ and Na+ permeability in the renal proximal tubule: reversal by thiol reagentsJ Membr Biol1988102111192456393
- CarlsonCHussainSMSchrandAMUnique cellular interaction of silver nanoparticles: size-dependent generation of reactive oxygen speciesJ Phys Chem B200811243136081361918831567
- GreulichCDiendorfJSimonTEggelerGEppleMKöllerMUptake and intracellular distribution of silver nanoparticles in human mesenchymal stem cellsActa Biomater20117134735420709196
- ParkMVNeighAMVermeulenJPThe effect of particle size on the cytotoxicity, inflammation, developmental toxicity and genotoxicity of silver nanoparticlesBiomaterials201132369810981721944826
- YanMLiuQDifferentiation therapy: a promising strategy for cancer treatmentChin J Cancer201635326739838
- MurakamiSTashiroFProspects of differentiation therapy for cancer stem cellsAdv Tech Biol Med20153144
- QinHZhuCAnZSilver nanoparticles promote osteogenic differentiation of human urine-derived stem cells at noncytotoxic concentrationsInt J Nanomedicine201492469247824899804
- XuYWangLBaiRZhangTChenCSilver nanoparticles impede phorbol myristate acetate-induced monocyte-macrophage differentiation and autophagyNanoscale2015738161001610926372376
- ZhengZYinWZaraJNThe use of BMP-2 coupled – nanosilver-PLGA composite grafts to induce bone repair in grossly infected segmental defectsBiomaterials201031359293930020864167
- LiuYZhengZZaraJNThe antimicrobial and osteoinductive properties of silver nanoparticle/poly(DL-lactic-co-glycolic acid)-coated stainless steelBiomaterials201233348745875622959466
- LiuXHeWFangZKienzleAFengQInfluence of silver nanoparticles on osteogenic differentiation of human mesenchymal stem cellsJ Biomed Nanotechnol20141071277128524804548
- DayemAAKimBGurunathanSBiologically synthesized silver nanoparticles induce neuronal differentiation of SH-SY5Y cells via modulation of reactive oxygen species, phosphatases, and kinase signaling pathwaysBiotechnol J20149793494324827677
- AlonNMiroshnikovYPerkasNNissanIGedankenAShefiOSubstrates coated with silver nanoparticles as a neuronal regenerative materialInt J Nanomedicine20149Suppl 1233124872701
- YuanTCVeeramaniSLinFFAndrogen deprivation induces human prostate epithelial neuroendocrine differentiation of androgen-sensitive LNCaP cellsEndocr Relat Cancer200613115116716601285
- ValentiniABiancolellaMAmatiFValproic acid induces neuroendocrine differentiation and UGT2B7 up-regulation in human prostate carcinoma cell lineDrug Metab Dispos200735696897217371798
- MartinGSCell signaling and cancerCancer Cell20034316717414522250
- WarrenCMLandgrafRSignaling through ERBB receptors: multiple layers of diversity and controlCell Signal200618792393316460914
- Braydich-StolleLKLucasBSchrandASilver nanoparticles disrupt GDNF/Fyn kinase signaling in spermatogonial stem cellsToxicol Sci2010116257758920488942
- ComfortKKMaurerEIBraydich-StolleLKHussainSMInterference of silver, gold, and iron oxide nanoparticles on epidermal growth factor signal transduction in epithelial cellsACS Nano2011512100001000822070748
- ComfortKKMaurerEIHussainSMSlow release of ions from internalized silver nanoparticles modifies the epidermal growth factor signaling responseColloids Surf B Biointerfaces201412313614225260222
- NicholsonKMAndersonNGThe protein kinase B/Akt signalling pathway in human malignancyCell Signal200214538139511882383
- WortzelISegerRThe ERK cascade: distinct functions within various subcellular organellesGenes Cancer20112319520921779493
- GaoPMalbonCCDifferentiation of F9 teratocarcinoma stem cells to primitive endoderm is regulated by the Gialpha2/Gsalpha axis via phospholipase C and not adenylylcyclaseJ Biol Chem19962714830692306988940046
- SastryMMayyaKSBandyopadhyayKpH dependent changes in the optical properties of carboxylic acid derivatized silver colloidal particlesColloids Surf A Physicochem Eng Asp19971271–3221228
- SastryMPatilVSainkarSRElectrostatically controlled diffusion of carboxylic acid derivatized silver colloidal particles in thermally evaporated fatty amine filmsJ Phys Chem B1998102814041410
- GurunathanSJeongJKHanJWZhangXFParkJHKimJHMultidimensional effects of biologically synthesized silver nanoparticles in Helicobacter pylori, Helicobacter felis, and human lung (L132) and lung carcinoma A549 cellsNanoscale Res Lett2015103525852332
- JyotiKBaunthiyalMSinghACharacterization of silver nanoparticles synthesized using Urtica dioica Linn. leaves and their synergistic effects with antibioticsJ Radiat Res Appl Sci201693217227
- KalimuthuKSuresh BabuRVenkataramanDBilalMGurunathanSBiosynthesis of silver nanocrystals by Bacillus licheniformisColloids Surf B Biointerfaces200865115015318406112
- JainDKachhwahaSJainRSrivastavaGKothariSLNovel microbial route to synthesize silver nanoparticles using spore crystal mixture of Bacillus thuringiensisIndian J Exp Biol201048111152115621117457
- KaviyaSSanthanalakshmiJViswanathanBMuthumaryJSrinivasanKBiosynthesis of silver nanoparticles using citrus sinensis peel extract and its antibacterial activitySpectrochim Acta A Mol Biomol Spectrosc201179359459821536485
- GovenderRPhulukdareeAGenganRMAnandKChuturgoonAASilver nanoparticles of Albizia adianthifolia: the induction of apoptosis in human lung carcinoma cell lineJ Nanobiotechnology201311523418790
- CastiglioniSCazzanigaAPerrottaCMaierJASilver nanoparticles-induced cytotoxicity requires ERK activation in human bladder carcinoma cellsToxicol Lett2015237323724326149761
- FilomeniGDe ZioDCecconiFOxidative stress and autophagy: the clash between damage and metabolic needsCell Death Differ201522337738825257172
- ChenXZhongZXuZChenLWangY2′,7′-Dichlorodi hydrofluorescein as a fluorescent probe for reactive oxygen species measurement: forty years of application and controversyFree Radic Res201044658760420370560
- SriramMIKanthSBKalishwaralalKGurunathanSAntitumor activity of silver nanoparticles in Dalton’s lymphoma ascites tumor modelInt J Nanomedicine2010575376221042421
- ParkEJYiJKimYChoiKParkKSilver nanoparticles induce cytotoxicity by a Trojan-horse type mechanismToxicol In Vitro201024387287819969064
- AvalosAHazaAIMateoDMoralesPCytotoxicity and ROS production of manufactured silver nanoparticles of different sizes in hepatoma and leukemia cellsJ Appl Toxicol201434441342324243578
- KroemerGReedJCMitochondrial control of cell deathNat Med20006551351910802706
- SuzukiNKoussevitzkySMittlerRMillerGROS and redox signalling in the response of plants to abiotic stressPlant Cell Environ201235225927021486305
- JeongJKGurunathanSKangMHHypoxia-mediated autophagic flux inhibits silver nanoparticle-triggered apoptosis in human lung cancer cellsSci Rep201662168826867977
- HsinYHChenCFHuangSShihTSLaiPSChuehPJThe apoptotic effect of nanosilver is mediated by a ROS- and JNK-dependent mechanism involving the mitochondrial pathway in NIH3T3 cellsToxicol Lett2008179313013918547751
- RisomLMøllerPLoftSOxidative stress-induced DNA damage by particulate air pollutionMutat Res20055921–211913716085126
- JohnsonNLGardnerAMDienerKMSignal transduction pathways regulated by mitogen-activated/extracellular response kinase kinase kinase induce cell deathJ Biol Chem19962716322932378621725
- FoldbjergROlesenPHougaardMDangDAHoffmannHJAutrupHPVP-coated silver nanoparticles and silver ions induce reactive oxygen species, apoptosis and necrosis in THP-1 monocytesToxicol Lett2009190215616219607894
- ShinyPJMukherjeeAChandrasekaranNDNA damage and mitochondria-mediated apoptosis of A549 lung carcinoma cells induced by biosynthesised silver and platinum nanoparticlesRSC Adv20166332777527787
- GurunathanSParkJHHanJWKimJHComparative assessment of the apoptotic potential of silver nanoparticles synthesized by Bacillus tequilensis and Calocybe indica in MDA-MB-231 human breast cancer cells: targeting p53 for anticancer therapyInt J Nanomedicine2015104203422226170659
- JänickeRUSprengartMLWatiMRPorterAGCaspase-3 is required for DNA fragmentation and morphological changes associated with apoptosisJ Biol Chem199827316935793609545256
- GopinathPGogoiSKSanpuiPPaulAChattopadhyayAGhoshSSSignaling gene cascade in silver nanoparticle induced apoptosisColloids Surf B Biointerfaces201077224024520197232
- DziedzicAKubinaRBułdakRJSkoniecznaMCholewaKSilver nanoparticles exhibit the dose-dependent anti-proliferative effect against human squamous carcinoma cells attenuated in the presence of berberineMolecules201621336526999092
- SambergMELoboaEGOldenburgSJMonteiro-RiviereNASilver nanoparticles do not influence stem cell differentiation but cause minimal toxicityNanomedicine (Lond)2012781197120922583572
- PaukschLHartmannSSzalayGAltVLipsKSIn vitro assessment of nanosilver-functionalized PMMA bone cement on primary human mesenchymal stem cells and osteoblastsPLoS One2014912e11474025485700
- HuangDMChungTHHungYInternalization of mesoporous silica nanoparticles induces transient but not sufficient osteogenic signals in human mesenchymal stem cellsToxicol Appl Pharmacol2008231220821518519141
- ChungTHWuSHYaoMThe effect of surface charge on the uptake and biological function of mesoporous silica nanoparticles in 3T3-L1 cells and human mesenchymal stem cellsBiomaterials200728192959296617397919
- CollinsCAWattFMDynamic regulation of retinoic acid-binding proteins in developing, adult and neoplastic skin reveals roles for beta-catenin and Notch signallingDev Biol20083241556718805411
- ZhangJGaoYYuMRetinoic acid induces embryonic stem cell differentiation by altering both encoding RNA and microRNA expressionPLoS One2015107e132566
- WendlingOGhyselinckNBChambonPMarkMRoles of retinoic acid receptors in early embryonic morphogenesis and hindbrain patterningDevelopment2001128112031203811493525
- YoungRAControl of the embryonic stem cell stateCell2011144694095421414485
- MitsuiKTokuzawaYItohHThe homeoprotein Nanog is required for maintenance of pluripotency in mouse epiblast and ES cellsCell2003113563164212787504
- ColeMFJohnstoneSENewmanJJKageyMHYoungRATcf3 is an integral component of the core regulatory circuitry of embryonic stem cellsGene Dev200822674675518347094
- BoyerLALeeTIColeMFCore transcriptional regulatory circuitry in human embryonic stem cellsCell2005122694795616153702
- LohYHWuQChewJLThe Oct4 and Nanog transcription network regulates pluripotency in mouse embryonic stem cellsNat Genet200638443144016518401
- WangJRaoSChuJA protein interaction network for pluripotency of embryonic stem cellsNature2006444711736436817093407
- Okumura-NakanishiSSaitoMNiwaHIshikawaFOct-3/4 and Sox2 regulate Oct-3/4 gene in embryonic stem cellsJ Biol Chem200528075307531715557334
- SeigelGMHackamASGangulyAMandellLMGonzalez-FernandezFHuman embryonic and neuronal stem cell markers in retinoblastomaMol Vis20071382383217615543
- BaeKMSuZFryeCExpression of pluripotent stem cell reprogramming factors by prostate tumor initiating cellsJ Urol201018352045205320303530
- BapatSAMaliAMKoppikarCBKurreyNKStem and progenitor-like cells contribute to the aggressive behavior of human epithelial ovarian cancerCancer Res20056583025302915833827
- PiestunDKochupurakkalBSJacob-HirschJNanog transforms NIH3T3 cells and targets cell-type restricted genesBiochem Biophys Res Commun2006343127928516540082
- ChambersIColbyDRobertsonMFunctional expression cloning of Nanog, a pluripotency sustaining factor in embryonic stem cellsCell2003113564365512787505
- LavialFAcloqueHBertocchiniFThe Oct4 homologue PouV and Nanog regulate pluripotency in chicken embryonic stem cellsDevelopment2007134193549356317827181
- YamaguchiSKimuraHTadaMNakatsujiNTadaTNanog expression in mouse germ cell developmentGene Expr Patterns20055563964615939376
- NagyAVinterstenKMurine embryonic stem cellsMethods Enzymol200641832117141026
- WamaithaSEdel ValleIChoLTGata6 potently initiates reprograming of pluripotent and differentiated cells to extraembryonic endoderm stem cellsGene Dev201529121239125526109048
- AustinTWSolarGPZieglerFCLiemLMatthewsWA role for the Wnt gene family in hematopoiesis: expansion of multilineage progenitor cellsBlood19978910362436359160667
- Van Den BergDJSharmaAKBrunoEHoffmanRRole of members of the Wnt gene family in human hematopoiesisBlood1998929318932029787155
- WillertKBrownJDDanenbergEWnt proteins are lipid-modified and can act as stem cell growth factorsNature2003423693844845212717451
- ZhouYKippsTJZhangSWnt5a signaling in normal and cancer stem cellsStem Cells Int20172017529528628491097
- MoonRTBowermanBBoutrosMPerrimonNThe promise and perils of Wnt signaling through beta-cateninScience200229655731644164612040179
- ZhouHMakPYMuHCombined inhibition of β-catenin and Bcr-Abl synergistically targets tyrosine kinase inhibitor-resistant blast crisis chronic myeloid leukemia blasts and progenitors in vitro and in vivoLeukemia Epub2017418
- YangDHYoonJYLeeSHWnt5a is required for endothelial differentiation of embryonic stem cells and vascularization via pathways involving both Wnt/beta-catenin and protein kinase CalphaCirc Res2009104337237919096028
- NayakRCChangKHVaitinadinNSCancelasJARho GTPases control specific cytoskeleton-dependent functions of hematopoietic stem cellsImmunol Rev2013256125526824117826
- ChenCWMontelaticiECrisanMPerivascular multi-lineage progenitor cells in human organs: regenerative units, cytokine sources or both?Cytokine Growth Factor Rev2009205–642943419926515
- MianoJMLongXFujiwaraKSerum response factor: master regulator of the actin cytoskeleton and contractile apparatusAm J Physiol Cell Physiol20072921C70C8116928770
- XuPDavisRJc-Jun NH(2)-terminal kinase is required for lineage-specific differentiation but not stem cell self-renewalMol Cell Biol20103061329134020065035
- TiwariVKStadlerMBWirbelauerCParoRSchübelerDBeiselCA chromatin-modifying function of JNK during stem cell differentiationNat Genet20114419410022179133
- BinétruyBHeasleyLBostFCaronLAouadiMConcise review: regulation of embryonic stem cell lineage commitment by mitogen-activated protein kinasesStem Cells20072551090109517218395
- MiyazakiROgataHKobayashiYRequirement of thrombopoietin-induced activation of ERK for megakaryocyte differentiation and of p38 for erythroid differentiationAnn Hematol200180528429111446731
- RuijtenbergSvan den HeuvelSCoordinating cell proliferation and differentiation: antagonism between cell cycle regulators and cell type-specific gene expressionCell Cycle201615219621226825227
- HensonESGibsonSBSurviving cell death through epidermal growth factor (EGF) signal transduction pathways: implications for cancer therapyCell Signal200618122089209716815674
- AltomareDATestaJRPerturbations of the AKT signaling pathway in human cancerOncogene200524507455746416288292
- Braydich-StolleLKosterevaNDymMHofmannMCRole of Src family kinases and N-Myc in spermatogonial stem cell proliferationDev Biol20073041344517222400
- GurunathanSLeeKJKalishwaralalKSheikpranbabuSVaidyanathanREomSHAntiangiogenic properties of silver nanoparticlesBiomaterials200930316341635019698986
- KalishwaralalKBanumathiERam Kumar PandianSSilver nanoparticles inhibit VEGF induced cell proliferation and migration in bovine retinal endothelial cellsColloids Surf B Biointerfaces2009731515719481908