
Abstract
The highly invasive nature of glioblastoma is one of the most significant problems regarding the treatment of this tumor. Diamond nanoparticles (ND), graphite nanoparticles (NG), and graphene oxide nanoplatelets (nGO) have been explored for their biomedical applications, especially for drug delivery. The objective of this research was to assess changes in the adhesion, migration, and invasiveness of two glioblastoma cell lines, U87 and U118, after ND, NG, and nGO treatment. All treatments affected the cell surface structure, adhesion-dependent EGFR/AKT/mTOR, and β-catenin signaling pathways, decreasing the migration and invasiveness of both glioblastoma cell lines. The examined nanoparticles did not show strong toxicity but effectively deregulated cell migration. ND was effectively taken up by cells, whereas nGO and NG strongly interacted with the cell surface. These results indicate that nanoparticles could be used in biomedical applications as a low toxicity active compound for glioblastoma treatment.
Introduction
Glioblastoma is one of the most common malignant tumors of the central nervous system with an average life expectancy of only 6 months to 2 years.Citation1 This prognosis results from high tumor malignancy, an invasive phenotype, and the absence of an effective therapy. The ability of glioblastoma cells to undergo migration and invasion allows them to infiltrate brain tissue, while rarely undergoing extracranial metastasis.Citation2 Glioblastoma infiltrates surrounding brain tissue and therefore cannot be fully removed by surgical resection.
Cell motility is a process based on the dynamic properties of the actin cytoskeleton. Glioblastoma cells have a complex actin cytoskeleton-related cell surface morphology with abundant membrane folds, microvilli, and filopodia, which play a role in its invasive phenotype.Citation3 Cell migration begins with polymerization of actin filaments and extending lamellipodia and filopodia protrusions of the cell membrane.Citation4 Protrusions are stabilized by focal adhesions and actin cytoskeleton in the form of stress fibers. Adhesion of tumor cells to extracellular matrix and extracellular sensing plays an important role in cell motility.Citation5,Citation6 Migration of tumor cells is regulated by various signaling pathways, including the EGFR/AKT/mTOR and β-catenin signaling pathways.Citation7 Activation of those signaling pathways is also important in promoting tumor development, metastasis, and resistance to cancer therapies.Citation8,Citation9 Glioblastoma tumors commonly have mutations in PTEN, which are the most common genetic changes found in human cancers.Citation10 PTEN inhibits the AKT signaling pathway, thus glioblastoma cells that have mutations in PTEN show constant activation of EGFR/AKT/mTOR signaling pathway.Citation11
Carbon nanoparticles have been explored for biomedical applications and are considered a possible choice as a low toxicity tumor therapy or drug delivery strategy. Diamond nanoparticles (ND), graphite nanoparticles (NG), and graphene oxide nanoplatelets (nGO) are carbon allotropes that, although similar in size, have different physical properties. ND has carbon atoms in spCitation3 hybridization, whereas NG and nGO have carbon atoms in the spCitation2 hexagonal pattern. However, nGO has a unique thickness to surface area ratio, which distinguishes this material from both ND and NG. Carbon nanoparticles can bind to the plasma membrane, where they can interfere with surface proteins, including receptors, and become endocytosed.Citation12–Citation16 This suggests that carbon nanoparticles, although not directly toxic, can influence cell activity. Despite low toxicity, ND have been shown to inhibit the growth of new blood vessels, hence reducing the development of glioblastoma tumors,Citation13,Citation17,Citation18 suggesting reduction of cell migration.
In the present study, we hypothesized that ND, NG, and nGO can change abilities of glioblastoma cells to adhere to extracellular matrix, decreasing migration and invasiveness. We investigated endocytosis of nanoparticles, cell ultrastructure, adhesion-dependent EGFR/AKT/mTOR, and β-catenin signaling of two glioblastoma cell lines, U87 and U118.
Materials and methods
Nanomaterials
ND and NG were purchased from SkySpring Nanomaterials (Houston, TX, USA). nGO were obtained from the Institute of Electronic Materials Technology through a modified Hummers method from NG as previously described.Citation19 The nanopowders were dispersed in ultrapure water to prepare a 1.0 mg/mL solution. Immediately prior to exposure to cells, hydrocolloids of nanoparticles were sonicated for 30 min and diluted to different concentrations with supplemented Dulbecco’s Modified Eagle’s culture Medium (DMEM, Thermo Fisher Scientific, Waltham, MA, USA).
Transmission electron microscopy (TEM) images of nanoparticles were acquired with a JEM-1220 microscope (JEOL, Tokyo, Japan) at 80 kV, with a Morada 11 megapixel camera (Olympus Soft Imaging Solutions, Münster, Germany) (Figure S1). Samples were prepared by placing droplets of hydrocolloids onto formvar-coated copper grids (Agar Scientific Ltd, Stansted, UK) and air dried before observations.
Zeta potential measurements were carried out with Nano-ZS90 Zetasizer (Malvern Instruments, Malvern, UK) at 25°C, using the Smoluchowski approximation. Each sample was measured after 120 s of stabilization at 25°C (20 replicates). Hydrodynamic diameter of nanoparticles in water was measured with dynamic light scattering (DLS) using a Nano-ZS90 Zetasizer (Malvern).
Nanoparticles were examined by vibrational spectroscopy. Raman scattering was studied at 2.33 eV (532 nm visible [VIS] laser) for the NG and nGO powders. The ND powder was analyzed at 4.66 eV (266 nm ultraviolet [UV] laser) due to the strong fluorescence of ND in the VIS spectrum. An argon laser was used as the source of the VIS laser, whereas a Crylas FQCW266-50 diode pumped continuous wave solid-state laser (Berlin, Germany) was used as the source of UV. The scattered light was dispersed by a Jasco NRS 5100 (Easton, PA, USA) spectrometer working in back-scattering mode. During the measurements, the laser beams were focused onto 10 μm spots. Nanoparticles were placed on a silicon substrate. For NG and nGO, spectral resolutions were fixed at 8.4 cm−1 and 3.5 mW laser power. In the case of ND, the spectral resolution was fixed at 20 cm−1 and 5 mW laser power. Figure S2 shows the registered Raman spectra of ND, and Figure S3 presents the comparison of the NG and nGO Raman spectra.
U87 and U118 glioblastoma cell lines
Human glioblastoma U87 and U118 cell lines were obtained from the American Type Culture Collection (Manassas, USA) and maintained in DMEM (Thermo Fisher Scientific) supplemented with 10% fetal bovine serum (FBS, Thermo Fisher Scientific) and 1% penicillin/streptomycin (Thermo Fisher Scientific) at 37°C in a humidified atmosphere of 5% CO2/95% air in an NuAire DH AutoFlow CO2 Air-Jacketed Incubator (Plymouth, MA, USA).
Cell morphology
Scanning electron microscopy (SEM) observations of the U87 or U118 glioblastoma cells were done using a Quanta 200 microscope (FEI, Hillsboro, OR, USA). U87 or U118 glioblastoma cells were seeded in 35 mm diameter Petri dishes (1×10⁵ cells per well). After 24 h, ND, NG, or nGO were introduced to the cells at a concentration of 20 μg/mL. Preparation of the cells for SEM observation was done after 24 h of exposure to nanoparticles in accordance with the protocol of Heckman et al.Citation20 Cells were fixed with 2.5% glutaraldehyde in phosphate-buffered saline (PBS) 7.2 pH, contrasted with 1% osmium tetroxide (Sigma-Aldrich Co., St Louis, MO, USA) and 1% carbohydrazide (Sigma-Aldrich). Subsequently, cells were dehydrated in increasing concentrations of hexylene glycol (Sigma-Aldrich). Drying was performed using a Polaron CPD 7501 critical point dryer (Quorum Technologies, Laughton, UK).
TEM analysis
Glioblastoma cell ultrastructure was assessed by TEM using a JEM-1220 microscope (JEOL) at 80 kV, with a Morada 11 megapixel camera (Olympus Soft Imaging Solutions). U87 or U118 glioblastoma cells were seeded in 75 cm2 cell culture flasks (BD Biosciences, San Jose, CA, USA). After 24 h, ND, NG, or nGO were introduced to cells at a concentration of 20 μg/mL. After 24 h of incubation, the cells were trypsinized, washed with PBS (Sigma-Aldrich), centrifuged for 5 min at 1,200 rpm, and fixed in a 2.5% solution of glutaraldehyde in PBS 7.2 pH (Sigma-Aldrich). Pellets were contrasted in 1% osmium tetroxide (Sigma-Aldrich) and dehydrated in increasing concentrations of ethanol (Sigma-Aldrich). Subsequently, pellets were impregnated with epoxy embedding resin (Epoxy Embedding Kit, Sigma-Aldrich). The next day, samples were embedded in the same resin and hardened for 24 h at 36°C and incubated at 60°C for another 24 h. The blocks were cut into ultrathin sections (50–80 nm) using an ultramicrotome (LKB Ultratome III, Croydon, UK) and transferred onto copper grids, 200 meshes (Agar Scientific Ltd). Subsequently, the sections were contrasted using uranyl acetate (Sigma-Aldrich) and lead citrate (Sigma-Aldrich).
Cell viability using the XTT assay
Cell viability was evaluated using an XTT-based cell proliferation assay kit (Sigma-Aldrich). U87 and U118 cells were plated in 96-well plates (5×10³ cells per well) and incubated for 24 h. Then, new medium containing ND, NG, or nGO was introduced to the cells at concentrations of 5, 20, 50, 100, and 200 μg/mL. XTT solution was added to each well and incubated for an additional 3 h at 37°C. The absorbance of each well was recorded at 450 nm using a Tecan Infinite 200 microplate reader (Tecan, Durham, USA). Cell viability after nanoparticle treatment was expressed as the percentage compared to the absorbance of control samples.
Migration assay
The migration of U87 and U118 cells was assessed using the cell exclusion zone assay. Cells were cultured in six-well plates with a rectangular silicone attachment (Sarstedt, Nümbrecht, Germany) (1×10⁵ cells per well). After cells reached confluence, new medium containing ND, NG, or nGO at a concentration of 50 μg/mL was introduced to the cells. After 1 h of incubation, the silicone attachment was removed, and cells initiated migration. Images were taken immediately after silicone attachment removal (0 h time point) and after 48 h. Cell migration was analyzed after 48 h with an inverted microscope (Olympus Soft Imaging Solutions). The area of migration was calculated using ImageJ 1.48.Citation21 All experiments were repeated at least three times.
Invasion assay
The invasiveness of U87 and U118 cells was determined by counting the number of cells that invaded through collagen-coated (Sigma-Aldrich) Transwell inserts (BD Biosciences). Cells were trypsinized, washed twice, and suspended in serum-free medium. 5×10⁴ cells were seeded in the Transwell inserts. After cells adhered to the Transwell insert, medium containing ND, NG, or nGO at a concentration of 50 μg/mL was introduced to the cells. Medium with 10% FBS (Thermo Fisher Scientific) was added to the lower chamber as a chemoattractant. Cells that passed through the filters into the lower part of Transwell inserts were fixed with 4% paraformaldehyde (Sigma-Aldrich). Cell nuclei were stained with 4′,6-diamidino-2-phenylindole (DAPI; Thermo Fisher Scientific) and counted in 10 fields of view under 100× magnification with an inverted confocal microscope FV-1000 (Olympus Soft Imaging Solutions). The experiments were repeated at least three times.
Adhesion assay
The adhesion of U87 and U118 cells in time points was determined using fluorescent microplate test. 96-well plates were coated with Geltrex Matrix (Thermo Fisher Scientific). Each well was coated with 100 μL Geltrex Matrix diluted to a final concentration of 1 mg/mL in DMEM without FBS. Plates were incubated for 1 h in 37°C, and Geltrex Matrix solution was aspirated and plates were air-dried. U87 and U118 cells were labeled using fluorescent kit – CytoPainter Cell Tracking Staining Kit – Green Fluorescence (Abcam). Before addition to wells, cells were treated with ND, NG, or nGO at a final concentration of 20 μg/mL in DMEM with 10% FBS for 30 min. After incubation 1.5×10⁴ cells were added per well and after 15, 30, 60, and 120 min wells were gently washed three times with PBS. The intensity of fluorescence was read at excitation/emission =490/520 nm on a Tecan Infinite 200 microplate reader. Experiments were repeated two times.
Sample preparation for protein analysis
ND, NG, or nGO were introduced to cells at a concentration of 20 μg/mL and incubated for 24 h. Cells not treated with nanoparticles were used as the control. Cells were washed twice with PBS and harvested by centrifugation (200× g for 6 min at 4°C). Whole-cell protein extracts were prepared by suspending cells in ice-cold radioimmunoprecipitation assay (RIPA) buffer with protease and phosphatase inhibitors (Sigma-Aldrich). The cells were incubated for 40 min on ice with vortexing at 10 min intervals followed by centrifugation for 30 min at 14,000× g at 4°C and collection of supernatant. Cytoplasmic and nuclear fractions were obtained by suspending cells in hypotonic buffer (20 mM Tris-HCl, pH 7.4; 10 mM NaCl; 3 mM MgCl2), followed by addition of Igepal CA-630 (Sigma-Aldrich) to a final concentration of 0.5% with protease and phosphatase inhibitors (Sigma-Aldrich) and vortexing for 10 s. Supernatant of homogenate (cytoplasmic fraction) was collected after centrifugation for 10 min at 3,000 rpm at 4°C. Pellet (nuclear fraction) was resuspended in ice-cold RIPA buffer with protease and phosphatase inhibitors, incubated 30 min on ice with vortexing at 10 min intervals. Supernatant of homogenate (nuclear fraction) was collected after centrifugation for 30 min at 14,000× g at 4°C. Protein concentration was determined by the Bicinchoninic Acid Kit (Sigma-Aldrich).
Enzyme-linked immunosorbent assay (ELISA) analysis
Levels of mTOR (pSer2448) and AKT (pS473) phosphorylation were assayed by ELISA using ab176657 and ab168538 kits (Abcam, Cambridge, UK). The results were normalized to the total protein content determined by the Bicinchoninic Acid Kit (Sigma-Aldrich). Protein concentrations were measured in accordance with the manufacturer’s instructions using lysates containing 100 μg/mL of total protein. A standard curve was made for each assay using serial dilutions of the control lysates. All experiments were repeated twice, using cell extracts from three separate experiments.
Western blot analysis
An equal volume of samples was denatured with sample buffer containing beta-mercaptoethanol (Bio-Rad) and 5 min boiling. Proteins were resolved under reductive conditions with sodium dodecyl sulfate polyacrylamide gel electrophoresis and transferred to nitrocellulose membranes using the Trans-Blot Turbo Transfer System (Bio-Rad). Membranes were blocked with 5% non-fat milk (Bio-Rad) in PBS for 60 min. Membranes were then incubated with primary antibodies in PBS with 5% non-fat milk or for detection of phosphorylated proteins with 1% BSA (Sigma-Aldrich) at 4°C overnight.
The following primary antibodies were used: vinculin monoclonal antibody, Thermo Fisher Scientific, 700062; N-cadherin monoclonal antibody, Thermo Fisher Scientific, MA1-159; pan-cadherin polyclonal antibody, Thermo Fisher Scientific, 71-7100; beta catenin polyclonal antibody, Thermo Fisher Scientific, PA5-19469; EGFR polyclonal antibody, Thermo Fisher Scientific, PA1-1110; phospho-EGFR monoclonal antibody pTyr1173, Thermo Fisher Scientific, MA5-15158; glyceraldehyde 3-phosphate dehydrogenase (GAPDH) monoclonal antibody, Thermo Fisher Scientific, MA5-15738; β-tubulin monoclonal antibody, Santa Cruz Biotechnology Inc., Dallas, TX, USA, Sc-5274. Proliferating cell nuclear antigen (PCNA) monoclonal antibody, Thermo Fisher Scientific, 13-3900. The secondary antibody (goat anti-mouse WesternDot 625 or goat anti-rabbit WesternDot 625) diluted 1:500 was incubated with the membrane in PBS with 5% non-fat dry milk for 1 h at room temperature. GAPDH was used as a loading control for whole-cell lysate, whereas β-tubulin and PCNA were used as a loading control for cytoplasmic and nuclear fractions, respectively. Membranes were visualized using a GelDoc imaging system (Bio-Rad). Quantification and background correction were carried out using ImageJ 1.48.Citation21
Cytoskeleton analysis
Cells were grown on glass bottom 35 mm2 dishes coated with Geltrex Matrix (Thermo Fisher Scientific). Each dish was coated with 500 μL Geltrex Matrix diluted to a final concentration of 1 mg/mL in DMEM without FBS. Plates were incubated for 1 h in 37°C and Geltrex Matrix solution was aspirated and dishes were air-dried (Nest Scientific, Rahway, NJ, USA). After 24 h of incubation, cells were treated with ND, NG, or nGO nanoparticles at the concentration of 20 μg/mL for the next 24 h. Subsequently, cells were washed twice with PBS and fixed with 4% paraformaldehyde (Sigma-Aldrich). Actin cytoskeleton was stained with phalloidin conjugated with Atto 633 (Sigma-Aldrich). Imaging was performed using Olympus FV1000 confocal microscope (Olympus Soft Imaging Solutions) equipped with 60× oil immersion objective.
Statistical analysis
Data were analyzed using multifactorial analysis of variance with Statgraphics Centurion XVI (StatPoint Technologies, Warrenton, VA, USA). Differences between groups were tested with the Tukey’s honest significant difference post hoc test. Results are shown as mean with standard deviation. Differences at P<0.05 were considered significant. Adhesion test data were analyzed using GraphPad Prism 5 (GraphPad Software Inc., La Jolla, CA, USA) with two-way analysis of variance and Bonferroni post hoc test comparing to the control at different time points. Results are shown as mean with standard deviation. Differences at P<0.05 were considered significant.
Results and discussion
Physicochemical characterization and toxicity of nanoparticles
TEM images (Figure S1) and Raman spectra of ND, NG, and nGO (Figures S2 and S3) are presented in the supplement. The registered Raman spectra were characteristic for these kinds of carbon materials.Citation22 The spectra of NG and nGO consisted of two bands: a D band located at ~1,350 cm−1 and a G band at ~1,580 cm−1. The G band appears due to the C–C spCitation2 vibrations,Citation23 while the D peak always indicates defects present in the carbon lattice.Citation24,Citation25 The very high intensity of the D/G band ratio of the presented spectra indicates that these were ultra-fine powders.Citation26 The ND Raman spectrum consists of G and D bands as well as the so-called T band that is characteristic of spCitation3 binding around 1,100 cm−1 and a vibration characteristic for diamond around 1,330 cm−1.Citation27,Citation28 TEM analyses were used to evaluate morphology of nanoparticles (). Additionally, DLS analysis was performed to determine the average hydrodynamic diameter of nanoparticles. The zeta potential was analyzed to characterize surface charges and the stability of the suspensions ().
Table 1 Physicochemical properties of diamond nanoparticles, graphite nanoparticles and graphene oxide nanoplatelets
To evaluate ND, NG, and nGO toxicity in U87 and U118 glioblastoma cells, the viability of the cells was examined using the XTT assay (). ND, NG, and nGO were added to cell cultures at concentrations of 10, 20, 50, 100, and 200 μg/mL. The reduction in cell viability was dose-dependent and was strongest after NG treatment, followed by nGO and ND treatment. NG at a concentration of 200 μg/mL reduced the viability of the U87 cell line by 42% and that of the U188 cell line by 23%.
Figure 1 U87 and U118 glioblastoma cell viability.
Notes: Cell viability was determined using the XTT assay. Cells were exposed to diamond nanoparticles (ND), graphite nanoparticles (NG), and graphene oxide (nGO) at concentrations of 10, 20, 50, 100, and 200 μg/mL for 24 h. Values are expressed as mean ± standard deviation (n=4, each experiment in duplicate). Statistical significance between control (C) and the treated cells is indicated by an asterisk (multifactor analysis of variance [ANOVA]; P<0.05). There was statistical significance between U87 and U118 viability (P=0.0000) and the interaction between cell line and the type of nanoparticle (P=0.0000).
![Figure 1 U87 and U118 glioblastoma cell viability.Notes: Cell viability was determined using the XTT assay. Cells were exposed to diamond nanoparticles (ND), graphite nanoparticles (NG), and graphene oxide (nGO) at concentrations of 10, 20, 50, 100, and 200 μg/mL for 24 h. Values are expressed as mean ± standard deviation (n=4, each experiment in duplicate). Statistical significance between control (C) and the treated cells is indicated by an asterisk (multifactor analysis of variance [ANOVA]; P<0.05). There was statistical significance between U87 and U118 viability (P=0.0000) and the interaction between cell line and the type of nanoparticle (P=0.0000).](/cms/asset/4f877d10-89fa-40ac-bedc-36ccc7e4f4c9/dijn_a_146193_f0001_b.jpg)
The results of viability assays were in accordance with the results from different studies, showing that the in vitro toxicity of graphene oxide is low.Citation29,Citation30 Graphene oxide, especially at low concentrations, does not show obvious cytotoxic effects on the human-derived cell lines A549 and SH-SY5Y.Citation31,Citation32 However, graphene oxide reduces glioblastoma cell viability and proliferation with increasing doses.Citation12 The toxicity of graphene oxide on mesenchymal stem cells depends on the size of the nanoparticles. nGO with a size of 11 nm induces a stronger reduction in proliferation and reactive oxygen species formation than larger particles.Citation33 Similarly, ND and NG show low toxicity on glioblastoma and hepatocellular carcinoma cells.Citation34 Moreover, ND has been suggested to be biocompatible with neuroblastoma cells and macrophages.Citation35 However, neuroblastoma cells lose their neurite extensions after incubation with ND at a concentration of 100 μg/mL, and macrophages show morphological changes at this dose.Citation16
Nanoparticle association with the plasma membrane and uptake
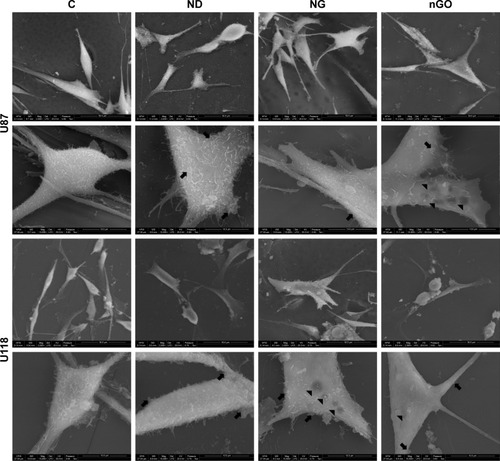
SEM images showed that nanoparticles were present on the surface of the body of cells and protrusions (). ND, NG, and nGO agglomerated on the plasma membrane surface. High magnification SEM images demonstrated that the glioblastoma surface after treatment with NG and to a greater extent nGO showed irregularities, visible as less electron-dense spots, suggesting direct interactions of nGO with plasma membranes.
Figure 2 Scanning electron microscopy of U87 and U118 glioblastoma cells.
Notes: Electron microscopic images were taken after treatment with nanoparticles at 20 μg/mL for 24 h. Arrows on the scanning electron microscope images indicate agglomerates of nanoparticles, and arrowheads indicate cell surface irregularities. Scanning electron microscope images of U87 and U118 cells without treatment (C) and after treatment with diamond nanoparticles (ND), graphite nanoparticles (NG), and graphene oxide (nGO).
To determine whether the examined nanoparticles entered glioblastoma cells, further microscopic studies were performed. Nanoparticle uptake and cellular localization were assessed using TEM (). U87 and U118 cells were treated with nanoparticles at a concentration of 20 μg/mL and incubated for 24 h. The examination of glioblastoma cell ultrastructure revealed that ND, NG, and nGO were located inside cells. However, the amount of ND and NG inside cells was approximately three times greater than that of nGO. Nanoparticles were localized inside vacuoles and in the cytoplasm. nGO more often than ND and NG were found to damage vacuoles and reach the cytoplasm.
Figure 3 Ultrastructure of U87 and U118 glioblastoma cells.
Notes: Electron microscopic images were taken after treatment with nanoparticles at 20 μg/mL for 24 h. Transmission electron microscope images of U87 and U118 cells without treatment (C) and after treatment with diamond nanoparticles (ND), graphite nanoparticles (NG), and graphene oxide (nGO). Arrows indicate nanoparticles. Scale bar 1 μm.
Abbreviations: AP, autophagosome; EV, endocytic vesicle; Mi, mitochondrion; MVB, multivesicular body; N, nucleus; PMF, plasma membrane fold.
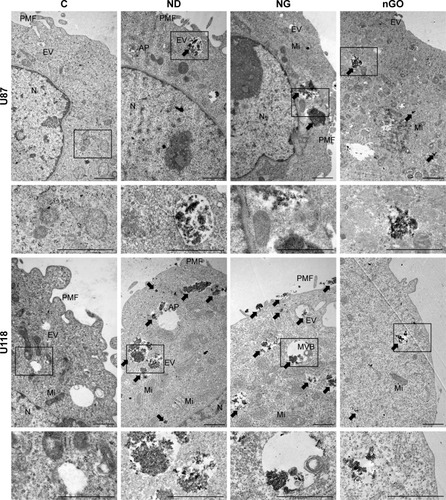
The investigation of endocytosis and the morphology of glioblastoma cells suggests different behavior of the examined carbon nanoparticles, especially for ND and nGO. ND were effectively taken up by the cells, whereas nGO strongly interacted with the cell surface. Interestingly, NG showed features of both ND and nGO, which may be related to the spCitation2 atom hybridization similar to nGO and the spherical structure similar to ND. Many vacuoles were loaded with nanoparticles, especially after treatment with ND and NG, suggesting that endocytosis of these nanoparticles is preferential and profound.
Nanoparticles decrease adhesion and migration of glioblastoma cells
To examine whether nanoparticles, after attachment to the cell membrane and endocytosis, can mitigate the ability of glioblastoma cells to adhere to extracellular matrix and migrate, we performed an adhesion test, two-dimensional migration assay, and a three-dimensional invasion assay.
Adhesion test was performed in four time points (15, 30, 60, and 120 min). Treatment with ND, NG, or nGO decreased adhesion of both glioma cell lines. U87 had decreased adhesion starting from 30 min time point (), whereas U118 starting from 15-time point ().
Figure 4 U87 and U118 glioblastoma cell motility and adhesion.
Notes: Migration of glioblastoma cells was determined using the cell exclusion zone assay. Cells were treated with nanoparticles at 50 μg/mL. (A) U87 and U118 glioblastoma cells before treatment (0 h time point) and after 48 h not treated with nanoparticles and treated with diamond nanoparticles, graphite nanoparticles, and graphene oxide nanoparticles. (B) The invasiveness of U87 and U118 cells was determined by staining the nuclei of cells that had invaded through collagen-coated Transwell inserts with DAPI. Nuclei were counted using a confocal microscope after treatment with nanoparticles at 50 μg/mL. (C) Graph shows the percentage of the zone covered by cells. Values are expressed as mean ± standard deviation (n=3, each experiment in triplicate). Statistical significance is indicated with different superscripts (multifactor ANOVA; P<0.05). There was a significant difference between U87 and U118 migration (P=0.0000). No interactions between cell line and the type of nanoparticle were observed (P=0.0623). (D) Graph shows the percentage of cell invasion compared to control. Values are expressed as mean ± standard deviation (n=3, each experiment in triplicate). Statistical significance is indicated with different superscripts (multifactor ANOVA; P<0.05). There was no statistical significance between U87 and U118 invasion (P=0.3034); however, an interaction between cell line and the type of nanoparticle was observed (P=0.0003). (E, F) Adhesion of fluorescent-labeled U87 and U118 cells after treatment with nanoparticles at 20 μg/mL. 96-well plates were coated with extracellular matrix. After 15, 30, 60, and 120 min wells were gently washed three times and intensity of fluorescence was read at microplate reader. Values are expressed as mean ± standard deviation (n=3, each experiment in triplicate). Statistical significance between control and experimental groups is indicated with superscripts (multifactor ANOVA, *P<0.05; ***P<0.001).
Abbreviations: ANOVA, analysis of variance; C, control; DAPI, 4′,6-diamidino-2-phenylindole; ND, diamond nanoparticles; NG, graphite nanoparticles; nGO, graphene oxide nanoparticles.
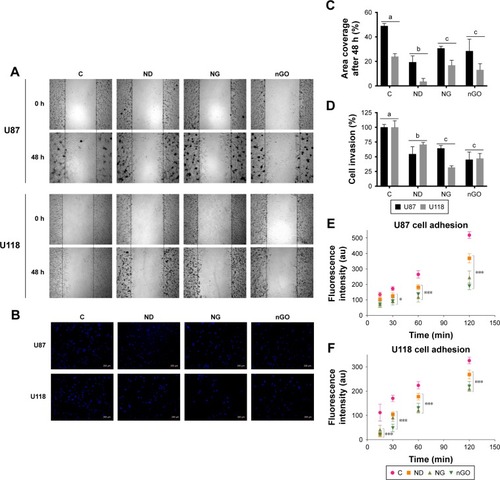
Two-dimensional migration assay provides information about the abilities of cancer cells to move within a cell-free area and is done without scratching off cells, which can influence the results due to the release of growth factors from damaged cells.Citation36 Treatment with ND, NG, or nGO at a concentration of 50 μg/mL reduced the two-dimensional migration of both U87 and U118 glioblastoma cells by approximately twofold (). The strongest inhibition was observed after treatment with ND. U87 cells showed a stronger ability to migrate than U188. Although both U87 and U118 cell lines are able to migrate and are tumorigenic in animal models, U87 is approximately eight times more invasive than U118 cells.Citation37 Moreover, U87 cells can form approximately twofold larger tumors than U118 cells after the same duration of tumor development in immunodeficient mice.Citation38 Similar observations were made when U87 and U118 cells were inoculated into the chorioallantoic membrane of chicken embryos.Citation39
The three-dimensional invasion assay was used to evaluate whether tumor cells can pass through collagen-coated pores into medium containing a chemoattractant. In both cell lines, the invasion abilities were significantly reduced after treatment with ND, NG, or nGO at a concentration of 50 μg/mL (). The strongest inhibition was observed after treatment with nGO and NG, whereas ND reduced invasion to a lesser extent. There were no significant differences between the invasiveness of the U87 and U118 glioblastoma cell lines. However, we observed an interaction between the type of cell and the type of nanoparticle. In both models, nanoparticles reduced the migration capabilities of glioblastoma cells.
The invasion model is more similar to in vivo conditions than the two-dimensional migration model because cells need to interact with the extracellular matrix and respond to a chemoattractant and thus require different cell signaling pathways.Citation40 Cells migrating in the two-dimensional models often display only sparse filopodia, whereas in the three-dimensional invasion model or in vivo, cells extensively use filopodia to probe the extracellular matrix and migrate.Citation41,Citation42 Both cell lines exhibited mutations in PTEN, whereas U118 also revealed p53 mutation. Glioblastoma cell lines with mutations in PTEN and both PTEN and p53 show increased membrane folding, however, cell lines containing both mutations have largest surface areas.Citation3 U118 after treatment with NG showed approximately twofold higher reduction of cell invasion than U87 cells. There was no difference between cell lines after treatment with nGO, which could be related to a lower level of endocytosis.
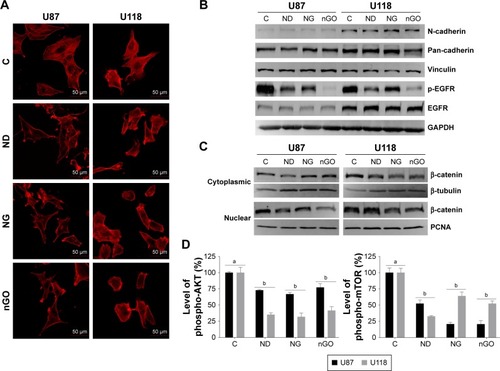
To better understand interaction of cells with extracellular matrix cytoskeleton was analyzed. Images of actin cytoskeleton () show that treatment with nanoparticles led to actin remodeling in cells, decreasing amount of stress fibers in cytoplasm. Moreover, cells treated with nanoparticles showed intensive F-actin formation in cell cortex, suggesting need of stabilization of cell adhesion. Cortical actin stabilizes integrin and cadherin adhesions and regulates intercellular tension.Citation43,Citation44 Stress fibers in cytoplasm stabilize cell and generate traction force during migration and are ended with focal adhesion complexes.Citation6 ND, NG, and nGO nanoparticles decreased adhesion of cells to extracellular matrix showing similar effect to extracellular matrix with low mechanical rigidity. Glioblastoma cells with low mechanical rigidity surface alter cell motility and cytoskeletal architecture.Citation45
Figure 5 EGFR/AKT/mTOR and β-catenin signaling in glioblastoma cells after treated with nanoparticles.
Notes: (A) Confocal microscope images of U87 and U118 cells actin cytoskeleton. Cells were grown on extracellular matrix for 24 h and treated with diamond nanoparticles, graphite nanoparticles, or graphene oxide nanoparticles at a concentration of 20 μg/mL and incubated for 24 h. F-Actin was stained with phalloidin conjugated with Atto 633. (B) Western blot analysis of N-cadherin, pan-cadherin, vinculin, p-EGFR, and EGFR. GAPDH was used as a loading control. (C) Western blot analysis of nuclear and cytoplasmic protein fractions used for determination of β-catenin protein level. PCNA and β-tubulin were used as loading controls for nuclear and cytoplasmic fractions, respectively. (D) ELISA analysis of AKT and mTOR phosphorylation in comparison to control. Treatment with nanoparticles significantly reduced phospho-AKT (P<0.0000) and mTOR (P<0.0000). Phospho-AKT level was cell line dependent (P<0.0000) and was affected by interaction of cell line and nanoparticles (P<0.001). Phospho-mTOR level was also cell line dependent (P<0.0023) and was affected by interaction of cell line and nanoparticles (P<0.0000). Values are expressed as mean ± standard deviation (n=5, each experiment in duplicate). Statistical significance is indicated with different superscripts (multifactor ANOVA; P<0.05).
Abbreviations: ANOVA, analysis of variance; C, control; ELISA, enzyme-linked immunosorbent assay; GAPDH, glyceraldehyde 3-phosphate dehydrogenase; ND, diamond nanoparticles; NG, graphite nanoparticles; nGO, graphene oxide nanoparticles.
Nanoparticles decrease adhesion-dependent signaling pathways
To determine if changes in migration are associated with protein expression of adhesion molecules, levels of vinculin and cadherin proteins were examined (). Treatment with nanoparticles did not alter protein levels of vinculin, N-cadherin, and pan-cadherin. This suggests that nanoparticles change cell migration by impeding connection between cells and extracellular matrix.
EGFR/AKT/mTOR signaling pathway was analyzed by assessment of phosphorylation levels of EGFR, AKT, and mTOR protein. Treatment with ND, NG, and especially with nGO decreased level of phospho-EGFR (pTyr1173), whereas did not alter total level of EGFR protein (). The nanoparticles also decreased the activation of two downstream targets of EGFR, AKT, and mTOR (). Cell adhesion with extracellular matrix leads to ligand-independent activation of EGFR.Citation46,Citation47 Integrins induce phosphorylation of EGF receptor on tyrosine residues 845, 1068, 1086, and 1173, but not on residue 1148, a major site of phosphorylation in response to EGF.Citation48 Treatment with ND, NG, and nGO decreased level of phosphor-EGFR (pTyr1173) probably by decreasing glioblastoma cells’ adhesion.
β-Catenin signaling was analyzed by assessment of level of β-catenin in nuclear and cytoplasmic fractions using Western blot method (). NG and nGO nanoparticles caused decrease in β-catenin level in nuclear fraction. ND affected β-catenin activity only after treatment of U87 cell line. β-Catenin is important protein in cadherin-based adhesions and is also an essential coactivator of canonical Wnt-mediated gene expression. Canonical Wnt signaling and cadherin-mediated cell adhesion depend on the same pool of β-catenin.Citation49 Decrease in nuclear level of β-catenin without changes in cadherin protein level suggests that treatment with nanoparticles leads to stabilization of β-catenin pool connected with cadherin junctions. The affinity between cadherin and β-catenin at junctions is increased by inhibition of receptor tyrosine kinases including EGFR.Citation50–Citation52 NG and nGO that inhibit EGFR phosphorylation to higher extent than ND caused also a decrease in nuclear level of β-catenin.
Downstream of EGFR, AKT, and mTOR plays important roles in many cellular processes, including proliferation, apoptosis, cell cycle progression, cell motility, and autophagy. The pathway is constantly activated in glioblastoma and other tumors, including breast cancer, gastric cancer, and hepatocellular carcinoma.Citation53 PI3K activates AKT by phosphorylation, which changes its localization to the nucleus where it activates mTOR and downstream targets. mTOR functions as two distinct complexes, mTORC1 and mTORC2. The suppression of mTORC1 leads to stimulation of mTORC2, which positively regulates cell survival and proliferation at different signaling levels, mainly by the activation of AKT.Citation54 Apart from inhibition of EGFR phosphorylation, a decrease in the activation of mTOR could be caused by profound endocytosis of nanoparticles. Reports have shown that mTORC1 activation can be decreased during the failure of lysosome reformation.Citation55–Citation57 Lysosome reformation occurs in endolysosomes or autolysosomes after processing a substrate. Inefficient digestion of substrates can lead to the accumulation of endolysosomes in the cytosol,Citation55,Citation58 thereby decreasing lysosome reformation and mTORC1 activation. Thus, intensive endocytosis of nanoparticles, which are indigestible by cells, can lead to a decrease in mTORC1 activation and nutrient starvation.
Additionally, endocytosis of nanoparticles could lead to the internalization of large areas of the plasma membrane, thus decreasing the availability of receptor tyrosine kinases that, after binding with their ligands, activate the AKT/mTOR signaling pathway.Citation59 Macropinocytosis is a possible way of entering into the cell for nanoparticles with size <10 nm, thereby delivering nanoparticles to early endosomes, late endosomes, and subsequently to lysosomes.Citation60 However, agglomerates of ND, NG, and nGO could be effectively internalized by endocytosis.Citation61,Citation62 Ligand-unmodified polymeric nanoparticles have been shown to enter U87 cells by mainly clathrin-dependent endocytosis and macropinocytosis.Citation63 Ligand-unmodified iron oxide nanoparticles and silica-coated iron oxide nanoparticles also enter HeLa cells (human cervical cancer) by endocytosis, but mainly in a caveolin-dependent way.Citation64 This suggests that nanoparticle uptake is conducted by endocytosis, which depends on the size and surface characteristics of the nanoparticles.Citation65 Non-spherical nanoparticles have a higher area of interaction with the plasma membrane. nGO examined in this study probably strongly interacted with the plasma membrane, leading to changes in cell surface morphology and caused strongest decreases in EGFR phosphorylation. Further investigations are required to explore the biological mechanisms of the interaction between the EGFR/AKT/mTOR signaling pathway and endocytosis triggered by ND, NG, and nGO nanoparticles.
We have demonstrated that ND, NG, and nGO nanoparticles caused decrease in U87 and U118 adhesion that led to decrease in migration and invasiveness of the glioblastoma cell lines U87 and U118 affecting activity of EGFR/AKT/mTOR and β-catenin signaling pathways. These results indicate that the examined nanoparticles could be used as a low toxicity glioblastoma therapy, especially as an active compound for drug delivery.
Author contributions
MW proposed and designed the study, guided the experiments and data analysis. MW, SJ and MK performed experiments. MG and BS analyzed data. KZ and RC performed and analyzed Raman spectrum. AC and ES supervised assembly of manuscript. MW and AC wrote the manuscript. NK improved presentation. All the authors read and approved the manuscript. All authors contributed toward data analysis, drafting and critically revising the paper and agree to be accountable for all aspects of the work.
Acknowledgments
This work was supported by the Polish National Research Council grant NCN “Prelude” 2011/03/N/NZ9/04290 and 2013/09/N/NZ9/01898. The manuscript is a part of the habilitation thesis by Mateusz Wierzbicki.
Disclosure
The authors report no conflicts of interest in this work.
Supplementary materials
Figure S1 Transmission electron microscopic images of nanoparticles.
Note: Images of diamond nanoparticles (A), graphite nanoparticles (B), and graphene oxide (C).
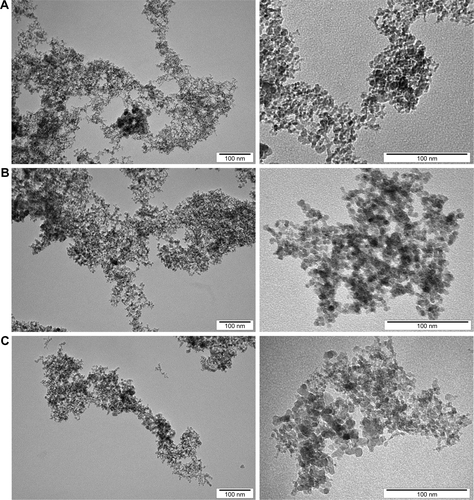
Figure S2 Raman spectra of diamond nanoparticles.
Note: Spectra consist of the vibration characteristic for diamond at ~1,330 cm−1 and three bands: a T band located at ~1,100 cm−1, a D band at ~1,290 cm−1, and a G band at ~1,640 cm−1.
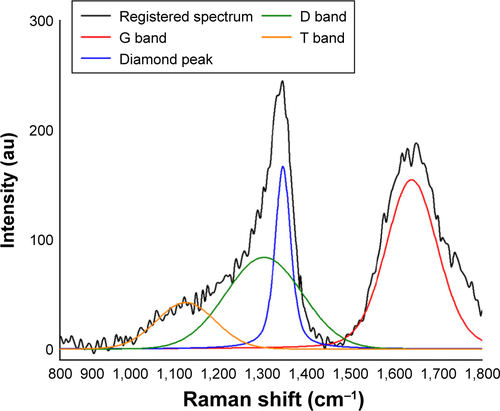
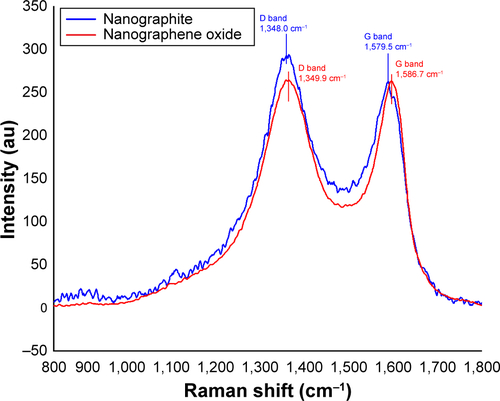
Figure S3 Raman spectra of graphite nanoparticles and graphene oxide.
Notes: Spectra consist of two bands: a D band located at ~1,350 cm−1 and a G band at ~1,580 cm−1. Raman spectra of graphite nanoparticles and graphene oxide were normalized to the G band peak.
References
- OhgakiHDessenPJourdeBGenetic pathways to glioblastoma: a population-based studyCancer Res200464196892689915466178
- FonkemELunMWongETRare phenomenon of extracranial metastasis of glioblastomaJ Clin Oncol201129344594459522042941
- MemmelSSukhorukovVLHöringMCell surface area and membrane folding in glioblastoma cell lines differing in PTEN and p53 statusPLoS One201491e8705224498019
- PollardTDBorisyGGCellular motility driven by assembly and disassembly of actin filamentsCell2003112445346512600310
- FriedlPWolfKTumour-cell invasion and migration: diversity and escape mechanismsNat Rev Cancer20033536237412724734
- KraikivskiPSlepchenkoBMNovakILActin bundling: initiation mechanisms and kineticsPhys Rev Lett20081011212810218851415
- ZhouHHuangSRole of mTOR signaling in tumor cell motility, invasion and metastasisCurr Protein Pept Sci2011121304221190521
- BurrisHAOvercoming acquired resistance to anticancer therapy: focus on the PI3K/AKT/mTOR pathwayCancer Chemother Pharmacol201371482984223377372
- SathornsumeteeSReardonDADesjardinsAQuinnJAVredenburghJJRichJNMolecularly targeted therapy for malignant gliomaCancer20071101132417520692
- EndersbyRBakerSJPTEN signaling in brain: neuropathology and tumorigenesisOncogene200827415416543018794877
- SimpsonLParsonsRPTEN: life as a tumor suppressorExp Cell Res20012641294111237521
- JaworskiSSawoszEKutwinMIn vitro and in vivo effects of graphene oxide and reduced graphene oxide on glioblastomaInt J Nanomedicine2015101585159625759581
- WierzbickiMSawoszEGrodzikMPrasekMJaworskiSChwalibogAComparison of anti-angiogenic properties of pristine carbon nanoparticlesNanoscale Res Lett20138119523618362
- FaklarisOJoshiVIrinopoulouTPhotoluminescent diamond nanoparticles for cell labeling: study of the uptake mechanism in mammalian cellsACS Nano20093123955396219863087
- NeugartFZappeAJelezkoFDynamics of diamond nanoparticles in solution and cellsNano Lett20077123588359117975943
- SchrandAMDaiLSchlagerJJHussainSMOsawaEDifferential biocompatibility of carbon nanotubes and nanodiamondsDiam Relat Mater2007161221182123
- GrodzikMSawoszEWierzbickiMNanoparticles of carbon allotropes inhibit glioblastoma multiforme angiogenesis in ovoInt J Nanomedicine201163041304822162660
- WierzbickiMSawoszEGrodzikMCarbon nanoparticles downregulate expression of basic fibroblast growth factor in the heart during embryogenesisInt J Nanomedicine201383427343524039425
- StrojnyBKurantowiczNSawoszELong term influence of carbon nanoparticles on health and liver status in ratsPLoS One20151012e014482126657282
- HeckmanCKanagasundaramSCayerMPaigeJPreparation of cultured cells for scanning electron microscopeProtoc Exch200710.1038/nprot.2007.504
- SchneiderCARasbandWSEliceiriKWNIH Image to ImageJ: 25 years of image analysisNat Methods20129767167522930834
- KrishnamoorthyKVeerapandianMYunKKimS-JThe chemical and structural analysis of graphene oxide with different degrees of oxidationCarbon N Y2013533849
- TuinstraFKoenigJLRaman spectrum of graphiteJ Chem Phys197053311261130
- VenugopalGJungM-HSuemitsuMKimS-JFabrication of nanoscale three-dimensional graphite stacked-junctions by focused-ion-beam and observation of anomalous transport characteristicsCarbon N Y201149827662772
- FerrariACRaman spectroscopy of graphene and graphite: Disorder, electron–phonon coupling, doping and nonadiabatic effectsSolid State Commun20071431–24757
- LinY-HYangC-YLinS-FLinG-RTriturating versatile carbon materials as saturable absorptive nano powders for ultrafast pulsating of erbium-doped fiber lasersOpt Mater Exp201552236
- FerrariACRobertsonJRaman spectroscopy of amorphous, nanostructured, diamond–like carbon, and nanodiamondPhilos Trans A Math Phys Eng Sci200436218242477251215482988
- PrawerSNemanichRJRaman spectroscopy of diamond and doped diamondPhilos Trans A Math Phys Eng Sci200436218242537256515482990
- WangYWuSZhaoXSuZDuLSuiAIn vitro toxicity evaluation of graphene oxide on human RPMI 8226 cellsBiomed Mater Eng20142462007201325226897
- SydlikSAJhunjhunwalaSWebberMJAndersonDGLangerRIn vivo compatibility of graphene oxide with differing oxidation statesACS Nano2015943866387425849074
- LiuZRobinsonJTSunXDaiHPEGylated nanographene oxide for delivery of water-insoluble cancer drugsJ Am Chem Soc200813033108761087718661992
- LvMZhangYLiangLEffect of graphene oxide on undifferentiated and retinoic acid-differentiated SH-SY5Y cells lineNanoscale20124133861386622653613
- AkhavanOGhaderiEAkhavanASize-dependent genotoxicity of graphene nanoplatelets in human stem cellsBiomaterials201233328017802522863381
- ZakrzewskaKESamlukAWierzbickiMAnalysis of the cytotoxicity of carbon-based nanoparticles, diamond and graphite, in human glioblastoma and hepatoma cell linesPLoS One2015103e012257925816103
- ThomasVHalloranBAAmbalavananNCatledgeSAVohraYKIn vitro studies on the effect of particle size on macrophage responses to nanodiamond wear debrisActa Biomater2012851939194722342422
- AuerbachRAuerbachWPolakowskiIAssays for angiogenesis: a reviewPharmacol Ther19915111111722898
- FormoloCAWilliamsRGordish-DressmanHMacDonaldTJLeeNHHathoutYSecretome signature of invasive glioblastoma multiformeJ Proteome Res20111073149315921574646
- XieQBradleyRKangLHepatocyte growth factor (HGF) autocrine activation predicts sensitivity to MET inhibition in glioblastomaProc Natl Acad Sci U S A2012109257057522203985
- JaworskiSSawoszEGrodzikMComparison of tumour morphology and structure from U87 and U118 glioma cells cultured on chicken embryo chorioallantoic membraneBull Vet Inst Pulawy2013574593598
- JacquemetGHamidiHIvaskaJFilopodia in cell adhesion, 3D migration and cancer cell invasionCurr Opin Cell Biol201536233126186729
- ChanCEOddeDJTraction dynamics of filopodia on compliant substratesScience200832259081687169119074349
- LeeDFongKPKingMRBrassLFHammerDADifferential dynamics of platelet contact and spreadingBiophys J2012102347248222325269
- de RooijJCadherin adhesion controlled by cortical actin dynamicsNat Cell Biol201416650851024875740
- RulloJBeckerHHydukSJActin polymerization stabilizes α4β1 integrin anchors that mediate monocyte adhesionJ Cell Biol2012197111512922472442
- UlrichTAde Juan PardoEMKumarSThe mechanical rigidity of the extracellular matrix regulates the structure, motility, and proliferation of glioma cellsCancer Res200969104167417419435897
- ShenXKramerRHAdhesion-mediated squamous cell carcinoma survival through ligand-independent activation of epidermal growth factor receptorAm J Pathol200416541315132915466396
- LarsenABStockhausenM-TPoulsenHSCell adhesion and EGFR activation regulate EphA2 expression in cancerCell Signal201022463664419948216
- MoroLDolceLCabodiSIntegrin-induced epidermal growth factor (EGF) receptor activation requires c-Src and p130Cas and leads to phosphorylation of specific EGF receptor tyrosinesJ Biol Chem2002277119405941411756413
- HeubergerJBirchmeierWInterplay of cadherin-mediated cell adhesion and canonical Wnt signalingCold Spring Harb Perspect Biol201022a00291520182623
- ColucciaAMLVaccaADuñachMBcr-Abl stabilizes beta-catenin in chronic myeloid leukemia through its tyrosine phosphorylationEMBO J20072651456146617318191
- CleversHNusseRWnt/β-catenin signaling and diseaseCell201214961192120522682243
- KrejciPAklianAKauckaMReceptor tyrosine kinases activate canonical WNT/β-catenin signaling via MAP kinase/LRP6 pathway and direct β-catenin phosphorylationPLoS One201274e3582622558232
- PortaCPaglinoCMoscaATargeting PI3K/Akt/mTOR signaling in cancerFront Oncol201446424782981
- VadlakondaLDashAPasupuletiMAnil KumarKReddannaPThe paradox of Akt-mTOR interactionsFront Oncol2013316523802099
- YuLMcPheeCKZhengLTermination of autophagy and reformation of lysosomes regulated by mTORNature2010465730094294620526321
- ZoncuRBar-PeledLEfeyanAWangSSancakYSabatiniDMmTORC1 senses lysosomal amino acids through an inside-out mechanism that requires the Vacuolar H+-ATPaseScience2011334605667868322053050
- LiMKhambuBZhangHSuppression of lysosome function induces autophagy via a feedback down-regulation of MTOR complex 1 (MTORC1) activityJ Biol Chem201328850357693578024174532
- BrightNAReavesBJMullockBMLuzioJPDense core lysosomes can fuse with late endosomes and are re-formed from the resultant hybrid organellesJ Cell Sci1997110pt 17202720409378754
- BergerCMadshusIHStangECetuximab in combination with anti-human IgG antibodies efficiently down-regulates the EGF receptor by macropinocytosisExp Cell Res2012318202578259122975728
- GeiserMUpdate on macrophage clearance of inhaled micro- and nanoparticlesJ Aerosol Med Pulm Drug Deliv201023420721720109124
- ZhangSLiJLykotrafitisGBaoGSureshSSize-dependent endocytosis of nanoparticlesAdv Mater20092141942419606281
- GaoHShiWFreundLBMechanics of receptor-mediated endocytosisProc Natl Acad Sci U S A2005102279469947415972807
- GaoHYangZZhangSLigand modified nanoparticles increases cell uptake, alters endocytosis and elevates glioma distribution and internalizationSci Rep20133253423982586
- BohmerNJordanACaveolin-1 and CDC42 mediated endocytosis of silica-coated iron oxide nanoparticles in HeLa cellsBeilstein J Nanotechnol2015616717625671161
- OhNParkJ-HEndocytosis and exocytosis of nanoparticles in mammalian cellsInt J Nanomedicine20149suppl 1516324872703