
 ?Mathematical formulae have been encoded as MathML and are displayed in this HTML version using MathJax in order to improve their display. Uncheck the box to turn MathJax off. This feature requires Javascript. Click on a formula to zoom.
Abstract
Efficient delivery of nucleic acids into target cells is crucial for nucleic acid-based therapies. Various nucleic acid delivery systems have been developed, each with its own advantages and limitations. We previously developed a nanoparticle-based delivery system for small chemical drugs using pH-responsive PEG8-PDPA100-PEG8 polymer micelles as carriers. In this study, we extend the application of these pH-responsive micelle-like nanoparticles (MNPs) to deliver oligonucleotides. We demonstrate that the MNPs efficiently encapsulate and deliver oligonucleotides of different lengths (20–100 nt) into cells. The cargo oligonucleotides are rapidly released at pH 5.0. We prepared MNPs carrying a Texas red-fluorescently labeled anti-human epidermal growth factor receptor 2 (HER2) aptamer (HApt). Compared to free HApt, the HApt-MNPs resulted in significantly better cellular uptake, reduced cell viability, and increased apoptosis in SKBR3 breast cancer cells, which overexpress HER2. Moreover, HApt-MNPs were significantly less cytotoxic to MCF7 breast cancer cells, which express low levels of HER2. After cellular uptake, HApt-MNPs mainly accumulated in lysosomes; inhibition of lysosomal activity using bafilomycin A1 and LysoTracker Red staining confirmed that lysosomal activity and low pH were required for HApt-MNP accumulation and release. Furthermore, HER2 protein expression declined significantly following treatment with HApt-MNPs in SKBR3 cells, indicating that HApt-induced translocation of HER2 to lysosomes exerted a potent cytotoxic effect by altering signaling downstream of HER2. In conclusion, this pH-responsive and lysosome-targeting nanoparticle system can efficiently deliver oligonucleotides to specific target cells and has significant potential for nucleic acid-based cancer therapies.
Introduction
In recent decades, nucleic acid-based therapeutic agents have been developed and used in the clinic to treat multiple diseases, including cancer,Citation1–Citation4 diabetes,Citation4–Citation6 cardiovascular diseases,Citation7,Citation8 and infectious diseases.Citation9–Citation11 However, the large size, high anionic charge density, and hydrophilic properties of DNA and RNA molecules significantly limit their cellular uptake.Citation12–Citation15 Hence, a plethora of nucleic acid carriers have been developed in an attempt to overcome these barriers.
In general, nucleic acid delivery systems can be classified into two major groups: viral and nonviral.Citation16–Citation19 Viral vectors, such as retrovirus or adenovirus-based systems, have high transduction efficiencies. However, their application is limited by high production costs and biosafety and immunogenicity concerns.Citation18,Citation20,Citation21 Nonviral systems, such as lipid-or polymer-based approaches, have gained much attention due to their low cytotoxicity, weak or lack of immunogenicity, and ease of production.Citation22–Citation26 Among the nonviral delivery systems, polymeric nanoparticles are an attractive option for gene therapy due to their unique properties including self-assembly behavior, ability to condense and protect nucleic acids, cell association, efficient cell transfection, and low cytotoxicity.Citation23,Citation25–Citation28 Recently, the addition of stimuli-sensitive functions has enabled polymeric nanoparticles to specifically respond to pathological or externally applied “triggers” (eg, temperature, pH, enzymatic catalysis, and light or magnetic fields) and further extended their potential applications.Citation29–Citation32 For example, pH-responsive polymeric nanoparticles capable of protecting nucleic acids in the blood circulation and actively releasing their cargo in the tumor microenvironment and/or inside the target tumor cells have received overwhelming interest in the context of cancer therapy.
We previously developed a novel pH-responsive delivery system for small chemical anticancer drugs from amphiphilic triblock copolymers composed of poly[2-(diisopropylamino)ethyl methacrylate] (PDPA) and methoxy-poly(ethyleneglycol) segments (PEG8-PDPAn-PEG8; n=30, 50, or 100).Citation29,Citation33 The PEG shell of the micelle-like nanoparticles (MNPs) prolongs the circulation of MNPs in the blood by reducing nonspecific associations with plasma proteins and tissues.Citation34,Citation35 The PDPA core serves as a pH sensor, which is hydrophobic at physiological pH (pH >7.4) and becomes hydrophilic at acidic conditions due to protonation of di-isopropylamin.Citation36,Citation37 Thus, the pH-responsive MNPs are stable at pH 7.4 but swell and disaggregate at a pH <6.0. MNPs composed of PEG8-PDPA100-PEG8 have been proven to possess a range of desirable properties, such as low cytotoxicity, superior efficiency to deliver small chemical drugs, and considerable lysosomal accumulation after cellular uptake.Citation29
Human epidermal growth factor receptor 2 (HER2), a member of the epidermal growth factor-related protein (ErbB) family of receptor tyrosine kinases, is overexpressed on the plasma membranes of tumor cells in a variety of cancers compared to normal cells. Overexpression of HER2 is associated with the development and progression of a multitude of malignancies and is a major therapeutic target in several cancers.Citation38 Downregulation of HER-2 expression attenuates HER2 signaling and promotes cell cycle arrest and apoptosis by altering a number of downstream signaling pathways.Citation39,Citation42,Citation43 Recently, a 42 nucleotide (nt) trimeric anti-HER2 aptamer (HApt) derived from degradation of HER2 in lysosomes was reported to kill HER2-overexpressing N87 gastric cancer cells and SKBR3 breast cancer cells.Citation40,Citation41 The anti-HApt exerts a cytotoxic effect by inducing cross-linking of HER2 on the cell surface, which results in the trans-location of HER2 from the plasma membrane to cytoplasmic vesicles (mainly in lysosomes), where HER2 is thought to be degraded by proteases.Citation41
In this study, we extended the application of our PEG8-PDPA100-PEG8 MNPs to the delivery of oligonucleotides. The MNPs could efficiently package oligonucleotides of varied lengths (20–100 nt) and release them in a pH-dependent manner. We prepared MNPs encapsulating fluorescently labeled HApt and demonstrated that, compared to the free HApt, HApt encapsulated within MNPs was more efficiently taken-up and exerted more potent cytotoxic effects in SKBR3 breast cancer cells, which overexpress HER2.
Materials and methods
Synthesis of oligonucleotides
HApt (42 nt) is a trimeric concatenation of the 14 nt HApt (5′-GCAGCGGTGTGGGG-3′). HER2-negative control aptamer (NCApt) is a trimeric concatenation of a negative control oligonucleotide (5′-AGATTGCACTTACTATCT-3′).Citation40,Citation41 high performance liquid chromatography-purified HApt, NCApt, and other oligonucleotides (between 20 and 100 nt) () were commercially synthesized (Sangon Biotech Co., Ltd., Shanghai, People’s Republic of China). The dye Texas red was conjugated to the 5′-end of each oligonucleotide to enable fluorescent detection.
Table 1 Lengths, sequences, number of hairpins, and other characteristics of the synthetic oligonucleotides
Synthesis of PEG8-PDPA100-PEG8 triblock copolymers
PEG8-PDPA100-PEG8 triblock copolymers were synthesized according to the method described previously.Citation29 The pH sensitivity of PEG8-PDPA100-PEG8 was assessed using dynamic light scattering (DLS; Zetasizer Nano ZS; Malvern Instruments, Malvern, UK) and UV–vis spectroscopy (UV-2450; Shimadzu, Kyoto, Japan).
Preparation of polymeric PEG8-PDPA100-PEG8 MNPs
MNPs without oligonucleotides (unloaded MNPs) were prepared using a solvent evaporation method, as described previously.Citation29 Briefly, 3 mg of copolymer was dissolved in 1 mL of tetrahydrofuran (THF). Phosphate-buffered saline (PBS, 1 mM, pH 7.4) was added dropwise under high-speed stirring, and polymeric micelles were obtained after complete evaporation of THF. The final concentration of copolymer was adjusted to 0.3 mg/mL. Oligonucleotide-loaded MNPs (oligo-MNPs) were prepared by adding oligonucleotides dissolved in PBS in a dropwise manner to polymeric PEG8-PDPA100-PEG8 THF solution under high-speed stirring. The final concentration of oligonucleotides was adjusted to 500 nmol/L. The oligo-MNPs were transferred into dialysis tubing (molecular weight cutoff, 50,000 g/mol) and dialyzed against PBS to remove free oligonucleotides. The size and morphology of the MNPs were examined by DLS and transmission electron microscopy (TEM; JEM-1400; JEOL, Tokyo, Japan).
Circular dichroism analysis
Free and MNP-encapsulated HApt (1 μM) in PBS were analyzed using a Chirascan spectrometer (Chirascan; Applied Photophysics Ltd, Surrey, UK). Circular dichroism (CD) spectra were obtained from 300 to 200 nm using a 2 mm quartz cuvette at 25°C. The background CD spectrum of unloaded MNPs was obtained and subtracted from the CD spectrum of the HApt-MNPs.
Rates of pH-dependent release of HApt from micelles
The release profile of HApt from HApt-MNPs was studied at various pH values using a fluorescence spectrophotometer (F-4500; Hitachi, Tokyo, Japan) at 610 nm. Briefly, 2 mL of Texas red-labeled HApt-loaded micelles was sealed in a dialysis tube (molecular weight cutoff, 50,000 g/mol), placed in a beaker containing 50 mL of PBS (10 mmol/L, pH =5.0, 6.5, or 7.4) at 37°C, and the concentration of fluorescent HApt in the PBS solution was measured after different time points.
Accumulative HApt release rate (%) was calculated using A1/A2×100, where A1 is the absorption intensity of Texas red-labeled HApt at different time points and A2 is the intensity of the total amount of Texas red-labeled HApt (including free and encapsulated HApt).
Quantification of MNP uptake by HeLa cells
Human cervical carcinoma Hela cells were plated in 24-well plates (106 cells/well) and incubated for 24 h at 37°C in a 5% CO2 atmosphere. MNPs containing Texas red-labeled oligonucleotides (500 nM) were added to each well and incubated for 8 h, and then, cells were washed twice with ice cold PBS to remove excess MNPs, harvested, and resuspended in PBS. Flow cytometry was performed on a fluorescence activated cell sorting (FACS) Calibur flow cytometer (BD Biosciences, San Jose, CA, USA), and data were analyzed using FlowJo 7.6.1. Uptake of fluorescent oligonucleotides by HeLa cells was also observed using fluorescence microscopy (AMG EVOS, Mill Creek, WA, USA).
Cell viability assays
Human breast cancer cell lines MCF7 and SKBR3 and human cervical carcinoma cell line Hela were obtained from American Type Culture Collection (Manassas, VA, USA). SKBR3 cells were maintained in McCoy’s 5A medium (Thermo Fisher Scientific, Waltham, MA, USA), and HeLa cells and MCF7 cells were maintained in Dulbecco’s Modified Eagle’s Medium (DMEM; Thermo Fisher Scientific); both media were supplemented with 100 U/mL penicillin G/streptomycin sulfate and 15% (v/v) fetal bovine serum (FBS) (Thermo Fisher Scientific), and cells were cultured at 37°C in a 5% CO2 atmosphere.
Cells were seeded into collagen-coated 96-well plates (104 cells/well), incubated for 24 h, and then incubated with different concentrations of unloaded MNPs for 8 h, followed fresh complete media for 16 h. Cell viability was measured using the Cell Counting Kit-8 (CCK-8; Dojindo, Kumamoto, Japan).
To assess aptamer-mediated killing of breast cancer cells, SKBR3 or MCF7 cells were incubated in 24-well plates with free HApt or HApt-MNPs at an aptamer concentration of 100, 125, or 150 nmol/L containing McCoy’s 5A or DMEM without FBS for 8 h. Next, cells were cultured in fresh complete media for 16 h and then stained with 2 μM calcein acetoxy-methylester and 4 μM propidium iodide (PI) (Beyotime Biotechnology Co., Ltd., Nantong, People’s Republic of China) for 30 min. Cells were observed under a fluorescence microscope; live cells were stained green, and dead cells were stained red.
Apoptosis assays
An Annexin V-PI apoptosis detection kit (Signalway Antibody Co., Ltd., College Park, MD, USA) was used to assess apoptosis. SKBR3 cells cultured in 12-well plates were treated with free HApt, MNP-encapsulated HApt, or NCApt (125 nmol/L HApt or NCApt) for 8 h and then incubated in fresh complete media for 16 h. Cell apoptosis was analyzed using the FACSCalibur flow cytometry.
Confocal imaging of HApt-MNPs in SKBR3 cells
SKBR3 cells were incubated with Texas red-labeled HApt-MNPs for 8 h (HApt concentration of 125 nM), followed by fresh complete media for 16 h. Cells were washed three times with PBS, fixed in 3.7% paraformaldehyde in PBS for 15 min at room temperature, washed, permeabilized with 0.5% Triton X-100 in PBS, washed, and then incubated in 1% bovine serum albumin in PBST for 30 min at room temperature. Nuclei were counterstained with 4,6-diamidino-2-phenylindole (Sigma-Aldrich Co., St Louis, MO, USA) or Hoechst 33342 (Sigma-Aldrich Co.) for 10 min at room temperature. HApt fluorescence was examined by confocal microscopy (TCS SP8; Leica Microsystems, Wetzlar, Germany). Texas red fluorescence intensity was measured by calculating the corrected total cell fluorescence (CTCF) using ImageJ.Citation44,Citation45
HER2 immunoblotting
SKBR3 or MCF7 cells were cultured in six-well plates (106 cells/well) in complete media for 24 h. Free HApt or HApt-MNPs were added (HApt concentration of 125 nM) and incubated for 24 h, and then, cells were collected, transferred to microcentrifuge tubes, and lysed in RIPA buffer (Pierce, Appleton, WI, USA) for 30 min on ice; protein concentrations were estimated using the bicinchoninic acid (BCA) assay (Bio-Rad Laboratories Inc., Hercules, CA, USA). An equal volume of sample buffer (125 mM Tris, pH 6.8, 4% sodium dodecyl sulfate (SDS), 10% glycerol, 0.006% bromophenol blue, and 1.8% β-mercaptoethanol) was added to each sample and boiled for 35 min. Samples (15 μg total protein) were loaded onto protein precast gels (Bio-Rad Laboratories Inc.) and electrophoresed at 120 V for 90 min, and proteins were transferred to polyvinylidene fluoride (PVDF) membranes at 300 mA for 115 min in transfer buffer. The membrane was immediately placed into blocking buffer (5% nonfat dry milk, 10 mM Tris, pH 7.5, 100 mM NaCl, 0.1% Tween 20) for 1 h at room temperature and then incubated with primary anti-HER2 (rabbit; 1:10,000) or anti-β actin (rabbit; 1:5,000) antibodies (Abcam, Cambridge, UK) overnight at 4°C. The membrane was washed twice in washing buffer (10 mM Tris, pH 7.5, 100 mM NaCl, 0.1% Tween 20) and then incubated with alkaline phosphatase-conjugated antirabbit IgG secondary antibody (1:3,000; Abcam) diluted in 5% nonfat dry milk solution at room temperature. The membrane was washed three times, and protein signals were developed using enhanced chemifluorescence substrate (EMD Millipore, Billerica, MA, USA) and visualized using a Tanon 5500 (Tanon Science & Technology Co., Ltd., Shanghai, People’s Republic of China). The relative amounts of each protein were determined by quantification of the band density values using ImageJ.
Statistical analysis
The Student’s t-test was used to compare data; P-values <0.05 were considered statistically significant.
Results
Physicochemical properties and encapsulation efficiency of oligo-MNPs
The physicochemical properties of the oligo-MNPs are summarized in . The diameter of the oligo-MNPs decreased as the length of encapsulated oligonucleotide increased. Encapsulation efficiency increased as oligonucleotide length increased from 20 to 80 nt. The polydispersity index values obtained using DLS revealed the size uniformity of the oligo-MNPs. At pH 7.4, the oligo-MNPs were negatively charged and their zeta potentials exhibited small fluctuations between −32.1 and −40.1 mV, suggesting that the oligo-MNPs are electrically stabilized by forming colloidal dispersions at pH 7.4 in PBS. In acidic solution (pH <6.0), the PEG8-PDPA100-PEG8 copolymers were positively charged due to protonation of the tertiary amine groups on the PDPA residues. However, the zeta potentials became negative when the pH was changed from acidic to alkaline (starting at pH ~6.5) due to deprotonation of the PDPA residues.Citation29 Since both the empty MNPs and oligo-MNPs were prepared in PBS at pH 7.4, they were expected to display a negative surface charge and the MNPs exhibited a more negative charge after oligonucleotide encapsulation. We were unable to determine exactly how the MNPs encapsulate oligonucleotides, though the hydrophobic interactions between nucleic acids and PDPA may play a major role.
Table 2 Properties of MNPs containing oligonucleotides of different lengths
MNP-encapsulated HApt is structurally similar to free HApt
The diameter and charge of HApt-MNPs in pH 7.4 PBS were 156.8±9 nm and −35.9 mV, compared to 184.8±16 nm and −10.6 mV for unloaded MNPs (). TEM showed that the HApt-MNPs had a regular round shape and were uniformly dispersed ().
Figure 1 Characterization of the structure of HApt-MNPs.
Notes: (A) Representative TEM image of HApt-MNPs. (B) CD spectra of free HApt and HApt-MNPs (both equivalent to 1 μM HApt) were obtained from 300 to 200 nm, respectively. The CD spectrum of empty MNPs was subtracted from the CD spectrum of HApt-MNPs.
Abbreviations: HApt, human epidermal growth factor receptor 2 aptamer; MNPs, micelle-like nanoparticles; TEM, transmission electron microscopy.
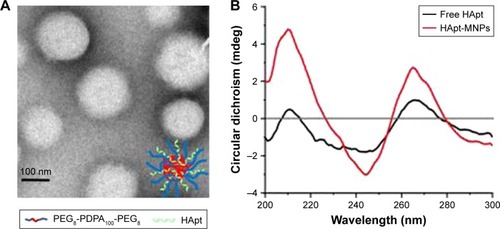
We used CD spectroscopy to investigate the structural integrity of HApt in HApt-MNPs; structural integrity is thought to be required for HApt to bind to HER2 expressed on the cell membrane.Citation41 CD spectra of free HApt and HApt-MNPs (both at 1 μM HApt) were obtained from 300 to 200 nm. The CD spectrum of empty MNPs was subtracted from the CD spectrum of HApt-MNPs. Both free HApt and MNP-encapsulated HApt exhibited positive peaks at 265 and 210 nm and a negative peak at 245 nm (). The similarity of the CD spectra for free HApt and HApt-MNPs suggests that the conformation of HApt was preserved after encapsulation. Furthermore, the peak values were much larger for HApt-MNPs than free HApt. Since the same concentrations of HApt were analyzed for free HApt and HApt-MNPs, the larger peak values for HApt-MNPs may be caused by condensation of HApt within the MNPs.Citation46–Citation48 The CD spectra of the free and MNP-encapsulated NCApt were similar ().
The rate of oligo-MNPs uptake is influenced by the length of oligonucleotide encapsulated
To assess the cellular uptake of oligo-MNPs, we incubated HeLa cells with Texas red-labeled oligo-MNPs (0.15 mg/mL MNPs, equivalent to 125 nM oligonucleotide). After the encapsulation reaction, the oligo-MNPs were purified to remove free oligonucleotides. Cellular uptake of the fluorescently labeled oligonucleotides was determined by flow cytometry. Oligonucleotides of the same length with different sequences exhibited comparable cellular uptake rates(), suggesting that oligonucleotide sequence does not have a major impact on the cellular uptake of oligo-MNPs. However, as shown in , the uptake rate declined as the oligonucleotide length increased >80 nt, suggesting that longer oligonucleotides (>80 nt) negatively affect the uptake of oligo-MNPs. The fluorescent signals were mainly localized inside the cells (). We suspect that larger portions of longer oligonucleotides will be exposed to the outside of the micelles, which may prevent oligonucleotide condensation and limit cellular uptake.
HApt is rapidly released from HApt-MNPs at pH values under pH 5.0
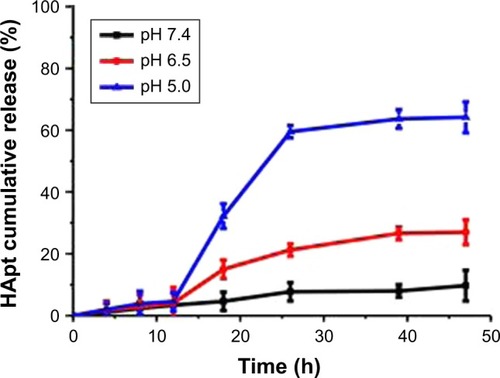
The cumulative levels of Texas red-labeled oligonucleotide were measured in vitro under different pH conditions at 37°C to examine pH-responsive release of oligonucleotides from oligo-MNPs. Under mildly alkaline conditions (pH 7.4), HApt was released slowly from HApt-MNPs, which reached 9.7%±5.0% after 47 h. Under weakly acidic conditions (pH 6.5), the release rate increased to 27%±4.0% after 47 h. However, at pH 5.0, HApt was rapidly released from as early as 12 h incubation and the level of fluorescence was nearly 60% after 26 h (). These results confirm that HApt is released from HApt-MNPs in a pH-responsive manner. HApt was not fully released at pH 5.0, consistent with our previous study.Citation29 The hydrophobic PDPA core may become gradually protonated and became swollen but not collapse under acid conditions, trapping some HApt with the core. At the same time, small amounts of HApt release may also partly explain the absorption of HApt on the dialysis tubing.
Figure 2 Release of HApt from HApt-MNPs under neutral (pH 7.4) and acidic (pH 6.5 and 5.0) conditions at 37°C.
Notes: The MNP concentration was 0.15 mg/mL, equivalent to 125 nM HApt. The pH-dependent release rates of HApt from the micelles were quantified using fluorescence spectrophotometer. Data are mean ± SD (n=3).
Abbreviations: HApt, human epidermal growth factor receptor 2 aptamer; MNPs, micelle-like nanoparticles.
HApt-MNPs are more efficiently taken up by SKBR3 cells than free HApt
We used SKBR3 breast cancer cells as a cellular model of HER2 overexpression and MCF7 cells as a model of normal/low HER2 expression.Citation49 HER2 mRNA and protein levels were examined using quantitative real-time polymerase chain reaction and Western blotting, respectively. HER2 mRNA expression was 11.3-fold higher in SKBR3 cells than in MCF7 cells (). Accordingly, HER2 protein was abundantly expressed in SKBR3 cells but barely detectable in MCF7 cells ().
SKBR3 cells were incubated with the same aptamer concentration (125 nM) of free HApt or HApt-MNPs. Confocal fluorescence microscopy showed the Texas red signals were much stronger in SKBR3 cells incubated with HApt-MNPs than free HApt at 8 h (). Moreover, after 16 h incubation, fluorescent signals were observed in distinct clusters in SKBR3 cells incubated with HApt-MNPs compared to the weaker, diffuse signals in cells incubated with free HApt. This clustering pattern suggests that the HApt-MNPs were taken up into vesicular compartments after binding to HER2 on the cell membrane.Citation38,Citation41
Figure 3 Confocal fluorescence microscopy images of SKBR3 cells incubated with Texas red-labeled free or MNP-encapsulated HApt or NCApt.
Notes: SKBR3 cells were incubated with free or MNP-encapsulated HApt or NCApt (125 nmol/L HApt or NCApt) for 8 h and then incubated in fresh complete media for 16 h. Confocal fluorescence microscopy images from three independent experiments (n=3) are shown. Fluorescently labeled aptamers are shown in red; nuclei are stained with 4, 6-diamidino-2-phenylindole (blue). All scale bars are 50 μm. CTCF was measured using ImageJ in 10 fields of view for each condition. **P<0.01 is considered statistically significant.
Abbreviations: CTCF, corrected total cell fluorescence; HApt, human epidermal growth factor receptor 2 aptamer; MNPs, micelle-like nanoparticles; NCApt, negative control aptamer.
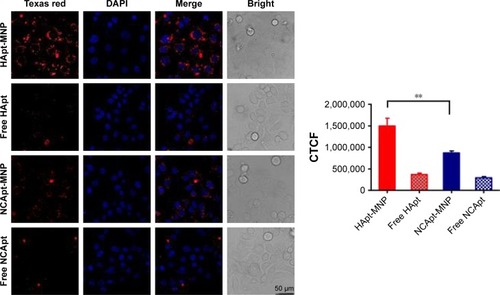
The intensity of the cellular fluorescent signals was 1.72-fold higher in SKBR3 cells incubated with HApt-MNPs (CTCF =1,497,627.0) than cells incubated with control NCApt-MNPs (CTCF =871,819.2) at the same aptamer concentration (125 nM), suggesting that cellular uptake of the HApt-MNPs partially depends on HER2-mediated endocytosis. As nanoparticles up to several hundred nanometers can enter cells via endocytosis in membrane-bound vesicles, a certain amount of HApt-MNPs and NCApt-MNPs must also have been taken up by SKBR3 cells via HER2-independent endocytosis ().
The importance of the HApt-HER2 interaction on the uptake of HApt-MNPs was also supported by flow cytometry analysis of SKBR3 and MCF7 cells. After incubation with HApt-MNPs, a lower percentage of MCF7 cells, which express low levels of HER2, was fluorescent (29.1%) compared to HER2-overexpressing SKBR3 cells (56.8%; ).
Moreover, we performed competitive assays of HApt-MNP uptake and cell viability. After 24 h preincubation of SKBR3 cells with free HApt (0.5 or 1.0 μM), the media were refreshed and the cells were incubated with HApt-MNPs (containing 100 nM HApt) for 24 h. Pretreatment with free HApt significantly decreased the efficiency of HApt-MNP uptake () as well as the mortality of the cell compared to cells treated with only HApt-MNPs (). Preincubation with the control NCApt had no apparent effect on HApt-MNP uptake or cell viability (). These results indicate that the uptake of HApt-MNPs and the resulting cell death are, at least to some extent, dependent on the HApt-HER2 interaction.
Unloaded MNPs exhibit low cytotoxicity toward breast cancer cell lines
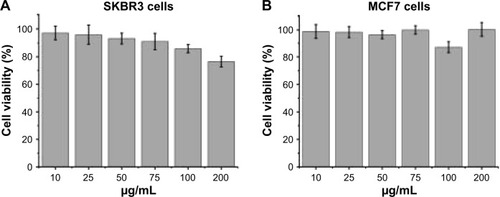
To evaluate the cytotoxicity of the unloaded MNPs toward breast cancer cells, HER2-overexpressing SKBR3 cells and HER2-underexpressing MCF7 cells were incubated with different concentrations (10–200 μg/mL) of unloaded MNPs for 8 h, followed by fresh complete media for 16 h. The CCK-8 assay showed that both cell lines remained highly viable. The percentages of viable SKBR3 and MCF7 cells were ~75 and >85%, respectively, even when incubated with the highest concentration of unloaded MNPs (200 μg/mL; ).
Figure 4 Cell viability of SKBR3 (A) and MCF7 (B) cells after incubation with different concentrations of unloaded MNPs.
Notes: Cells were incubated with different concentrations of unloaded MNPs (10–200 μg/mL) for 8 h, followed by fresh complete media for 16 h. Cell viability was measured using the CCK-8. Data are mean ± SD (n=5). Both cell lines remained highly viable after incubation with unloaded MNPs.
Abbreviations: CCK-8, Cell Counting Kit-8; MNPs, micelle-like nanoparticles.
HApt-MNPs exert a potent cytotoxic effect in HER2-overexpressing SKBR3 cells
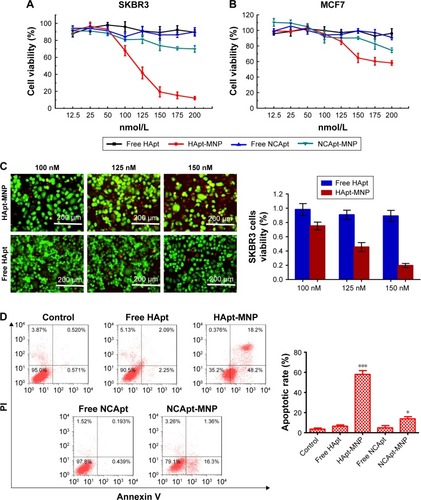
Next, we evaluated the cytotoxicity of HApt-MNPs in SKBR3 and MCF7 cells. In the CCK-8 assay, no significant cytotoxicity was observed in either SKBR3 or MCF7 cells treated with MNPs carrying the control NCApt () or unloaded MNPs (). In contrast, when the aptamer concentration was ≥125 nM, at least 60% of HER2-overexpressing SKBR3 cells were killed by HApt-MNPs, whereas only 10% of MCF7 cells were killed (). This suggested that the cytotoxicity of HApt-MNPs depends on the expression of HER2 in the target cells and was confirmed by live-dead cell staining of SKBR3 cells treated with free HApt or HApt-MNPs () and apoptosis assays of SKBR3 cells incubated with free or MNP-encapsulated HApt or NCApt (). The LD50 of HApt-MNPs in SKBR3 cells was 115 nM, while the LD50 of free HApt was >5 μM (). These data indicate that the interaction between HER2 and HApt enables HApt-MNPs to exert a specific cytotoxic effect in HER2-overexpressing cells.
Figure 5 Cell viability of SKBR3 and MCF7 cells treated with different concentrations of free HApt, free NCApt, MNP-encapsulated HApt, or MNP-encapsulated NCApt.
Notes: Cells were incubated with different concentrations of free HApt, free NCApt, MNP-encapsulated HApt, or MNP-encapsulated NCApt (HApt or NCApt concentration ranged from 12.5 to 200 nmol/L) for 8 h, followed by fresh complete media for 16 h. SKBR3 (A) and MCF7 (B) cell viability was measured using the CCK-8 assay. Data are mean ± SD (n=5). (C) Fluorescence imaging of SKBR3 cells incubated with different concentrations of free HApt or HApt-MNPs. Green (calcein-AM) and red (PI) staining indicate live and dead cells, respectively. All scale bars are 200 μm. Cell viability was determined by counting the numbers of live (green) and dead (red) cells in five fields of view per condition. Data are mean ± SD of three independent experiments. (D) Flow cytometric analysis of apoptosis in SKBR3 cells treated with free HApt, free NCApt, MNP-encapsulated HApt, or MNP-encapsulated NCApt. HApt-MNP led to a significantly higher apoptotic rate than the same concentrations of free HApt, free NCApt, or NCApt MNP. Data are mean ± SD of three separate determinations. *P<0.05 relative to untreated cells; ***P<0.001 compared to untreated cells.
Abbreviations: calcein-AM, calcein acetoxy-methylester; CCK-8, Cell Counting Kit-8; HApt, human epidermal growth factor receptor 2 aptamer; MNPs, micelle-like nanoparticles; NCApt, negative control aptamer; PI, propidium iodide.
HApt-MNPs accumulate in lysosomes and induce degradation of HER2
To demonstrate the HApt-MNPs primarily accumulate in lysosomes after cellular uptake, a lysosome tracker (LysoTracker Green) was used to stain SKBR3 cells. The cells were cultured with Texas red-labeled HApt-MNPs or free HApt for 8 h at the same HApt concentration (125 nM), followed by fresh complete media for 16 h, and then stained. The cellular Texas red signals were much stronger for HApt-MNPs (, top panel) than free HApt (, bottom panel). HApt-MNPs appeared to be distributed in a clustered pattern within SKBR3 cells, suggesting that the nanoparticles were located in the vesicular compartments after uptake. Merging the Texas red and LysoTracker signals indicated that the nanoparticles were colocalized to lysosomes. Furthermore, stronger lysosomal signals were observed in cells incubated with HApt-MNPs, suggesting more lysosomes accumulated after cellular uptake of HApt-MNPs. These results demonstrate that HApt-MNPs were more efficiently delivered to lysosomes than free HApt.
Figure 6 Lysosomal function is required for the cytotoxic effect of HApt-MNPs.
Notes: (A and B) SKBR3 cells were treated with HApt-MNPs or free HApt for 8 h at the same HApt concentration (125 nM), followed by fresh complete media for 16 h, then stained with lysosome tracker (green fluorescence) and Hoechst 33342 (blue fluorescence). (A) Confocal fluorescence microscopy images. Cellular signals were much stronger for HApt-MNPs (red, top panel) than free-HApt (red, bottom panel). Scale bars =10 μm. (B) Western blot of HER2 protein expression. β-Actin was used as a protein loading control. Mean (±SD) HER2 band intensity was 24,454.43 (±1,632.02) for HApt-MNPs and 79,276.08 (±2,162.13) for free HApt (n=3). (C and D) SKBR-3 cells were treated with HApt-MNPs (125 nM) and bafilomycin A1 (Baf) for 24 h. (C) Cell viability was assessed using the CCK-8 assay. Values are mean (±SD) of five independent experiments. (D) Western blot of HER2 protein expression. β-Actin was used as a protein loading control. Mean (±SD) HER2 band intensity was 22,714.28 (±1,326.53) for cells treated with HApt-MNPs and bafilomycin A1 and 16,424.66 (±924.12) for cells treated with HApt-MNPs without bafilomycin A1 (n=3).
Abbreviations: CCK-8, Cell Counting Kit-8; HApt, human epidermal growth factor receptor 2 aptamer; MNPs, micelle-like nanoparticles.
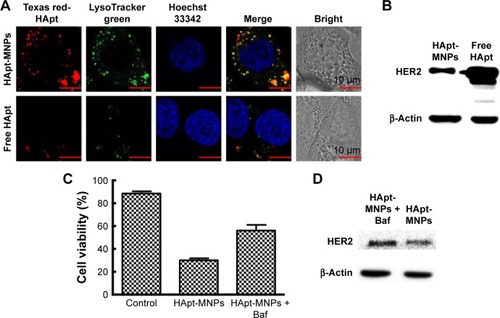
HER2 protein expression was quantified by Western blotting in cells treated for 24 h with HApt-MNPs or free HApt (). HER2 protein expression significantly decreased in cells treated with HApt-MNPs (24,454.43±1,632.02) compared to cells treated with free HApt (79,276.08±2,162.13), suggesting HApt-MNPs efficiently direct HER2 to lysosomes for degradation in HER2-overexpressing SKBR3 cells.
To determine whether the increased HER2 degradation and cytotoxic effects observed in SKBR3 cells treated with HApt-MNPs can be attributed to altered lysosomal activity, we examined whether cell viability and HER2 protein expression were affected when lysosomal function was compromised using bafilomycin A1, a macrolide antibiotic that passively permeates into lysosomes and increases lysosomal pH, which disrupts lysosomal activity.Citation50,Citation51 indicates that pretreatment with bafilomycin A1 followed by co-incubation with HApt-MNPs increased cell viability (by ~25%) and upregulated HER2 (by ~38%) compared to cells treated with the same concentration of HApt-MNPs without bafilomycin A1 to block lysosomal function (). The increase in pH inside cells treated with bafilomycin A1 was confirmed by LysoTracker Red staining (). Together, these results confirm that HApt-MNPs were released inside lysosomes at low pH.
Discussion
HER2, a member of the epidermal growth factor-related protein (ErbB) family, is commonly overexpressed on the plasma membrane in a variety of tumors, including gastric and breast cancers, mainly due to amplification of the erbB2 gene. Overexpression of HER2 on the cell surface promotes tumor progression and metastasis. Monoclonal antibodies targeting HER2 (eg, Herceptin/Trastuzumab) are clinically used to treat HER2-overexpressing metastatic gastric and breast cancers. Stimulation of the immune system (eg, ADCC) is critical for the cytotoxic of monoclonal antibodies. However, the resulting immune reactions also lead to several side effects.Citation52
The trimeric version of the HApt used in this study was initially developed by Mahlknecht et al,Citation41 who demonstrated that HApt promoted translocation of HER2 from the cell surface to the cytoplasm in HER2-overexpressing N87 gastric cancer cells, which was associated with lysosome-dependent clearance of HER2 protein. Lee et alCitation40 reported that HApt exerted a cytotoxic effect in HER2-overexpressing SKBR3 breast cancer cells. HApt has been shown to induce cross-linking of HER2 on the cell surface, resulting in the translocation of HER2 to cytoplasmic vesicles for lysosomal degradation. Furthermore, HApt-mediated HER2 degradation triggered G0/G1 phase cell cycle arrest and cell death in SKBR3 cells.Citation40,Citation41 Therefore, HApt does not exert a cytotoxic effect by directly stimulating the immune system.
Based on these previous reports, we hypothesized that our previously reported pH-responsive nanocarrierCitation29 would be ideally suited to deliver HApt to HER2-overexpressing cells. The MNPs are pH-responsive nanocarriers that encapsulate nucleic acids, which could facilitate cross-linking and thus internalization of HER2, and disassemble under acidic conditions, which may increase targeted degradation of HER2 in lysosomes. In this study, we confirmed that compared to free HApt, HApt-carrying nanoparticles (HApt-MNPs) increased HApt uptake and lysosomal transport in HER2-overexpressing SKBR3 cells ( and ). Endogenous HER2 protein expression decreased significantly in cells treated with HApt-MNPs compared to cells treated with free HApt (). When lysosome activity was blocked, cell viability and HER2 protein expression increased in cells treated with HApt-MNPs compared to cells treated with the same concentration of HApt-MNPs alone (). Cell viability and apoptosis assays showed that HApt-MNPs exerted a more potent cytotoxic effect in SKBR3 cells than free HApt (). Collectively, these data demonstrate that HApt-MNPs exert a specific cytotoxic effect in HER2-overexpressing SKBR3 cells.
Several factors may contribute to the more potent cytotoxic effects of HApt-MNPs than free HApt. First, the MNP nanoparticles increased the delivery of HApt into HER2-overexpressing cells compared to free HApt. Second, the pH-responsive release property of HApt-MNPs ensured that the encapsulated HApt cargo was released in endosomes/lysosomes. Third, the MNPs increase the local concentration of HApt: aggregation of HApt on MNPs would increase the ability of HApt to cross-link to HER2 on the cell surface.
The ability of MNPs to remain stable at normal physiological pH is beneficial, as it prolongs their retention time in the blood circulation and thereby greatly reduces the adverse effects of the drug cargo in normal tissues.Citation37,Citation39 Moreover, pH-sensitive release of HApt from MNPs in the endosomal or lysosomal compartments (pH 4.0–6.5) would result in rapid intracellular release of HApt in the target cells.Citation53,Citation54 Our lysosome activity inhibition experiments confirmed that the release of HApt inside the cell was dependent on low lysosomal pH. Furthermore, HApt must maintain the correct structure during loading and unloading within MNPs to retain its cytotoxic activity. We used CD spectroscopy to show that the conformation of HApt is likely to be preserved after encapsulation within MNPs. Together these properties indicate that MNPs are a promising candidate for effective delivery of HApt to HER2-overexpressing cancer cells. Further studies are needed to evaluate the cytotoxic effect of HApt-MNPs in vivo.
These findings also indicate that MNPs could be used for the delivery of a range of oligonucleotides. Oligonucleotides ranging in length from 20 to 100 nt were efficiently encapsulated, with optimal encapsulation at 50 to 80 nt. The size of the MNPs declined as the length of encapsulated oligonucleotide increased. This indicates large single-stranded nucleic acids coil back on themselves due to complementary base pairing (hairpin structure) to form highly compacted supercoiled molecules.Citation55,Citation56 Further studies are necessary to determine whether supercoiling of long oligonucleotides suppresses the cellular uptake of oligo-MNPs.
Conclusion
Our pH-responsive and lysosome-targeting nanoparticle system can efficiently deliver a therapeutic oligonucleotide in vitro. The HApt-MNPs were translocated to lysosomes, where HApt was rapidly released at low pH. Therefore, MNPs may have the potential to improve the delivery and efficacy of nucleic acid-based cancer therapies.
Author contributions
All authors contributed toward data analysis, drafting and critically revising the paper and agree to be accountable for all aspects of the work.
Acknowledgments
Financial support for this work was provided by the National Natural Science Foundation of China (nos 31400123 and 21276074) and Research Funds from Shanghai Municipal Commission of Health and Family Planning (no 201440567).
Supplementary materials
Figure S1 Circular dichroism spectra of free and MNP-encapsulated HER2-NCApt.
Notes: The concentration of NCApt is 1 μM. Both free and MNP-encapsulated NCApt exhibited positive peaks at 190 and 280 nm and negative peaks at 210 and 250 nm. The stronger peak signals associated with MNP-encapsulated NCApt suggest that NCApt was successfully encapsulated and condensed, while remaining conformationally unchanged.
Abbreviations: MNP, micelle-like nanoparticles; NCApt, negative control aptamer.
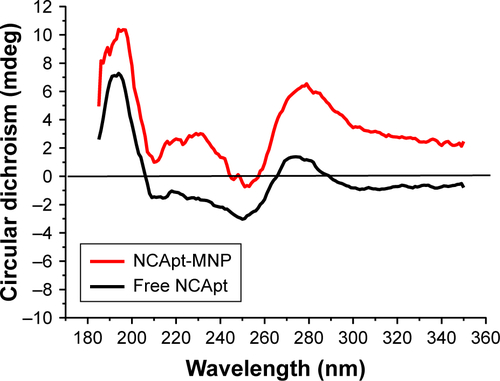
Figure S2 Representative fluorescent microscopy images of the uptake of Texas red-labeled oligonucleotide-MNPs by HeLa cells.
Notes: Texas red signals were mainly localized inside the cells. All scale bars are 100 μm.
Abbreviations: HApt, human epidermal growth factor receptor 2 aptamer; MNPs, micelle-like nanoparticles; NCApt, negative control aptamer; nt, nucleotide.
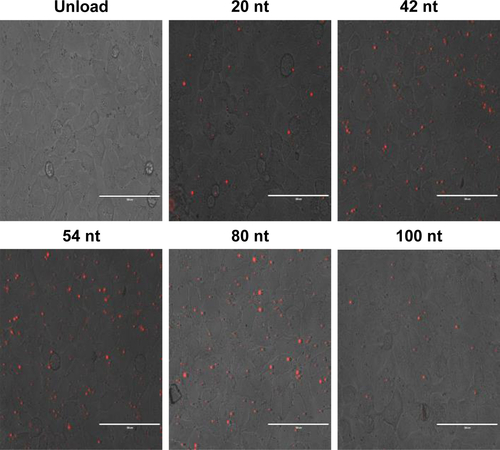
Figure S3 HER2 mRNA and protein expressions in SKBR3 and MCF7 breast cancer cell lines.
Notes: (A) HER2 mRNA expression was quantified by quantitative reverse transcription polymerase chain reaction. Total RNA was extracted using TRIzol reagent (Thermo Fisher Scientific, Waltham, MA, USA), reverse transcribed using PrimeScript RT reagent Kit (TaKaRa, Dalian, People’s Republic of China) according to the manufacturer’s instructions, and amplified using SYBRPremix Ex Taq (TaKaRa). PCRs were performed in triplicate with the following conditions: 95°C/30 s, 40 cycles of 95°C/5 s, 60°C/15 s, and 72°C/10 s on a Stratagene MXP3000 cycler (Stratagene, La Jolla, CA, USA) and repeated at least three times. Relative mRNA levels were calculated using the −ΔΔCt method using β-actin as a control and expressed as 2−ΔΔCt. The primer pairs were as follows: β-actin-f/β-actin-r: CTGGGACGACATGGAGAAAA/AAGGAAGGCTGGAAGAGTGC; HER2-f/HER2-r: GCAGCTTCATGTCTGTGCC/ACAGAGACTCAGACCCTGGC. Mean ± SD values for three independent experiments are presented. Significant differences were determined using the Student’s t-test, ***P<0.001. (B) HER2 protein expression was analyzed by Western blotting. β-Actin was used as a protein loading control.
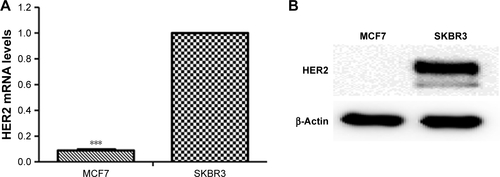
Figure S4 FACS analysis of the uptake of Texas red-labeled HApt-MNPs by SKBR3 and MCF7 cells.
Notes: Cells were incubated with HApt-MNPs (HApt concentration of 125 nM) for 8 h, followed fresh complete media for 16 h. The cellular uptake of HApt-MNPs was assessed by FACS. The percentage of fluorescent cells was much lower for MCF7 cells (which express no/low levels of HER2 as the HER2 gene is not amplified) compared to HER2-overexpressing SKBR3 cells (56.8%).
Abbreviations: FACS, fluorescence activated cell sorting; HApt, human epidermal growth factor receptor 2 aptamer; MNPs, micelle-like nanoparticles.
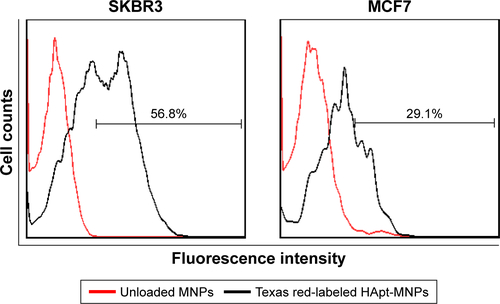
Figure S5 Competition binding, uptake and cell viability assays.
Notes: After a 24 h preincubation with free HApt (0.5 or 1.0 μM), the media were refreshed and SKBR3 cells were incubated with HApt-MNPs (100 nM HApt) for 24 h. Uptake was assessed by determining percentage of fluorescent cells using flow cytometry. (A) Pretreatment with 1.0 μM free HApt decreased the efficiency of HApt-MNP uptake (Texas red-labeled, TA-HApt-MNPs) by 36.1% (from 78.5 to 42.4%) compared to cells treated with only HApt-MNPs. (B) Pretreatment with 1.0 μM free HApt increased the number of viable cells (10.6%) compared to cells treated with only HApt-MNPs (40.2%). Mean ± SD values for three independent experiments are presented. Preincubation with the control NCApt had no significant effects on HApt-MNP uptake or cell viability.
Abbreviations: HApt, human epidermal growth factor receptor 2 aptamer; MNPs, micelle-like nanoparticles; NCApt, negative control aptamer; TA, Texas red.
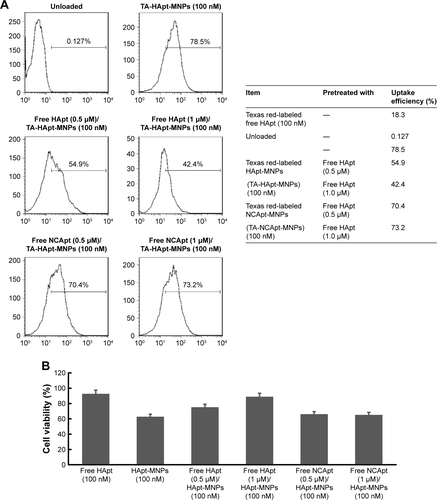
Figure S6 Viability of SKBR3 cells after treatment with different concentrations of free HApt or NCApt.
Notes: Cells were incubated with 0.2–5 μM of free HApt or free NCApt for 8 h, followed fresh complete media for 16 h. Then, cell viability was assessed using the CCK-8 assay. Mean ± SD values for three independent experiments are presented. Approximately 55.1% of SKBR3 cells treated with 5 μM free HApt were nonviable, compared to only 13.9% of cells treated with 5 μM free NCApt.
Abbreviations: CCK-8, Cell Counting Kit-8; HApt, human epidermal growth factor receptor 2 aptamer; NCApt, negative control aptamer.
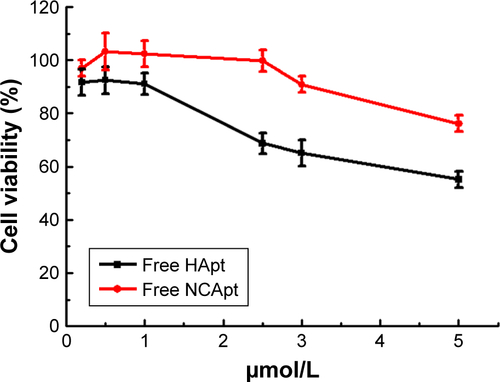
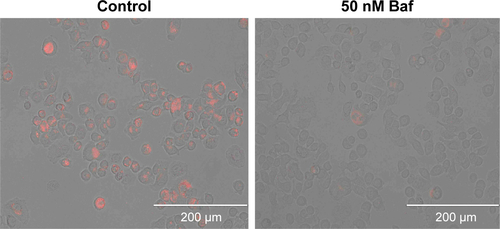
Figure S7 LysoTracker Red staining of bafilomycin Al-treated cells.
Notes: SKBR3 cells cultured in a 24-well plate were incubated with McCoy’s 5A media containing 50 nM bafilomycin A1 (Baf) (TOCRIS, Bristol, UK) dissolved in DMSO for 1 h at 37°C, followed by 50 nM LysoTracker Red (YEASEN Biotech Co., Ltd., Shanghai, People’s Republic of China) for 30 min, washed three times with PBS, and then examined by fluorescence microscopy (AMG EVOS, Mill Creek, WA, USA). For control experiments, 1% DMSO was added to the medium. In the control group, the intensity of red-fluorescence was rather strong but faded sharply after the addition of bafilomycin A1, indicating an increase in lysosomal pH. Scale bars are 200 μm.
Abbreviations: DMSO, dimethyl sulfoxide; PBS, phosphate-buffered saline.
Disclosure
The authors report no conflicts of interest in this work.
References
- AdairJEBeardBCTrobridgeGDExtended survival of glioblastoma patients after chemoprotective HSC gene therapySci Transl Med20124133133ra57
- MorganRADudleyMEWunderlichJRCancer regression in patients after transfer of genetically engineered lymphocytesScience2006314579612612916946036
- RobbinsPFMorganRAFeldmanSATumor regression in patients with metastatic synovial cell sarcoma and melanoma using genetically engineered lymphocytes reactive with NY-ESO-1J Clin Oncol201129791792421282551
- GinnSLAlexanderIEEdelsteinMLAbediMRWixonJGene therapy clinical trials worldwide to 2012 – an updateJ Gene Med2013152657723355455
- LiRBurasELeeJGene therapy with neurogenin3, betacellulin and SOCS1 reverses diabetes in NOD miceGene Ther2015221187688226172077
- LiCZhangLChenYLinXLiTProtective role of adenovirus vector-mediated interleukin-10 gene therapy on endogenous islet β-cells in recent-onset type 1 diabetes in NOD miceExp Ther Med20161151625163227168782
- StewartDJHiltonJDArnoldJMAngiogenic gene therapy in patients with nonrevascularizable ischemic heart disease: a phase 2 randomized, controlled trial of AdVEGF(121) (AdVEGF121) versus maximum medical treatmentGene Ther200613211503151116791287
- SundararamanSMillerTJPastoreJMKiedrowskiMArasRPennMSPlasmid-based transient human stromal cell-derived factor-1 gene transfer improves cardiac function in chronic heart failureGene Ther201118986787321472007
- BunnellBAMorganRAGene therapy for infectious diseasesClin Microbiol Rev199811142569457428
- HashibaTSuzukiMNagashimaYAdenovirus-mediated transfer of heme oxygenase-1 cDNA attenuates severe lung injury induced by the influenza virus in miceGene Ther20018191499150711593363
- IvacikDElyAFerryNArbuthnotPSustained inhibition of hepatitis B virus replication in vivo using RNAi-activating lentivirusesGene Ther201522216317125338920
- WhiteheadKALangerRAndersonDGKnocking down barriers: advances in siRNA deliveryNat Rev Drug Discov20098212913819180106
- SoutschekJAkincABramlageBTherapeutic silencing of an endogenous gene by systemic administration of modified siRNAsNature2004432701417317815538359
- GaoSDagnaes-HansenFNielsenEJThe effect of chemical modification and nanoparticle formulation on stability and biodistribution of siRNA in miceMol Ther20091771225123319401674
- KawabataKTakakuraYHashidaMThe fate of plasmid DNA after intravenous injection in mice: involvement of scavenger receptors in its hepatic uptakePharm Res19951268258307667185
- JafariMSoltaniMNaahidiSKarunaratneDNChenPNonviral approach for targeted nucleic acid deliveryCurr Med Chem201219219720822320298
- MellottAJForrestMLDetamoreMSPhysical non-viral gene delivery methods for tissue engineeringAnn Biomed Eng201341344646823099792
- GiaccaMZacchignaSVirus-mediated gene delivery for human gene therapyJ Control Release2012161237738822516095
- AtkinsonHChalmersRDelivering the goods: viral and non-viral gene therapy systems and the inherent limits on cargo DNA and internal sequencesGenetica2010138548549820084428
- DuanDSystemic delivery of adeno-associated viral vectorsCurr Opin Virol201621162527459604
- ChailertvanitkulVAPoutonCWAdenovirus: a blueprint for non-viral gene deliveryCurr Opin Biotechnol201021562763220638266
- ZhiDZhangSWangBZhaoYYangBYuSTransfection efficiency of cationic lipids with different hydrophobic domains in gene deliveryBioconjug Chem201021456357720121120
- RudzinskiWEAminabhaviTMChitosan as a carrier for targeted delivery of small interfering RNAInt J Pharm2010399111120732398
- ElzoghbyAOSamyWMElgindyNAProtein-based nanocarriers as promising drug and gene delivery systemsJ Control Release20121611384922564368
- YinLSongZKimKHReconfiguring the architectures of cationic helical polypeptides to control non-viral gene deliveryBiomaterials20133492340234923283350
- SunXZhangNCationic polymer optimization for efficient gene deliveryMini Rev Med Chem201010210812520408796
- DandekarPJainRKeilMCellular delivery of polynucleotides by cationic cyclodextrin polyrotaxanesJ Control Release2012164338739322789529
- YamadaHLoretzBLehrCMDesign of starch-graft-PEI polymers: an effective and biodegradable gene delivery platformBiomacromolecules20141551753176124684536
- HaoWLiuDShangYZhangJXuSLiuHpH-Triggered copolymer micelles as drug nanocarriers for intracellular deliveryRSC Adv20166352914929158
- WangSShenYZhangJXuSLiuHA designed lipopeptide with a leucine zipper as an imbedded on/off switch for lipid bilayersPhys Chem Chem Phys20161815101291013727009364
- LajunenTNurmiRKontturiLLight activated liposomes: functionality and prospects in ocular drug deliveryJ Control Release2016244pt B15716627565215
- MiYWolframJMuCEnzyme-responsive multistage vector for drug delivery to tumor tissuePharmacol Res2016113pt A929927546164
- HaoWHanXShangYXuSLiuHInsertion of pH-sensitive bola-type copolymer into liposome as a “stability anchor” for control of drug releaseColloids Surf B Biointerfaces201513680981626539807
- NeedhamDMcIntoshTJLasicDDRepulsive interactions and mechanical stability of polymer-grafted lipid membranesBiochim Biophys Acta19921108140481643080
- TorchilinVPOmelyanenkoVGPapisovMIPoly(ethylene glycol) on the liposome surface: on the mechanism of polymer-coated liposome longevityBiochim Biophys Acta19941195111207918551
- ChengRMengFDengCKlokHAZhongZDual and multi-stimuli responsive polymeric nanoparticles for programmed site-specific drug deliveryBiomaterials201334143647365723415642
- NavarroGPanJTorchilinVPMicelle-like nanoparticles as carriers for DNA and siRNAMol Pharm201512230131325557580
- VivekRThangamRNipunBabuVMultifunctional HER2-antibody conjugated polymeric nanocarrier- based drug delivery system for multi-drug-resistant breast cancer therapyACS Appl Mater Interfaces2014696469648024780315
- MünsterPNMarchionDCBassoADRosenNDegradation of HER2 by ansamycins induces growth arrest and apoptosis in cells with HER2 overexpression via a HER3, phosphatidylinositol 30-kinase-AKT-dependent pathwayCancer Res200262113132313712036925
- LeeHDamDHHaJWYueJOdomTWEnhanced human epidermal growth factor receptor 2 degradation in breast cancer cells by lysosome-targeting gold nanoconstructsACS Nano20159109859986726335372
- MahlknechtGMaronRManciniMSchechterBSelaMYardenYAptamer to ErbB-2/HER2 enhances degradation of the target and inhibits tumorigenic growthProc Natl Acad Sci U S A2013110208170817523630281
- RohHPippinJDrebinJADown-regulation of HER2/neu expression induces apoptosis in human cancer cells that overexpress HER2/neuCancer Res200060356056510676637
- YardenYSliwkowskiMXUntangling the ErbB signalling networkNat Rev Mol Cell Biol20012212713711252954
- McCloyRARogersSCaldonCELorcaTCastroABurgessAPartial inhibition of Cdk1 in G 2 phase overrides the SAC and decouples mitotic eventsCell Cycle20141391400141224626186
- BurgessAVigneronSBrioudesELabbéJCLorcaTCastroALoss of human Greatwall results in G2 arrest and multiple mitotic defects due to deregulation of the cyclin B-Cdc2/PP2A balanceProc Natl Acad Sci U S A201010728125641256920538976
- FasmanGDCircular dichroism and the conformational analysis of biomoleculesPlenum19967215257
- LinPHYenSLLinMSMicrocalorimetrics studies of the thermodynamics and binding mechanism between L-tyrosinamide and aptamerJ Phys Chem B2008112216665667318457441
- NagatoishiSTanakaYTsumotoKCircular dichroism spectra demonstrate formation of the thrombin-binding DNA aptamer G-quadruplex under stabilizing-cation-deficient conditionsBiochem Biophys Res Commun2007352381281717150180
- NeveRMChinKFridlyandJA collection of breast cancer cell lines for the study of functionally distinct cancer subtypesCancer Cell200610651552717157791
- YoshimoriTYamamotoAMoriyamaYFutaiMTashiroYBafilomycin A1, a specific inhibitor of vacuolar-type H(+)-ATPase, inhibits acidification and protein degradation in lysosomes of cultured cellsJ Biol Chem19912662617707177191832676
- DragowskaWHWepplerSAWangJCInduction of autophagy is an early response to gefitinib and a potential therapeutic target in breast cancerPLoS One2013810e7650324146879
- NahtaREstevaFJHerceptin: mechanisms of action and resistanceCancer Lett2006232212313816458110
- MengFZhongYChengRDengCZhongZpH-sensitive polymeric nanoparticles for tumor-targeting doxorubicin delivery: concept and recent advancesNanomedicine (Lond)20149348749924746192
- LeeESGaoZYouHBRecent progress in tumor pH targeting nanotechnologyJ Control Release2008132316417018571265
- HiggsPGRNA secondary structure: physical and computational aspectsQ Rev Biophys200033200019925311191843
- MiyoshiDSugimotoNMolecular crowding effects on structure and stability of DNABiochimie20089071040105118331845