Abstract
Anti-HER2 antibody conjugated with quantum dots (anti-HER2ab-QDs) is a very recent fluorescent nanoprobe for HER2+ve breast cancer imaging. In this study we investigated in-vivo toxicity of anti-HER2ab conjugated CdSe/ZnS QDs in Wistar rats. For toxicity evaluation of injected QDs sample, body weight, organ coefficient, complete blood count (CBC), biochemistry panel assay (AST, ALT, ALP, and GGTP), comet assay, reactive oxygen species, histology, and apoptosis were determined. Wistar rat (8–10 weeks old) were randomly divided into 4 treatment groups (n = 6). CBC and biochemistry panel assay showed nonsignificant changes in the anti-HER2ab-QDs treated group but these changes were significant (P < 0.05) in QDs treated group. No tissue damage, inflammation, lesions, and QDs deposition were found in histology and TEM images of the anti-HER2ab-QDs treated group. Apoptosis in liver and kidney was not found in the anti-HER2ab-QDs treated group. Animals treated with nonconjugated QDs showed comet formation and apoptosis. Cadmium deposition was confirmed in the QDs treated group compared with the anti-HER2ab-QDs treated group. The QDs concentration (500 nM) used for this study is suitable for in-vivo imaging. The combine data of this study support the biocompatibility of anti-HER2ab-QDs for breast cancer imaging, suggesting that the antibody coating assists in controlling any possible adverse effect of quantum dots.
Introduction
Nanomaterials are emerging tools for diagnosis of various diseases and many other biomedical applications because of their unique properties rather than bulk materials.Citation1–Citation3 Nanomaterial toxicity is a matter of concern and many in-vitro and in-vivo studies have suggested that the surface chemistry, release of metal ion, reactive oxygen species (ROS) production, cell apoptosis and break-down of nanomaterials are the possible causes of cellular toxicity.Citation4–Citation7 A new emerging class of nanomaterials known as QDs are brightly fluorescent, enabling their use as imaging probes in both in-vitro and in-vivo systems, viz, molecular, cellular, and in-vivo imaging, tumor targeting, lymph node imaging, surface receptor targeting, and labeling.Citation8–Citation17 QDs can be coupled with biomolecules such as antibodies, peptides, carbohydrates, and small molecules to target early stage malignant tumors for imaging and diagnosis.Citation18–Citation21
The big challenge with the use of QDs is toxicity in living cells and animals due to their chemical composition of toxic heavy metal atoms (eg, cadmium, mercury, lead, arsenic).Citation6,Citation22–Citation25 In-vitro toxicity is one of the most studied to date but few in-vivo studies have analyzed the physiological behavior of QDs.Citation6,Citation26,Citation27 Previous studies have shown ambiguous results. Some in-vitro studies indicated cellular toxicityCitation28,Citation29 but others showed that cells loaded with QDs survived for weeks without alteration in cell growth and division.Citation30 The nature of QDs in an in-vivo system might be very different from that in an in-vitro system because the QDs can persist in organ tissues and directly interact with the living environment. Some in-vivo studies have shown the time-dependent increase in cadmium concentration in the liver and kidney after intravenous administration of cadmium-based QDsCitation31 but other in-vivo studies have shown no sign of toxicity in embryonic development at a concentration of 5 × 10⁹ QDs/cell.Citation32 A study on Sprague-Dawley rats indicated no severe toxicity of CdSe/ZnS QDs for both short- (7 days) and long-term (80 days) exposure but some deposition of QDs in organ tissue was found.Citation24
QDs cytotoxicity can be explained due to the release of Cd2+ ions and generation of ROS.Citation4,Citation5,Citation33 Various strategies have been reported to minimize QDs toxicity, the most common of which are surface modifications and coatings with biocompatible molecules.Citation28,Citation29 Various types of primary and secondary coatings are used to enhance biocompatibility of QDs for medical applications. Capping these QDs with ZnS shells or coating with bovine serum albumin (BSA), polyethylene glycol (PEG), glutathione, and silica rendered the QD cores less susceptible to oxidative degradation and less toxic.Citation5,Citation34,Citation35 A study showed that the PEGylation of cationic QDs reduced toxicity at the same concentration compared to non-PEGylated QDs.Citation25 QDs coating with additional biocompatible molecules (antibody, peptide, and small ligands) is also useful to control toxicity.
HER2 is a cell surface receptor found on the surface of certain cancer cells. HER2 is an orphan receptor because no known ligand is expressed for this receptor. It is encoded by a specific gene, the HER2/neu gene. The HER proteins regulate cell growth, survival, adhesion, migration and cell differentiation. Overexpression of HER2 receptor is one cause of breast cancer, known as HER2-positive breast cancer. Anti-HER2 antibody (ab) (herceptin) is the only recommended biological therapy for treatment of HER2-positive patients; after binding with HER2 receptor, anti-HER2ab checks cell division in breast tumors. QDs have been widely studied for cancer imaging and diagnosis, and anti-HER2ab-QDs has shown promising results for HER2 breast cancer detection.Citation17,Citation36,Citation37 This QDs conjugate offers great hope in early stage breast cancer imaging and diagnosis. The study reported investigates the in-vivo toxicity of anti-HER2-ab coated CdSe/ZnS QDs because this is useful for proper implementation of anti-HER2ab-QD conjugate for HER2 breast cancer imaging and diagnosis.
Materials and methods
Chemicals
The following chemicals, all analytical grade, were used: quantum dot antibody binding kit (Qdot 525, Invitrogen, San Diego, CA), liver function assay kit (Transasia, India), YO-PRO-1 apoptosis assay kit (Invitrogen), anti-HER2 antibody (Invitrogen), propidium iodide (PI) (Sigma-Aldrich, St Louis, MO), heparins (Sigma-Aldrich), N, N-diethyl-pera-phenylenediam (DEPPD) (Sigma-Aldrich), DCF-DA (Sigma-Aldrich), ethidium bromide (Sigma-Aldrich), Triton X-100 (Sigma-Aldrich), LMP agarose (Sigma-Aldrich), NM agarose (Sigma-Aldrich), anesthetic ether, ketamine/xylazine cocktail anesthesia, xylene, phosphate buffer saline, formalin, NaCl, NaOH, Na2HPO4, K2HPO4, HCl, H2O2, KOH, KCl, DMSO, EDTA, coomassie brilliant blue, phosphoric acid, ethanol, and lead citrate. All chemicals used were analytical grade.
Amino (PEG)-QDs conjugation with anti-HER2 antibody
Solution preparation for conjugation reaction
Conjugation of QDs with anti-HER2-ab was performed according to the manual provided with the QDs antibody conjugation kit (Qdot 525, Invitrogen, USA). Antibody solution (300 μL at a concentration of 1.0 mg/mL) was prepared in PBS and 40 μL of distilled water was added to the supplied dye labeled marker and mixed well. The solution mixture was stored at 2 to 6°C.
QDs nanocrystals activation and antibody reduction
To a centrifuge tube, 14 μL SMCC (Succinimidyl-4-(N-maleimidomethyl) cyclohexane-1-carboxylate) and 125 μL QD nanocrystals were added and vortexed briefly to mix and incubated at 37°C for 1 hour. Anti-HER2 antibody (300 μL at 1.0 mg/mL) and di-thiothriol (6.1 μL) solution were added to a centrifuge tube and incubated for 30 minutes at room temperature. After incubation the mixture was desalted and QDs and antibody collected in a separate tube.
QDs conjugation with anti-HER2 antibody
Reduced antibody and activated QD nanocrystals collected from the above reactions were mixed with each other and incubated for 1 hour at room temperature. The reaction was quenched by adding 10 μL (10 mM) 2-mercaptoethanol solutions to the conjugation reaction and incubated for 30 minutes at room temperature.
Separation of conjugates and nonconjugates
A gel filtration column was used for separation of anti-HER2ab-QDs from nonconjugated QDs. In brief, the conjugates collected as described above were added immediately to the two ultrafiltration devices (∼40 μL total volumes), allowed to enter the gel column, and then 50 μL PBS (pH 7.2) was gently added. The sample was allowed to elute by gravity. The first 10 drops were collected from the column because subsequent drops may have contained nonconjugated antibody molecules.
QDs characterization
QDs and anti-HER2ab-QDs were characterized by transmission electron microscopy (TEM) and dynamic light scattering (DLS). After ultrasonication for 10 minutes, the sample was prepared by placing a drop of homogeneous suspension on a copper grid with a lacey carbon film and allowing it to dry in air. TEM images were observed with a JEOL-JEM-2100F TEM operating at 200 klV. The hydrodynamic diameters of QDs were evaluated by DLS. Samples were loaded into a sample holder and DLS data were collected by using a Malvern DLS apparatus (Nano-ZS, Malvern Instruments, Malvern, UK) with a 633 nm He/Ne laser.
Animal treatment
The Wistar rat was selected as the model for the toxicity study of anti-HER2ab-QDs. All animals were kept in an animal house at 12 hours day/night cycle for 2 months. Food and water were supplied ad libitum. All animal were kept in stress-free, hygienic, and animal-friendly conditions. Wistar rats (8–10 weeks old) without tumors were selected randomly and divided into 4 treatment groups with 6 animals in each group. QDs and anti-HER2ab-QDs (100 μL of 500 nM solution) were injected intravenously twice in the tail vein, once on day 0 and once on day 15. One group (control group) was injected with PBS. Another group was selected of the size of the treated animal group in case of sudden death. All animals were anesthetized with an anesthesthetic cocktail of 0.3 mL/250 g ketamine/xylazine (ketamine/xylazine cocktail: 100 mg/mL ketamine + 20 mg/mL xylazine). The tail injection site was cleaned with xylene. The experiment was approved by the Animal Ethics Committee, Jawaharlal Nehru University, New Delhi, India and followed committee recommendations.
Blood sampling and complete blood count
Blood samples were collected routinely weekly from control and treated animals for complete blood count analysis. Blood (1.0 mL) was taken from the retro-orbital sinus by a heparin-coated capillary and collected with 20 mg/mL EDTA anticoagulant. Before taking the blood, animals were anesthetized with 0.3 mL/250 mg ketamine/xylazine. All animals were sacrificed at the same time and 5.0 mL blood was collected from a heart puncture. Of this sample, 1 mL was collected in 10% EDTA for complete blood count (CBC) and the remaining 4 mL of blood serum was collected for biochemistry panel assay and other biochemical assay.
The blood was analyzed for the number of erythrocytes, platelets, and total leukocytes, as well as neutrophils, lymphocytes, monocytes, eosinophils, and basophiles by an automated hematology counter (KX-21, Sysmex, Transasia, India).
Biochemistry panel analysis
We choose enzymatic parameters related to liver and kidney function. We determined the levels of various enzymes such as aspartate aminotransferase (AST), alanine aminotrasferase (ALT), gamma-glutamyl transpeptidase (GGTP), alkaline phosphatase (ALP), and total protein, albumin, globulin, bilirubin, and creatinine. Biochemistry assay for AST, ALT, ALP, and GGTP was performed according to the International Federation for Clinical Chemistry kinetics method and bilirubin by the diazo method. Total protein, albumin, and globulin were assayed by the method of Bradford.Citation38 In brief, for each sample, 200 μL serum was mixed in 800 μL of Bradford reagent. Optical density (at 595 nm) was measured after 10 minutes incubation in the dark. BSA was used as a standard protein. AST, ALT, ALP, and GGTP assay was performed with an enzyme assay kit using end-point method and data obtained by spectrophotometry (Erba CHEM-5 Plus v2).
Reactive oxygen species assay from serum
The ROS assay was performed by N, N-diethyl-pera-phenylenediamine (DEPPD) staining.Citation39 In brief, 5 μL serum was added to 140 μL of 0.1 M sodium acetate buffer (pH 4.8) at 37°C in a 96-well plate (microtiter plate). Samples were taken in triplicate and 100 μL of the mixed DEPPD solution (DEPPD was dissolved in 0.1 M sodium acetate buffer [pH 4.8]) and ferrous sulfate (4.37 μm ferrous sulfate dissolved in 0.1 M sodium acetate buffer, pH 4.8) at a ratio of 1:25 was added to each well to initiate reaction. Thereafter, the microtiter plate was then incubated at 37°C for 5 minutes. Absorbance was measured by a spectrophotometer plate reader (Spectra Max M2) at 505 nm. ROS levels from serum were calculated from a calibration curve of H2O2 and expressed as hydrogen peroxide equivalent (1 unit = 1.0 mg H2O2/L). The calibration curve for standard solution was obtained by calculating slopes from an optical density graph.
Comet assay from blood
A comet assay (also referred to as single-cell gel electrophoresis) was used to determine DNA damage. Cell lysate was prepared from blood after centrifugation at 1500 rpm for 5 minuntes. For primary coating, one-sided frosted glass plates were coated with 0.7% low melting point agarose. Cell lysate was prepared with prechilled lysis solution (2.5 M NaCl, 0.1 M EDTA, 10 mM Tris base, pH 10) with 1% Triton X 100 (Sigma-Aldrich) for 1 hour at 4°C and 10 μL cell lysate was embedded in 0.7% low melting point agarose on one-sided frosted comet slides. Cells were then subjected to denaturation in alkaline buffer (0.3 M NaCl, 1 mM EDTA) for 1 hour in the dark at room temperature. After lysing overnight, the slides were removed and placed in a horizontal slab of an electrophoresis assembly. One liter of electrophoresis buffer was gently poured into the assembly. All plates were electrophorsed at 0.7 V/cm and 250 mA for 30 minutes. The slides were neutralized in neutralization buffer (0.5 M Tris-HCl, pH 7.5) for 20 minutes followed by dehydration in 70% ethanol. All slides were air dried at room temperature and stained with 5 μg/mL PI dye. The tail length, tail moments, and tail migration were measured by using Comet Assay IV software (Perspective Instruments, Haverhill, Suffolk, UK) as a function of DNA damage. For measurement, 25 comets were scored and analyzed for each sample.
Body weight and coefficients of organs
Body weight of all animals was recorded after sacrifice by an excess dose of anesthetic ether and cervical dislocation. Organs such as liver, kidney, spleen, and brain were removed and weight was measured immediately after removal. After weighing the body and organs, the coefficients of liver, kidney, spleen, and brain weight to body weight were calculated as the ratio of tissue wet weight (g) to body weight (g).
Microscopic analysis of organ tissue
Liver, kidney, and spleen were removed and fixed with 10% formalin. Organ samples were embedded in paraffin, sectioned, and stained with hematoxylin and eosin. Liver, kidney, and spleen slides were examined by light microscopy through a 40× objective lens by a blinded veterinary pathologist.
For TEM analysis of liver and kidney, small pieces of tissue (∼2 mm) were fixed in 2.5% gluteraldehyde for 2 to 4 hours and washed in 0.2 M phosphate-buffered saline (PBS). Post fixation was done with 1% osmium tetra-oxide for 1 hour. Cells were washed in PBS and dehydrated in alcohol (50%, 70%, 80%, 95%, and 100%). Cells were further treated with propylene oxide (30 minutes), propylene oxide-resin mixture (overnight), and pure resin (48 hours). Embedding was done in BEEM (better equipment for electron microscopy) capsules using pure Spurr’s low viscosity resin at 80°C for 48 hours. Ultrathin sections (70 nm) were taken using Leica EM UC 6 ultramicrotom and stained with 1% lead acetate. Sections were examined under JEOL-JEM-2100F TEM operating at 200 kV.
Quantitative assay of cadmium
Liver and kidney of all animals were removed and burned at 200°C for 20 minutes, 1.0 g organ powder was used for EDXRF analysis. Pressed powdered samples were prepared by using 10 tons pressure to the sample, boric acid used with organ powder as a supporter base. Cadmium concentration was analyzed in pressed powdered sample with energy dispersive X-ray fluorescence (EDXRF) spectroscopy (Epsilon5 PANalytical).
Cell apoptosis
Single cell suspension was prepared, washed in cold PBS and the cell density was adjusted to ∼1 × 10⁶ cells/mL in PBS. Assay was done according to the manual provided with apoptosis assay kit (Molecular Probe, Invitrogen). In brief, 1 mL assay volume was added to 1 μL YO-PRO stock solution and 1 μL PI stock solution to each 1 mL of cell suspension. Samples were incubated on ice for 20 to 30 minutes. Samples were analyzed for stained cells by flow cytometry, using 488 nm excitation with green fluorescence emission for YO-PRO-1 (ie, 530/30 band pass) and red fluorescence emission for PI (ie, 610/20 band pass), gating on cells to exclude debris. The cell population was separated into 3 groups: live cells showed a low level of green fluorescence, apoptotic cells showed an incrementally higher level of green fluorescence, and dead cells showed both red and green fluorescence.
Statistical analysis
Statistical analysis was performed with a 2-sample t-test, unknown and unequal variances, comparing each sample group to the related control group at a significance level of 0.05 (95%). The results are presented as mean ± standard deviation (SD).
Results
QDs characterization
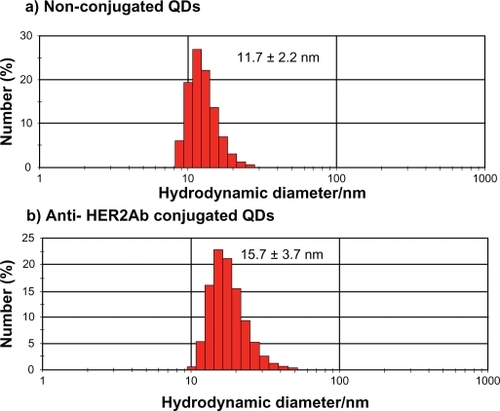
QDs were characterized by TEM () and DLS (). In the TEM image, clusters of nanoparticles showed the inorganic core of QDs. Images taken by TEM showed a 5 to 7 nm size range of nonconjugated QDs and anti-HER2ab-QDs. Only the core of the QDs could be imaged by TEM; DLS analysis was done for hydrodynamic size measurement. Hydrodynamic diameter of anti-HER2ab-QDs in PBS characterized by DLS was 15.7 ± 3.7 nm, while the diameter of nonconjugated PEG-QDs was 11.7 ± 2.2 nm. Results from DLS clearly indicated the antibody molecule binding with QDs.
Figure 1 TEM image of quantum dots (QDs) and anti-HER2ab-QDs. Bar size is 20 nm in both images and analysis was done at 200 kv.
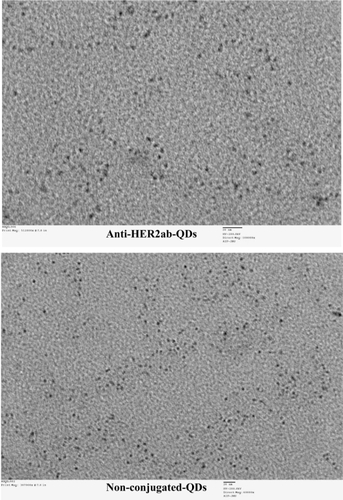
Figure 2 Dynamic light scattering histogram for hydrodynamic diameter detection of quantum dots (QDs) and anti-HER2ab-QDs in 10 mM PBS buffer: a) QDs (525 nm) and b) anti-HER2ab-QDs (525 nm). The hydrodynamic sizes of the QDs and anti-HER2ab-QDs were 11.7 nm and 15.7 nm, respectively.
Body weight and organ coefficients
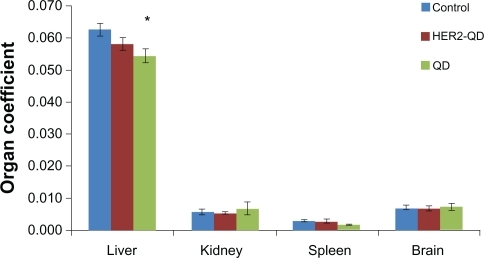
Throughout the study no animals showed any unusual response. No behavioral changes were found in any group. Body weight increased nonsignificantly with age during the experiment () and no weight loss was found in any experimental group. No significant changes were found in organ coefficients of liver, kidney, spleen, and brain in any treatment group except QDs treated liver and kidney (). Upon injection, and throughout the entire study, no unusual behavior or differences between groups were observed, including labored breathing, difficulties in moving, hunching, or unusual interactions with cage mates.
Figure 3 Body weight of Wistar rats following injection of quantum dots (QDs) and anti-HER2ab-QDs. Mean and standard deviation of body weight of Wistar rats treated with QDs, anti-HER2ab-QD, and phosphate buffered saline control were not significantly different over a 2-month period.
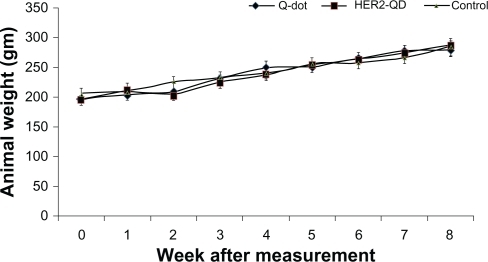
Figure 4 Coefficient of organs (liver, kidney, spleen, and brain) for Wistar rats treated with quantum dots (QDs), anti-HER2ab-QDs and PBS. Coefficient of organs is the ratio of weight of the organs (g) to animal weight (g). No significant difference found at α = 0.05. Statistical analysis was performed with a 2-sample t-test, unknown and unequal variances, comparing each sample group to the related control group.
Note: *denotes statistically significant results at α = 0.05.
Hematology results
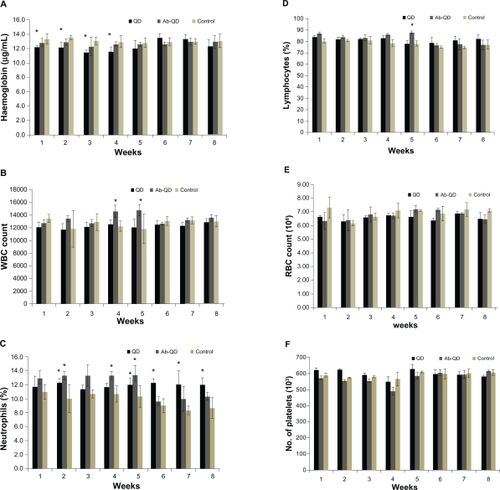
No significant changes in CBC were found in any treatment group except hemoglobin concentration and white blood cell count (WBC) count in the QDs treated group. After 3 weeks, hemoglobin concentration had significantly decreased in the QDs treated group but no decrease was measured at the end of the experiment, and no significant changes were observed in any other treatment group (). WBC count, especially lymphocytes and neutrophils, significantly increased (P < 0.05) in the QDs treated group (). RBC count nonsignificantly changed in all treated groups (). There were no significant changes in platelets count throughout the experiment in any group as compared to control ().
Figure 5 Hematology analysis for the Wistar rats treated with quantum dots (QDs), anti-HER2-ab-QDs, and phosphate buffered saline. A–F) These results show mean and standard deviation of hemoglobin (A), white blood cells (B), neutrophils (C), lymphocytes (D), red blood cell count (E), and platelets (F). Error bars represent standard deviation. Statistical analysis was performed with a 2-sample t-test, unknown and unequal variances, comparing each sample group to the related control group.
Note: *denote statistically significant results at α = 0.05.
Biochemistry panel assay for organs function
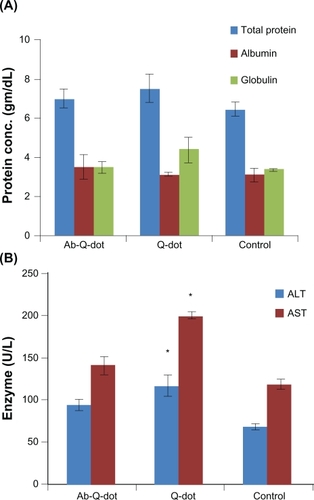
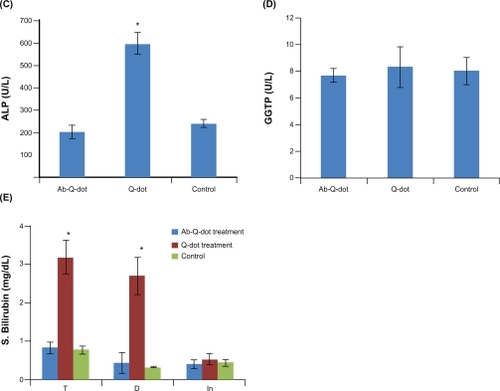
Changes in the level of total protein, albumin, and globulin were not significant in any experimental group while the levels of ALT, AST, and ALP increased significantly (P < 0.05) in QDs treated group. The changes were nonsignificant in the anti-HER2ab-QDs treated group (). The increase in GGTP level was directly associated with kidney function while the increase in the level of bilirubin was directly associated with liver function. Changes in GGTP level were nonsignificant and bilirubin level increased significantly in both the QDs and anti-HER2ab-QDs treated groups ().
Figure 6 Biochemistry panel assays from Wistar rats treated with quantum dots (QDs), anti-HER2ab-QDs, and phosphate buffered saline. A–E) Results illustrate mean and standard deviation of total protein, albumin, globulin (A), AST and ALT (B), ALP (C), GGTP (D), and bilirubin (total, direct, indirect) (E). Error bars represent standard deviation. Statistical analysis was performed with a 2-sample t-test, unknown and unequal variances, comparing each sample group to the related control group.
Note: *denotes statistically significant result at α = 0.05.
ROS estimation
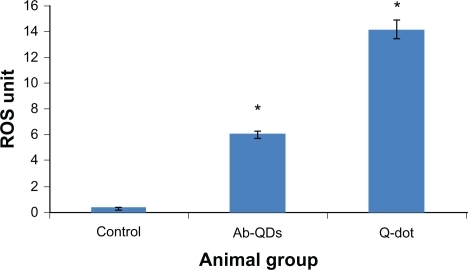
An increase in ROS level was detected in both QDs and anti-HER2ab-QDs treated groups. ROS increase was higher in both anti-HER2ab-QDs and QDs treated groups than in the control. In QDs treated animals a significantly higher increase was observed compared with control and anti-HER2ab-QDs treated animals. ROS was 6 U in the anti-HER2ab-QD group and 14 U in QDs treated animals. These results indicate that the HER2ab coated QDs are less toxic than noncoated QDs ().
Figure 7 N, N-diethyl-pera-phenylenediamine (DEPPD) assay for reactive oxygen species (ROS) measurement from the blood serum of Wistar rats treated with quantum dots (QDs) and anti-HER2ab-QDs.
Note: 1 ROS unit = 1 mg/L H2O2.
Cadmium concentration in liver and kidney
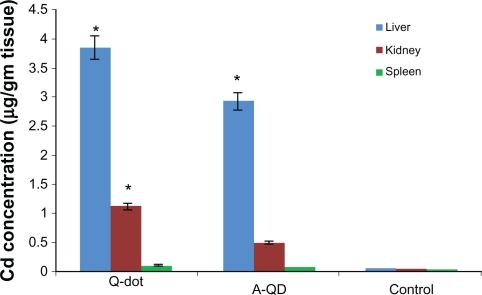
Cadmium concentration in liver, kidney, and spleen was calculated by energy dispersive X-ray fluorescence (EDXRF) spectroscopy and expressed in μg/gm tissue (). In QDs treated animals the concentrations of cadmium in liver and kidney were 3.85 ± 0.06 μg and 1.12 ± 0.1 μg, respectively, higher than in anti-HER2ab-QDs (2.9 ± 0.12 μg, 0.49 ± 0.05 μg) and control (0.05 ± 0.01 μg, 0.034 ± 0.01 μg) animals, respectively. In spleen concentrations in QDs, anti-HER2ab-QDs, and control samples were 0.11 ± 0.02, 0.073 ± 0.01 and 0.021 ± 0.01 μg, respectively.
Figure 8 Concentration of cadmium in liver, kidney and spleen of Wistar rats treated with quantum dots (QDs), anti-HER 2ab-QDs, and phosphate buffered saline. Results show mean and standard deviation of cadmium in liver, kidney, and spleen powder.
Note: *denotes statistically significant results at α = 0.05.
Comet assay for DNA damage
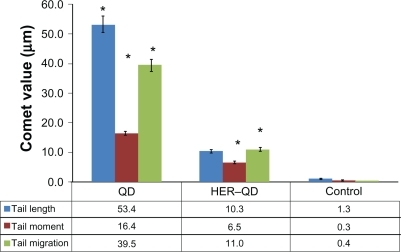
shows the comet assay genotoxicity study results for QDs and anti-HER2ab-QDs treated animals. Slides were assayed for single strand DNA breaks. It is evident from the graph that the comet length was higher in QDs treated samples than anti-HER2ab-QDs and its corresponding control. Tail lengths were 53.4 ± 2.5 μm, 10.3 ± 1.2 μm, and 1.3 ± 0.2 μm in QDs, anti-HER2ab-QD, and control groups, respectively. Tail migration was 39.5 ± 2.1 μm, 11.0 ± 0.6 μm, and 0.4 ± 0.03 μm and tail moment was 16.4 ± 1.3, 6.5 ± 0.4, and 0.3 ± 0.01 in QDs, anti-HER2ab-QD, and control groups, respectively.
Figure 9 Graphical representation of comet assay from blood sample of quantum dots (QDs) and anti-HER2ab-QDs treated Wistar rats. X-axis indicates treatment group of animal and y-axis represent comet values (tail moment, tail migration, and tail length). Statistical analysis was performed with a 2-sample t-test, unknown and unequal variances, comparing each sample group to the related control group. Comet analysis was done by Comet assay IV software (Perspective Instruments, UK).
Note: *denotes the level of significance at α = 0.05.
Microscopic examination
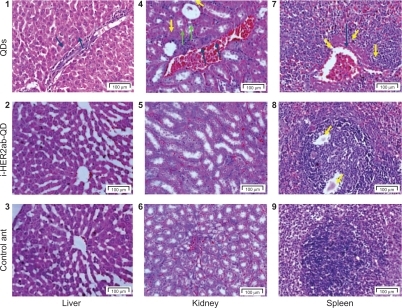
Histological assessment of tissues was conducted to determine whether or not the QDs themselves or their degradation products cause tissue damage, inflammation, or lesions resulting from toxic exposure. Overall, no apparent histopathological abnormalities or lesions were observed in liver, kidney, and spleen of anti-HER2ab-QDs treated animal. QDs treated animals exhibited moderate bile-duct hyperplasia in liver with concurrent moderate centrilobular fibrosis, mild pigment accumulation, and moderate multifocal necrosis. Representative histology results are shown in . In kidney tubular dilatation, cast formation, mineralization, and inflammation were noted in QDs treated group and moderate inflammation also noted in anti-HER2ab-QDs animals.
Figure 10 Liver, kidney and spleen histology. Hematoxylin and eosin stains of liver (1–3), kidney (4–6), and spleen (7–9) tissues of Wistar rats injected with phosphate buffered saline, quantum dots (QDs), and anti-HER2ab-QDs. One-headed arrow indicates tissue damage (yellow), mineralization (green), and protein fluid (black).
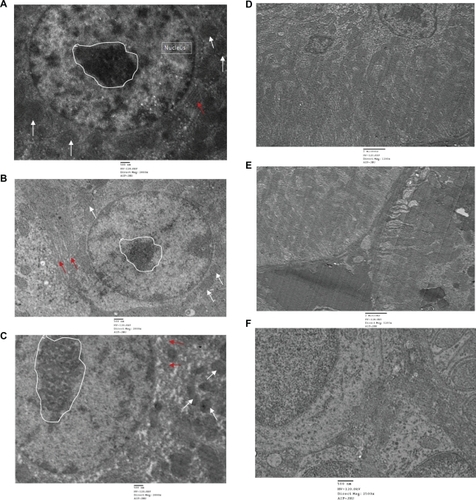
In order to investigate the toxicity of QDs and the deposition within the cells or on the cellular membrane, TEM was performed in all treated group by using single staining. Liver and kidney of treated and untreated animals showed no abnormality and cellular damage in any treated group (). Liver cells showed no damage. Rough endoplasmic reticulum, mitochondrial compartment, and nuclear membrane did not show any deformity. QDs and anti-HER2ab-QDs seemingly do not damage the liver and kidney. Single staining was used to relocate QDs nanocrystals in the TEM image.
Figure 11 TEM images of liver and kidney of quantum dots (QDs) and anti-HER2ab-QDs treated Wistar rats: A) control (liver), B) animals treated with QDs (liver), C) animals treated with anti-HER2ab-QDs, D) control kidney, E) animals treated with QDs, F) animals treated with anti-HER 2ab-QDs. Single staining was used for all TEM analysis. Random circle in the image show nucleolus, arrow in white color show mitochondria and red arrow indicate RER (rough endoplasmic reticulum).
Cell apoptotic study
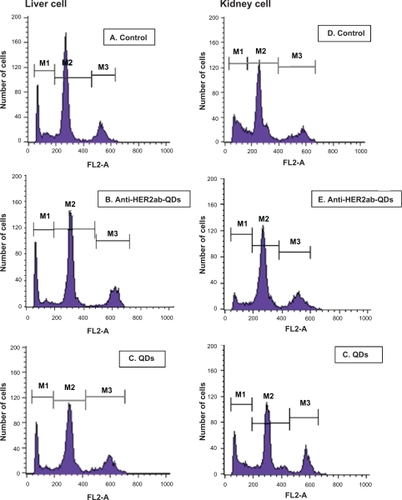
Apoptotic cells are permeable to YO-PRO-1 green fluorochrome and impermeable to PI. Thus, use of combined YO-PRO-1 and PI dyes provides a sensitive indicator for apoptosis. Typical histograms of liver and kidney cells labeled with YO-PRO-1/PI are shown in . Using YO-PRO-1/PI, 3 peaks of cells were clearly detected: i) necrotic cells, labeled with PI, M1 peak, ii) living cells, with low permeability membranes, M2 peak, and iii) apoptotic cells (ie, living cells with modified membranes, M3 peak. Induction of apoptosis in the liver and kidney cells increased the number of living cells exhibiting a high permeability to YO-PRO-1 (). Treatment with QDs increased the proportion of cells exhibiting high permeability to YO-PRO-1 () compared to control and anti-HER2ab-QDs treated groups (). Data indicated that the nonconjugated QDs induced apoptosis to some extent but anti-HER2ab-QDs and control group animals showed no apoptosis.
Figure 12 Live/dead cell viability assay of the liver and kidney of Wistar rats treated with 100 μL of 500 nM quantum dots (QDs) and anti-HER2ab-QDs. Typical histograms of YO-PRO-1/PI stained liver and kidney cells. A–C) liver cells (control, anti-HER2ab-QDs, and QD respectively); D–F) kidney cells (control, anti-HER2ab-QDs, and QD respectively).
Discussion
Because of the increasing use of QDs in biomedical research, it has become extremely important to understand the impact and toxicity of QDs on cells and ultimately on the living system. Very few in-vivo toxicity studies of QDs have been published and some of these have suggested that surface coating of QDs is one of the dominant factors determing toxicity.Citation40 A research group in Toronto University showed that the QDs are nontoxic in low concentrations, which can be used for bioimaging.Citation24 It has also been reported by another group that QDs at low or high doses do not affect phenotypic response in cells.Citation41 In our findings, no unusual physiological responses were shown in any treated group. Body weight increased according to age in all groups and no significant decrease was observed in any treated group (). Nonsignificant changes in organ coefficients in all groups indicated no severe damage, tumor progression, or inflammation in any major organ, such as liver, kidney, spleen, and brain (). QDs samples were intravenously injected in all animal groups, interacting in the whole body first with blood and its components. Interaction of QDs with blood components and the release of Cd2+ ions may cause various immunogenic responses, inflammation, and changes in hematological factors such as WBCs, platelets, hemoglobin, and the blood components involved in RBC maturation.Citation42 Changes in hematological parameters were nonsignificant in all treated groups except WBC count () (P < 0.05). Where WBCs counts differed, the percentage of lymphocytes responded differently from that of neutrophils. WBCs returned to the control value within 6 weeks, while neutrophils levels changed significantly during the whole experiment compared with control. These changes can be associated with immunogenic response of QDs because the size of the QDs used in this study is very close to the size of immunogens.Citation43,Citation44 The changes in WBCs count were nonsignificant in Wistar rats treated with anti-HER2-ab coated CdSe QDs,Citation24 because the nanocrystals are less toxic when their surface is better protected by coating with various biocompatible materials.
The clearance rate of nanoparticles from the body depends on their size and the coated materials used. QDs biocompatibility is directly associated with its rate of clearance from the body.Citation45 Long-term deposition of the QDs may be hazardous to the body. EDXRF results indicates an increased level of cadmium in liver and kidney of QDs treated animals, but cadmium level was not significantly high in the spleen.Citation26 From the EDXRF results QDs deposition was evident in liver and kidney of QDs treated animals (). It is evident from previous studies that the long-term deposition may cause changes in the blood serum enzymatic composition, inflammation, tissue damage, and genotoxic effect.Citation29,Citation46,Citation47 Serum proteins and the level of particular enzymes in blood serum are good indicators of hepatocellular injury, hepatic inflammation, kidney function impairment, and cholestesis (reduction in flow of bile juice).Citation48 ALP concentration decreased significantly (P < 0.05) in the QDs treated group but the changes were nonsignificant in the anti-HER2ab-QDs group (). An increase in ALP is directly associated with liver function. A very high ALP level indicates abnormality in liver and kidney function. Elevated serum ALP activity is related to be symptomatic of that found in liver diseases, biliary system, and to those of pancreas. GGTP level did not significantly change in any group. On the other hand, ALT and AST levels significantly increased in the QDs treated group but not in the anti-HER2ab-QDs group. Changes in ALT and AST levels are indicators of hepatocellular level damage. An increased level of these enzymes in QDs treated group confirms impairment of hepatic function. Biochemical results indicated that the anti-HER2ab-QDs were not toxic to animal systems in the concentrations used for this experiment, while QDs treated animals showed significant changes ().
Generation of ROS by CdSe QDs has been reported by many groups.Citation29,Citation49 Increased ROS can produce high amounts of H2O2 in the cellular environment, resulting in modification to and damage of cellular components, such as lipids, proteins, and DNA.Citation50,Citation51 ROS are known to mediate cell death in a variety of cell types. A previous study reported production of ROS by nonconjugated CdSe/ZnS QDs in the presence and absence of light.Citation49 In our findings ROS level was higher in the QDs treated group than in anti-HER2ab-QDs and control groups (). An increase in ROS level is the indicator of toxicity induced by QDs, which was lower in anti-HER2ab-QDs treated animal group.Citation29 On the other hand, the higher comet tail migration noted in the QDs group indicates genotoxicity (). In the genotoxicity study, tail migration was slightly higher in the anti-HER2ab-QDs group than in control, because the QDs core was highly protected in the anti-HER2ab-QDs treated animals and the rate of clearance was high. The potential breakdown of QDs with time and the persistence of Cd2+ and Se2– ions over a week or two in the liver and kidney is directly associated with toxicity. Previous studies have shown that bare QDs can injure cells, inducing damage to the plasma membrane, mitochondrion, and nucleus.Citation29
Histological examination of liver, kidney and spleen did not show severe toxicity but inflammation was observed in the liver of QDs treated animals. Spleen and kidney also indicated some moderate pathological symptom but no evident symptoms were found in anti-HER2ab-QDs treated animals ().Citation24 QDs deposition was not evident in TEM analysis of the liver and kidney. No evidence of tissue damage appeared in TEM image analysis and the cellular structure was intact (). A loss of plasma membrane integrity is considered an early event in necrosis and a late event in apoptosis.Citation24,Citation46,Citation47 Nuclear condensation with DNA fragmentation is a mark of apoptotic cell death, whereas, in necrosis, nuclei are swollen. Cell apoptosis was not evident in liver and kidney of the anti-HER2ab-QDs treated group (). Overall, the findings indicate that anti-HER2ab-QDs are not toxic in the concentrations used above. Usually the concentrations used for in-vitro and in-vivo bioimaging are less than the concentrations we tested for toxicity assessment. This study supports the use of anti-HER2ab-QDs for breast cancer bioimaging. Anti-HER2ab-QDs can be used as probe for breast tumor detection at the initial stage tumor. These QDs can also be conjugated with other antibody and small ligand for imaging, diagnosis and drug targeting of other cancer types.
Acknowledgements
The author (DKT) is thankful to the Council of Scientific and Industrial Research (CSIR), India for fellowship grant during the period of study (award No. 09/263 (0706)/2008/EMR-I). The authors would also like to thank Advance Research Instrumentation Facility, JNU staff for help in TEM and ED-XRF analysis and School of Life Sciences, JNU staff for FACS analysis.
Disclosure
The authors disclose no conflicts of interest.
References
- AlivisatosAPThe use of nanocrystals in biological detectionNat Biotechnol200422475214704706
- FerrariMCancer nanotechnology: opportunities and challengesNat Rev Cancer2005516117115738981
- NiemeyerCMNanoparticles, proteins, and nucleic acids: biotechnology meets materials scienceAngew Chem Int Ed20014041284158
- DerfusAMChanWCWBhatiaSNProbing the cytotoxicity of semiconductor quantum dotsNano Lett200441118
- KirchnerCLiedlTKuderaSCytotoxicity of colloidal CdSe and CdSe/ZnS nanoparticlesNano Lett2005533133815794621
- HardmanRAToxicological review of quantum dots: toxicity depends on physicochemical and environmental factorsEnviron Health Perspect200611416517216451849
- Ryman-RasmussenJPRiviereJEMonteiro-RiviereNASurface coatings determine cytotoxicity and irritation potential of quantum dot nanoparticles in epidermal keratinocytesJ Invest Dermatol200712714315316902417
- HoodJDBednarskiMFraustoRTumor regression by targeted gene delivery to the neovasculatureScience20022962404240712089446
- DuncanRPolymer conjugates as anticancer nanomedicinesNat Rev Cancer2006668870116900224
- CouvreurPVauthierCNanotechnology: intelligent design to treat complex diseasePharm Res2006231417145016779701
- MoghimiSMHunterACMurrayJCLong-circulating and target-specific nanoparticles: theory to practicePharmacol Rev20015328331811356986
- TorchilinVPMicellar nanocarriers: pharmaceutical perspectivesPharm Res20072411617109211
- McCarthyJRKellyKASunEYWeisslederRTargeted delivery of multifunctional magnetic nanoparticlesNanomedicine2007215316717716118
- HarisinghaniMGBarentszJHahnPFNoninvasive detection of clinically occult lymph-node metastases in prostate cancerN Engl J Med20033482491249912815134
- RhynerMNSmithAMGaoXHMaoHYangLNieSMQuantum dots and multifunctional nanoparticles: new contrast agents for tumor imagingNanomedicine2006120921717716110
- XingYChaudryQShenCBioconjugated quantum dots for multiplexed and quantitative immunohistochemistryNat Protoc200721152116517546006
- WuXYLiuHJLiuJQImmunofluorescent labeling of cancer marker Her2 and other cellular targets with semiconductor quantum dotsNat Biotechnol200221414612459735
- GaoXHCuiYYLevensonRMChungLWKNieSMIn-vivo cancer targeting and imaging with semiconductor quantum dotsNat Biotechnol20042296997615258594
- LiuZCaiWBHeLNIn-vivo biodistribution and highly efficient tumor targeting of carbon nanotubes in miceNat Nanotech200724752
- WeisslederRKKellyEYSunTShtatlandLJCell-specific targeting of nanoparticles by multivalent attachment of small moleculesNat Biotechnol2005231418142316244656
- LeeESNaKBaeYHPolymeric micelle for tumor pH and folate-mediated targetingJ Control Release20039110311312932642
- KimSLimYTSolteszEGNear infrared fluorescent type II quantum dots for sentinel lymph node mappingNat Biotechnol200322939714661026
- GeysJNemmarAVerbekenEAcute toxicity and prothrombotic effects of quantum dots: impact of surface chargeEnviron Health Perspect20081161607161319079709
- TanyaSHRobinEAHansCFSusanNWarrenCWCIn-vivo quantum-dot toxicity assessmentSmall20096138144
- TanSJJanaNRGaoSPatraPKYingJYSurface-ligand-dependent cellular interaction, subcellular localization, and cytotoxicity of polymer-coated quantum dotsChem Mater20102222392247
- FischerHLiuLPangKChanWCWPharmacokinetics of nanoscale quantum dots: in-vivo distribution, sequestration, and clearance in the ratAdv Funct Mater20061612991305
- BallouBLagerholmBErnstLBruchezMWaggonerANon-invasive imaging of quantum dots in miceBioconjugate Chem2004157986
- HoshinoAFujiokaKOkuTPhysicochemical properties and cellular toxicity of nanocrystal quantum dots depend on their surface modificationNano Lett2004421632169
- LovrićJChoJSWinnikFMMaysingerDUnmodified cadmium telluride quantum dots induce reactive oxygen species formation leading to multiple organelle damage and cell deathChem Biol2005121227123416298302
- JaiswalJKMattoussiHMauroJMSimonSMLong-term multiple color imaging of live cells using quantum dot bioconjugatesNat Biotechnol200321475112459736
- YangRHChangLWWuJPPersistent tissue kinetics and redistribution of nanoparticles, quantum dot 705, in mice: ICP-MS quantitative assessmentEnviron Health Perspect20071151339134317805425
- DubertretBSkouridesPNorrisDJNoireauxVBrivanlouAHLibchaberAIn-vivo imaging of quantum dots encapsulated in phospholipid micellesScience20022981759176212459582
- ChoSJMaysingerDJainMRoderBHackbarthSWinnikFMLong-term exposure to CdTe quantum dots causes functional impairments in live cellsLanguir20072319741980
- MaysingerDBehrendtMLalancette-HerbertMKrizJReal-time imaging of astrocyte response to quantum dots: in-vivo screening model system for biocompatibility of nanoparticlesNano Lett200772513252017638392
- JinTFujiiFKomaiYSekiJSeiyamaAYoshiokaYPreparation and characterization of highly fluorescent, glutathione-coated near infrared quantum dots for in-vivo fluorescence imagingInt J Mol Sci200892044206119325735
- ChenCPengJXiaHQuantum-dot-based immunofluorescent imaging of HER2 and ER provides new insights into breast cancer heterogeneityNanotechnology20102195101
- TadaHHiguchiHWatanabeTMOhuchiNIn-vivo real-time tracking of single quantum dots conjugated with monoclonal anti-HER2 antibody in tumors of miceCancer Res2007671138114417283148
- BradfordMMA rapid and sensitive for the quantitation of microgram quantitites of protein utilizing the principle of protein-dye bindingAnal Biochem197672248254942051
- HayashiIMorishitaYImaiKNakamuraMNakachiKHayashiTHigh throughput spectrophotometric assay of reactive oxygen species in serumMut Res2007631556117499011
- LiHCZhouQFLiuWYanBZhaoYJiangGBProgress in the toxicological researches for quantum dotsSci China Ser B Chem200851393400
- ZhangTStilwellJLGerionDCellular effect of high doses of silica-coated quantum dot profiled with high throughput gene expression analysis and high content cellomics measurementsNano Lett2006680080416608287
- KarmakarRBhattacharyaRChatterjeeMBiochemical, haematological and histopathological study in relation to time-related cadmium-induced hepatotoxicity in miceBioMetals20001323123911127895
- ShinSHYeMKKimHSKangHSThe effects of nanosilver on the proliferation and cytokine expression by peripheral blood mononuclear cellsInt Immunopharmacol200771813181817996693
- KimSChoiJEChoiJOxidative stress-dependent toxicity of silver nanoparticles in human hepatoma cellsToxicol in-vitro2009231076108419508889
- ChoiHSLiuWMisraPRenal clearance of quantum dotsNat Biotechnol2007251165117017891134
- SchipperMLRatchfordNNDavisCRA pilot toxicology study of single-walled carbon nanotubes in a small sample of miceNat Nanotechnol2008321622118654506
- BhabraGSoodAFisherBNanoparticles can cause DNA damage across a cellular barrierNat Nanotech20094876883
- DufourDRLottJANolteFSGretchDRKoffRSSeeffLBDiagnosis and monitoring of hepatic injury. II. Recommendations for use of laboratory tests in screening, diagnosis, and monitoringClin Chem2000462027
- GreenMHowmanESemiconductor quantum dots and free radical induced DNA nickingChem Comm (Camb)2005121123
- PrestwichEGRoyMDRegoJKelleySOOxidative DNA strand scission induced by peptidesChem Biol20051269570115975515
- OberdorsterGMaynardADonaldsonKPrinciples for characterizing the potential human health effects from exposure to nanomaterials: elements of a screening strategyPart Fibre Toxicol20052816209704