
Abstract
Background
Alzheimer’s disease (AD) is a neurodegenerative disorder characterized by progressive cognitive and memory impairment. It is the most common neurological disease that causes dementia. Soluble amyloid-beta oligomers (AβO) in blood or cerebrospinal fluid (CSF) are the pathogenic biomarker correlated with AD.
Methods
A simple electrochemical biosensor using graphene oxide/gold nanoparticles (GNPs) hydrogel electrode was developed in this study. Thiolated cellular prion protein (PrPC) peptide probe was immobilized on GNPs of the hydrogel electrode to construct an AβO biosensor. Electrochemical impedance spectroscopy was utilized for AβO analysis.
Results
The specific binding between AβO and PrPC probes on the hydrogel electrode resulted in an increase in the electron-transfer resistance. The biosensor showed high specificity and sensitivity for AβO detection. It could selectively differentiate AβO from amyloid-beta (Aβ) monomers or fibrils. Meanwhile, it was highly sensitive to detect as low as 0.1 pM AβO in artificial CSF or blood plasma. The linear range for AβO detection is from 0.1 pM to 10 nM.
Conclusion
This biosensor could be used as a cost-effective tool for early diagnosis of AD due to its high electrochemical performance and bionic structure.
Video abstract
Point your SmartPhone at the code above. If you have a QR code reader the video abstract will appear. Or use:
Introduction
Alzheimer’s disease (AD) is a common neurodegenerative disorder in old people and the most common cause of dementia. The accumulation of beta-amyloid interferes with the synapse function and contributes to the damage of neurons.Citation1 According to World Alzheimer Report 2016, there are 47.5 million people living with dementia in the world and 7.7 million new cases every year. The total estimated worldwide cost of dementia is 818 billion USD.Citation2 New techniques for early diagnosis and prevention of AD are being developed to decrease the huge economic burden.
Misfolding and aggregation of amyloid-beta (Aβ) is the potential pathological mechanism of AD. Aβ monomers can be assembled into Aβ oligomers (AβO) and fibrils and then distributed into the cerebrospinal fluid (CSF) or blood circulation. AβO are considered to be the most neurotoxic form and more closely correlated with the severity of AD than insoluble aggregates.Citation3 The study of Gong et al shows that the concentration of AβO was found to be up to 70-fold higher in AD patients than that in nondemented controls.Citation4 With regard to its close relationship with AD development, AβO is considered as a core biomarker for AD, especially in the early stage of AD.Citation5
Current techniques for AβO analysis can be classified as qualitative and quantitative methods. The qualitative methods, such as circular dichroism (CD) spectroscopy and Fourier-transform infrared spectroscopy (FTIR), are used to study protein conformational changes.Citation6,Citation7 Western blot is a semiquantitative method for special recognition of AβO.Citation8,Citation9 Examples of quantitative analysis are enzyme-linked immunosorbent assay (ELISA),Citation10 fluorescent assays,Citation11,Citation12 surface-enhanced Raman spectroscopy,Citation13 flow cytometry,Citation14 surface plasmon resonance nanosensor,Citation15 and so on. The abovementioned methods usually need expensive monoclonal antibodies, fluorescent dye, or sophisticated instruments. Also, the requirement of carcinogenic substrate for chemiluminescent detection and the time-consuming effort limits the applications of these methods. The sensitivities of these methods are between 10 pM and 1.7 μM.Citation10–Citation15 They cannot meet clinical diagnostic requirements of the samples with low Aβ concentrations because the concentration of Aβ in the human plasma and CSF is in the range of 5.5–195 pM.Citation16 Recently, electrochemical studies of Aβ detectionCitation17–Citation20 have drawn increasing attention for its low cost, simplicity, and high sensitivity. Most groups have used gold electrode to detect AβO. Zhou et al fabricated an antibody–aptamer sandwich on glassy carbon electrode for AβO evaluation.Citation21 The detection limit for AβO detection of these electrochemical biosensors were from 0.5 to 500 pM.Citation17–Citation21 In this study, a novel AβO biosensor made of graphene oxide (GO)/gold nanoparticles (GNPs) hydrogel was developed. Compared with traditional solid electrodes, soft graphene hydrogel electrodes have many advantages. The three-dimensional (3D) porous hydrogel allows fast penetration of biomolecules into the electrode and binding with the capture probes, while solid electrodes can only adsorb biomolecules on its outer surface. Thus, hydrogel electrode has much larger surface area than solid electrode. In addition, the bionic structure of hydrogel containing abundant water is more biocompatible than solid electrode. Moreover, the volume and shape of hydrogel electrode can be changed to adjust its conductivity. These properties make 3D graphene a perfect candidate as a high-performance electrode material for biosensing.Citation22 In our previous studies, we have shown that GO hydrogel electrode is highly sensitive for DNA detection due to its bionic structure and tunable conductivity.Citation23 In this study, a novel GO/GNPs composite hydrogel biosensor for AβO detection was constructed. Our literature review shows that there is no study in which GO/GNPs have been used as hydrogel biosensors for protein biomarker detection. This label-free impedimetric biosensor has high selectivity and sensitivity of AβO in artificial CSF and blood plasma, without capturing Aβ monomers or fibrils. These features open a promising path toward the application of this type of biosensor as a new tool for early diagnosis of AD.
Materials and methods
Materials
The natural graphite powder (320 mesh) was purchased from Tianjin Guangfu Chemical Agent Co., Ltd. (Tianjin, China). KCl, KH2PO4, MgCl2, MgSO4, CaCl2, NaNO3, KMnO4, magnesium powder, and ammonium persulfate (APS) were purchased from Guoyao Co., Ltd (Shanghai, China). 1,1,1,3,3,3-Hexafluoro-2-propanol (HFIP), sodium borohydride (NaBH4), H2SO4, HCl, nitric acid, hydrazine hydrate, ethanol, NaHCO3, NaOH, NaH2PO4, NaCl, and Na2HPO4 were obtained from Xilong Chemical (Guangzhou, China). Chloroauric acid (HAuC14) and glucose were purchased from Sigma-Aldrich Co. (St Louis, MO, USA). Protein marker, glycine, Tris (hydroxymethyl) aminomethane, 2× Native Loading buffer, and Coomassie brilliant blue stain were purchased from Sangon Biotech. Co. Ltd (Shanghai, China). Tetramethylethylenediamine (TEMED), 30% acrylamide (Acr-Bis), 4× Tris HCl (pH 6.8), and 4× Tris HCl (pH 8.8) were from Beyotime Biotechnology (Shanghai, China). The cellular prion protein (PrPC) peptide probe was synthesized by Sangon. A mini-polyethylene glycol (PEG7) spacer is positioned between mercaptopropionic acid residue and PrPC probe (). Aβ1−42 (96.7%) was synthesized by GL Biochem Ltd. (Shanghai, China). The conical-bottom centrifuge tubes were purchased from Axygen Scientific Inc. (Silicon Valley, CA, USA). Blood samples from healthy volunteers were obtained from the affiliated Zhongshan Hospital of Xiamen University. Deionized water was used in all experiments.
Methods
Preparation and characterization of GO and GO/GNPs hydrogel electrodes
GO was synthesized from graphite by the modified Hummers’ method.Citation24,Citation25 GO hydrogel was prepared based on our previous work except that no fish sperm DNA was added.Citation23 A total of 0.5 mL of 4.05 mg/mL GO was dropped into a 2 mL conical-bottom centrifuge tube, which was heated at 95°C for 1 h in a thermomixer and cooled down to room temperature to form GO hydrogel. Similarly, 4.05 mg/mL GO, 1.25 mM HAuCl4, and 1.2 mM NaBH4 were thoroughly mixed in a centrifuge tube and then heated at 95°C for 1 h before cooling down to form GO/GNPs hydrogel. Following that, the lids of all tubes were removed and the bottoms were embedded with a copper wire (5 cm in length and 1 mm in diameter) to produce hydrogel electrodes.
HAuCl4 and NaBH4 were mixed with GO. After 10 min, GO and GO/GNPs solution were deposited onto 400 mesh Cu grids coated with carbon film. The grids were dried at room temperature for 1 day. Transmission electron microscope (TEM) images were performed on a JEM2100 TEM (Hitachi Ltd., Tokyo, Japan). For Raman spectra and X-ray photoelectron spectroscopy (XPS), samples were deposited on silicon slices and were dried overnight at room temperature. Raman spectra were recorded on a Dilor SA LABRAM Raman spectrometer (Dilor SA, Lille, France). XPS spectra were measured on a Phi Quantum 2000 X-ray photoelectron spectrometer (PHI, Minneapolis, MN, USA). Diluted samples were cast onto fresh mica sheets. The mica sheets were then rinsed with water to remove salt residues and dried overnight at room temperature. The morphologies were characterized by the Nanoscope V multimode atomic force microscope (AFM; Veeco Instruments, New York, NY, USA) using the tapping mode. Zeta potentials were measured by a Malvern Nano-ZS (Malvern Instruments, Malvern, UK).
GO and GO/GNPs hydrogel were freeze-dried. The crystallographic structures were determined by a powder X-ray diffraction system (Philips PANalytical X’Pert) equipped with Cu Kα radiation (λ=1,542 Å) (Ultima IV; Rigaku, Tokyo, Japan). The freeze-dried samples of GO and GO/GNPs hydrogel were placed on silicon slices and were coated with Au. Then, scanning electron microscope (SEM) images were performed on a LEO 1530 SEM (LEO, Oberkochen, Germany). Electrochemical impedance spectra (EIS) were detected using an electrochemical workstation, CHI660C (CH Instrument, Shanghai, China). The impedance analyses were conducted from 0.01 Hz to 10 kHz at a modulation voltage of 5 mV in phosphate-buffered saline (PBS; 137 mM NaCl, 1.68 mM KCl, 1.76 mM KH2PO4, and 10 mM Na2HPO4, pH 7.4).
Preparation and characterization of the GO/GNPs-PrPC biosensor
This hydrogel electrode was used as disposable biosensor because of strong binding between AβO and PrPC probe. To decrease the stochastic error, we checked the resistance of all electrodes before immobilization of the PrPC probes. Only those electrodes with close resistance (relative deviation <5%) were used in following experiment. The PrPC probes were immobilized on the GO/GNPs hydrogel electrode to construct the GO/GNPs-PrPC biosensor. The details were described below. The PrPC peptide was suspended in 50% acetic acid, since alkaline PrPC peptide was more soluble in acidic solution. A total of 200 μL of PrPC peptide was added to the centrifuge tube with GO/GNPs hydrogel. After incubation, the solution was pipetted out and the hydrogel was rinsed with PBS for three times. The effects of the PrPC concentration (0.01–0.5 mg/mL) and incubation time (5–30 min) on the charge-transfer resistance (Rct) were investigated by EIS.
Preparation and characterization of Aβ monomers, oligomers, and fibrils
Aβ1–42 monomers and oligomers were prepared according to the procedures reported in the previous reports.Citation17,Citation26 The Aβ1–42 peptides were suspended in 100% HFIP (1 mg/mL) and incubated under shaking at 37°C for 1.5 h. The HFIP acts as a hydrogen-bond breaker to eliminate pre-existing structural inhomogeneity of Aβ1–42.Citation27 HFIP was evaporated under a gentle stream of nitrogen. Then, the HFIP-treated Aβ1–42 was suspended in 100 μL of NaOH (1 mM) and diluted in PBS to 100 μM to obtain monomers. Aβ1–42 oligomers were formed by incubating monomers solution for 3 h at 4°C followed by centrifugation at 14,000× g for 15 min to remove any insoluble aggregates. The HFIP-treated Aβ1–42 was suspended in HCl (pH 2) at 37°C for a day to obtain fibrils.Citation28 The concentration of Aβ oligomers and fibrils was expressed as the concentration of monomeric Aβ1–42 peptides (Aβ monomer equivalent concentration). All solutions were immediately aliquoted and frozen at −80°C.
A total of 10 μL of 5 μM Aβ1–42 monomers, oligomers, or fibrils were cast onto fresh mica sheets. The mica sheets were then rinsed with water to remove salt residues and were dried overnight at room temperature. The morphologies of Aβ1–42 were characterized by the Nanoscope V multimode AFM using the tapping mode.
CD spectra of Aβ peptides were measured on a Jasco J-810 spectropolarimeter (Tokyo, Japan) in the range of 195–265 nm. The optical chamber of CD spectrometer was deoxygenated with dry purified nitrogen for 30 min and was kept at the nitrogen atmosphere during experiments. Two scans were recorded and automatically averaged after subtracting the background spectrum of PBS. The contents of secondary structures (α-helix, β-sheet, and random coil) were determined by the Model JWSSE-480 Jasco Secondary Structure Estimation program based on Yang’s reference CD spectra.Citation29
In vitro detection of AβO by electrochemical impedance measurement
Impedance measurements were carried out in PBS using an electrochemical workstation. A total of 5 mV AC voltage amplitude and 0.1–105 Hz voltage frequencies were applied. Artificial CSF (NaCl 124 mM, KCl 3 mM, NaH2PO4 1.25 mM, NaHCO3 26 mM, MgSO4 1.8 mM, CaCl2 1.6 mM, and glucose 10 mM, pH 7.4) was prepared according to previous method.Citation30 Anticoagulated blood samples drawn from healthy subjects were centrifuged at 3,000× g at 4°C for 10 min. The supernatants were collected as blood plasma, aliquoted, and stored at −80°C. AβO was diluted in artificial CSF or blood plasma to obtain different concentrations (0.1 pM–1 μM). Then, the PrPC immobilized hydrogel electrode was incubated with different concentrations of AβO. 200 μL of 0.1 pM–10 nM AβO was dropped on the hydrogel and incubated for 30 min at 4°C. Excess AβO was removed by washing with 1 mL of PBS for three times. Each time, the hydrogel electrode was incubated in PBS for 5 min. The selectivity of the biosensor was tested with 1 nM Aβ1–42 monomer, oligomer, and fibril in CSF.
Ethics
Ethical approval was given by the medical ethics committee of Xiamen University. Written informed consent was obtained from all of the blood donors.
Results and discussion
Principle of AβO detection by GO/GNPs-PrPC biosensor
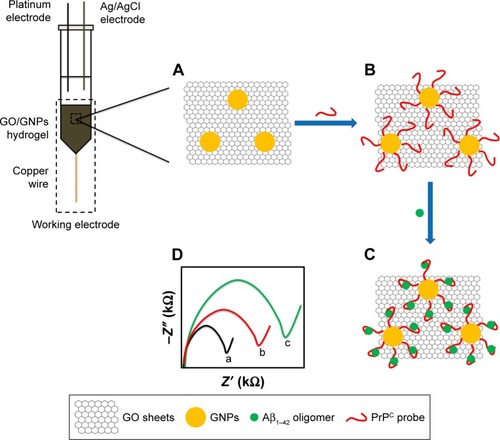
shows the principal of AβO detection by GO/GNPs-PrPC biosensor. The GO/GNPs hydrogel is the working electrode. A platinum wire and an Ag/AgCl electrode serve as the auxiliary and the reference electrodes, respectively (). Thiolated PrPC probe is immobilized on GNPs of the hydrogel electrode through Au–S bonding (). A PEG7 spacer is positioned between mercaptopropionic acid residue and PrPC probe to avoid nonspecific interactions between the electrode surface and Aβ peptides (). The biosensor can specifically bind AβO due to the high affinity of PrPC probe toward AβO (), which causes an increase in the electron-transfer resistance (Rct) of GO/GNPs hydrogel electrode ().
Characterization of GO/GNPs hydrogel
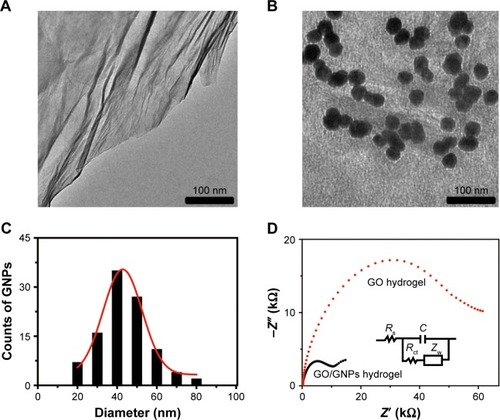
TEM image shows the sheet structure of GO (). GO/GNP is a TEM of hydrogel in which GNPs were grown on GO surface ( and ). The average size of GNPs on GO sheet is 43 nm (). SEM photos show porous structure of both GO and GO/GNPs hydrogel (). Partially reduced GO sheets are locally hydrophobic, due to their restored conjugated domains and diminished oxygenated functionalities (confirmed by X-ray diffraction [XRD], ). The local hydrophobicity and π–π interactions lead to 3D random stacking between some local regions of the graphene sheets and formation of the porous hydrogel.Citation31 These pores help rapid penetration of biomolecules into the hydrogel. The interconnected porous network greatly enhances the electroactive surface areas for collecting signal. The AFM images show that the size of GO is ~500 nm, and the thickness is ~0.9 nm (), indicating a monolayer structure.Citation32 The size and height of GNPs on GO/GNP hydrogel () are consistent with those found by the TEM image ().
Figure 1 (A) TEM of GO. (B) TEM of GO/GNPs. (C) The size distribution of GNPs on the surface of GO/GNPs. A total of 100 gold nanoparticles on graphene surface were analyzed. Twenty, 40, 60, and 80 nm indicate the size distributions of 1–20, 21–40, 41–60, and 61–80 nm, respectively. (D) The charge transfer resistance (Rct) of GO and GO/GNPs hydrogel. The insets show the Randles’ equivalent circuit model.
Abbreviations: GNPs, gold nanoparticles; GO, graphene oxide; TEM, transmission electron microscope.
The XRD spectra show that GO hydrogel has a large interlayer distance (7.25 Å, 2θ=12.2°) () due to the formation of hydroxyl, epoxy, and carboxyl groups, but the interlayer distance of GO/GNPs decreases to 3.63 Å (2θ =25.3°) because of the removal of some oxygen-containing functional groups.Citation33 The peaks at 38.02, 44.18, 64.67, 77.68, and 81.60° were assigned to the respective (111), (200), (220), (311), and (222) reflections of a face-centered cubic (FCC) structure. We find this assignment consistent with the standard values of gold (JCPDS 04-0784),Citation34 indicating the formation of GNPs. Full XPS spectrum of GO/GNPs shows an additional Au 4f peak compared with GO (). Both GO and GO/GNPs hydrogel exhibit C-C bond at ~285 eV, C-O at 287 eV, and C=O at 288 eV (),Citation35 but the intensity of C-C bond of the GO/GNPs hydrogel decreased significantly due to the reduction of GO. The Au 4f7/2 peak of GO/GNPs appears at a binding energy of 84.3 eV, and the Au 4f5/2 peak is at 87.9 eV (), confirming the formation of metallic gold.Citation36 In conclusion, all the microscope images and spectra analyses indicate the formation of GNPs in the GO hydrogel.
EIS is a powerful tool for characterizing molecular interactions on the electrode surface and detecting small changes occurring at biosensor surfaces. Compared with other electrochemical methods, EIS has unique advantages, such as high sensitivity, signal quantification ease, and ability to separate the surface-binding events from the solution impedance. In addition, EIS is less destructive when measuring the biological interactions because it is performed in a very narrow range of small potentials. Therefore, EIS has been widely used to detect DNA, protein, or small molecules.Citation7,Citation37 The Randles equivalent circuit model was used in our system to measure the Nyquist plots (, inset). Typical EIS spectrum comprises a compressed semicircle in the high frequency region followed by a tail in the lower frequency region. The diameter of the semicircle corresponds to the electron-transfer resistance (Rct). The high frequency region is dominated by the double layer capacitance (C) and the electrolyte solution resistance (Rs). ZW represents the impedance caused by the Warburg diffusion element at lower frequencies.Citation38 For very large Rct, the Warburg impedance is negligible.Citation39 The semicircle diameter of the Nyquist plot of the GO/GNPs hydrogel decreased significantly, confirming that GNPs improved the conductivity of the hydrogel ().
The water content of GO/GNPs hydrogel was calculated by the following equation: water content = (initial hydrogel weight - dried hydrogel weight)/initial hydrogel weight. The GO/GNPs hydrogel is abundant in water (96.19 wt%), which provides a friendly interface for target biomolecule binding. The stability of GO/GNPs hydrogel stored at 4°C was investigated by measuring the Rct each day. The resistance did not show a significant change in 8 days (), which means that the GO/GNPs hydrogel was stable in this period of time. The Rct decreased gradually at the 9th and 10th days due to the collapse of hydrogel structure.
Characterizations of Aβ1–42 monomers, oligomers, and fibrils
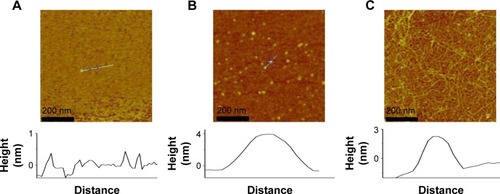
To investigate the morphologies of Aβ1–42 monomers, oligomers, and fibrils, we made use of AFM imaging technique. Using this technique, we find the Aβ1–42 monomers as unassembled structures with a typical size of 1 nm (). The oligomers show a spherical shape with a typical diameter of 4 nm (), whereas the Aβ1–42 fibrils extended over several microns with a height ~3 nm (). Conformational studies were conducted by CD spectra. As shown in , the monomers had a negative peak of ~205 nm, indicating the random coil structure. The Aβ1–42 oligomers had a wide band of ~217 nm, confirming the formation of β-sheet. Compared with the monomers, Aβ1–42 oligomers and fibrils show a significant decrease of the random coil and an increase of the β-sheet structure (). These results indicate that Aβ1–42 peptides underwent secondary structure transition from random-coil to β-sheet during aggregation process.Citation40
Figure 2 AFM of Aβ1–42 monomers (A), oligomers (B), and fibrils (C).
Abbreviations: Aβ, amyloid-beta; AFM, atomic force microscope.
Construction of the GO/GNPs-PrPC biosensor
In order to construct the GO/GNPs-PrPC biosensor, the PrPC probe was immobilized on the GO/GNPs hydrogel electrode. To find the optimal conditions for the biosensor, the effects of the incubation time of the PrPC probe with the GO/GNPs hydrogel electrode and the probe concentration on the resistance of the electrode were investigated. We found that Rct gradually increased with time and PrPC probe concentration. Rct reached the equilibrium at 15 min and 0.2 mg/mL PrPC probe (), indicating that the PrPC probes were saturated on the GO/GNPs hydrogel electrode. As a consequence, this incubation time and the probe concentration were used in the following experiments. In this study, the impedance measurements are not performed in the presence of a redox probe pair such as ferrocyanide/ferricyanide, because graphene/GNPs complex material has good electrochemical activity. In addition, direct measurements of Aβ in PBS can avoid the denaturation of protein molecules and disturbance of the PrPC-AβO binding by ferrocyanide/ferricyanide.
Electrochemical impedance assays for AβO detection
We prepared AβO from synthetic Aβ1–42 peptides. GO/GNPs-PrPC biosensor was constructed by the immobilization of PrPC probe on the hydrogel electrode through Au–S bonding. First, we investigated the selectivity of GO/GNPs-PrPC biosensor in the artificial CSF. The Rct of GO/GNPs-PrPC increased in comparison with a bare GO/GNPs hydrogel electrode (, curves a and b). AβO binding resulted in a significant increase in the charge transfer resistance Rct (, curve d), because AβO binding decreases the diffusion rate of Na+ and PO43− from PBS to the electrode interface.
Figure 3 (A) The impedance spectra of the bare GO/GNPs hydrogel electrode (a) and the GO/GNPs-PrPC biosensor (b). The GO/GNPs-PrPC biosensor was used to differentiate 1 nM Aβ1–42 monomer (c), oligomer (d), and fibril (e) in CSF. (B) ΔR for Aβ1–42 monomer, oligomer, and fibril detection.
Abbreviations: Aβ, amyloid-beta; CSF, cerebrospinal fluid; GNPs, gold nanoparticles; GO, graphene oxide; PrPC, cellular prion protein.
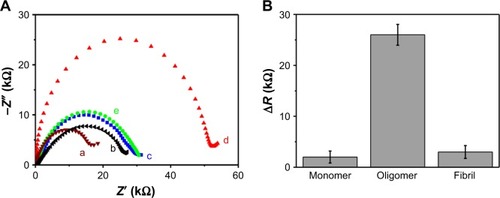
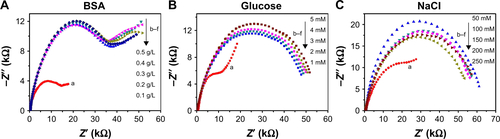
On the other hand, no significant resistance changes were observed for Aβ1–42 monomers or fibrils (, curves c and e). ΔR represents the electron-transfer resistance change of the GO/GNPs-PrPC biosensor after incubation with different AβO. ΔR for the Aβ1–42 oligomer is much higher than that for monomer and fibril (), indicating high selectivity of this biosensor. The good selectivity is based on the high affinity between PrPC probe and AβO. The cellular prion protein (PrPC) acts as AβO receptor on neurons. PrPC probe is a short peptide with 16 amino acids (residues 95–110, THSQWNKPSKPKTNMK) located in the N-terminal region of PrPC. It has been confirmed that these residues are the core region for Aβ1–42 oligomer binding.Citation41 The dissociation constant for the AβO/PrPC interaction reaches nM, and the binding is highly specific for Aβ oligomer but not for Aβ monomer and fibril.Citation42,Citation43 That is why we used PrPC (95–110) probe as a receptor for AβO detection. In order to investigate whether the other existing components of blood, such as bovine serum albumin (BSA), glucose, and NaCl, disturb AβO detection, we checked the performance of the biosensor at different concentrations of the respective molecules and found no significant changes of the EIS spectra (). These results confirmed that BSA, glucose, and NaCl do not disturb AβO detection.
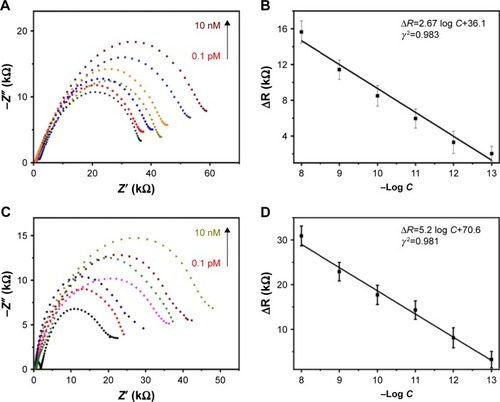
AβO in CSF or blood are the pathogenic biomarker correlated with AD.Citation44,Citation45 Since lumbar puncture for CSF may cause cerebral and spinal herniation, headache, cranial neuropathies, nerve root irritation, back pain, and infectious and bleeding complications,Citation46 it is not accepted by many patients. Bearing in mind that the blood collected from human represents real condition of clinical samples, AβO analysis in blood plasma would be of great value for wider diagnostic monitoring. In this study, AβO were either diluted in artificial CSF or blood plasma to obtain different concentrations of AβO. The sensitivity of the GO/GNPs-PrPC biosensor for AβO detection was investigated in this study. Rct increased gradually upon increasing concentrations of AβO (). The limit of detection reached at 0.1 pM, which is much lower than the low limit of the Aβ1–42 concentration in CSF or blood plasma (5.5 pM).Citation16 ΔR showed a linear correlation with the AβO concentrations (-log scale) (), and the linear response of the sensor lies in a wide range of AβO concentrations (0.1 pM to 10 nM). The detection limit of our biosensor is lower than that of the other electrochemical or spectrometric methods for AβO detection based on PrPC probe () due to the following possible reasons: first, EIS is a powerful electrochemical technology for the detection of small changes occurring at biosensor surfaces. Second, the bionic structure of the soft hydrogel with abundant water provides a friendly interface for target biomolecules binding. Moreover, the intermediate conductivity of GO hydrogel is sensitive to the change of resistance introduced by trace amount of molecules binding on the surface of electrode.Citation23 In addition, the 3D porous structure of hydrogel has enormous space and allows rapid penetration of biomolecules into the electrode, which benefits the adsorption and binding of AβO.
Figure 4 (A) The impedance spectra of the GO/GNPs-PrPC biosensor (black curve) and its response to CSF AβO. (B) The calibration plot of ΔR for CSF AβO detection. (C) The impedance spectra of the GO/GNPs-PrPC biosensor (black curve) and its response to blood plasma AβO. (D) The calibration plot of ΔR for blood plasma AβO detection. The error bars represent the standard deviation from the average of three independent measurements by three biosensors. ΔR: Charge transfer resistance (Rct) change after binding with AβO. The colored lines represent 0.1 pM, 1 pM, 10 pM, 100 pM, 1 nM and 10 nM AβO, respectively.
Abbreviations: AβO, amyloid-beta oligomers; CSF, cerebrospinal fluid; GNPs, gold nanoparticles; GO, graphene oxide; PrPC, cellular prion protein.
Scheme 1 The principle of AβO detection by GO/GNPs-PrPC biosensor.
Notes: (A) GO/GNPs. (B) Immobilization of PrPC probe on GNPs. (C) Binding of AβO. (D) The charge transfer resistance (Rct) of (a) bare GO/GNPs electrode, (b) PrPC probe immobilized electrode, and (c) AβO captured GO/GNPs-PrPC biosensor.
Abbreviations: Aβ, amyloid-beta; AβO, Aβ oligomers; GNPs, gold nanoparticles; GO, graphene oxide; PrPC, cellular prion protein.
Conclusion
In this study, a GO/GNPs-PrPC hydrogel biosensor for specific and sensitive AβO detection was presented based on EIS assay. The unique electrochemical property of GO/GNPs hydrogel electrode and the specific interaction of PrPC with AβO result in powerful performance of this biosensor. It can selectively differentiate AβO from Aβ monomers or fibrils. Meanwhile, it is highly sensitive to detect as low as 0.1 pM AβO in CSF or blood plasma. This biosensor can be used as a convenient tool for early diagnosis of AD. The strategy in this work may also present a general method for other protein assays. Quantitative determination of other target proteins can be achieved by coupling their corresponding peptide or aptamer probes in the GO/GNPs hydrogel.
Author contributions
Liping Sun designed the study. Yong Zhong and Jie Gui performed the experiments. All authors contributed toward data analysis, drafting and critically revising the paper, gave final approval of the version to be published, and agree to be accountable for all aspects of the work.
Acknowledgments
This work is supported by the National Natural Science Foundation of China (81571764 and 31371005). We thank the visiting scholar, Professor RI Ristic from the University of Oxford, UK, for language correction.
Supplementary materials
Table S1 Secondary structures of Aβ1–42 monomers, oligomers, and fibrils
Table S2 Performances of AβO detection methods based on PrPC probe
Figure S1 The HS-PEG7-PrPC probe.
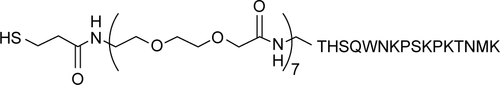
Figure S2 SEM images of GO (A) and GO/GNPs hydrogel (B).
Abbreviations: GNPs, gold nanoparticles; GO, graphene oxide; SEM, scanning electron microscope.
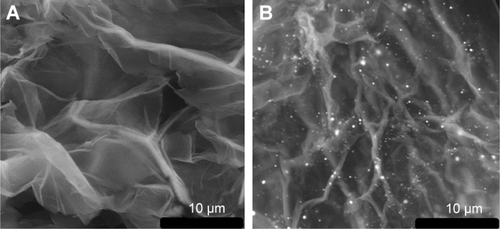
Figure S3 XRD spectra of GO and GO/GNPs hydrogel.
Abbreviations: GNPs, gold nanoparticles; GO, graphene oxide; XRD, X-ray diffraction.
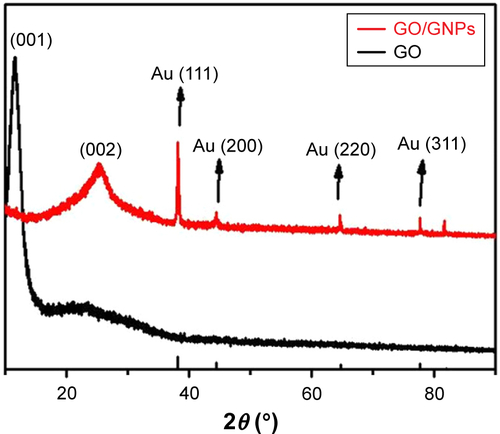
Figure S4 AFM images of GO (A) and GO/GNPs (B).
Abbreviations: AFM, atomic force microscope; GNPs, gold nanoparticles; GO, graphene oxide.
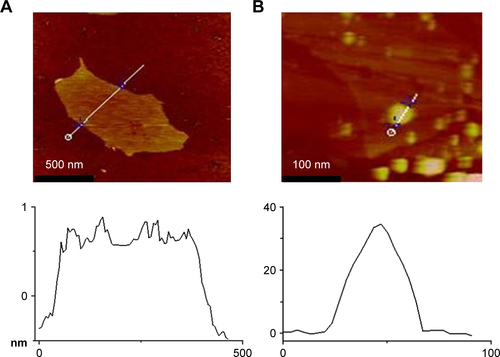
Figure S5 XPS spectra of GO and GO/GNPs.
Notes: (A) Full XPS scan spectra of GO and GO/GNPs. (B) C 1s spectra of GO. (C) C 1s spectra of GO/GNPs. (D) Au 4f spectra of GO/GNPs.
Abbreviations: GNPs, gold nanoparticles; GO, graphene oxide; XPS, X-ray photoelectron spectroscopy.
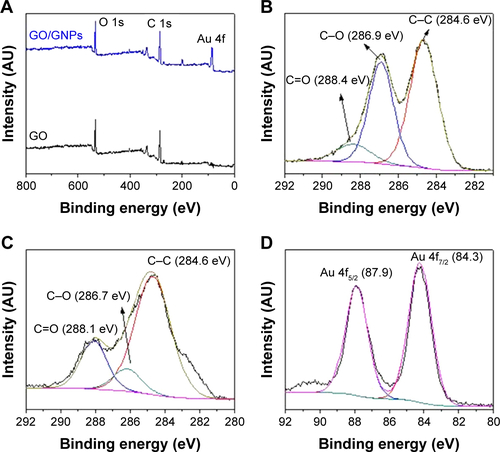
Figure S6 The resistance of GO/GNPs hydrogel at 0–10 days.
Abbreviations: GNPs, gold nanoparticles; GO, graphene oxide.
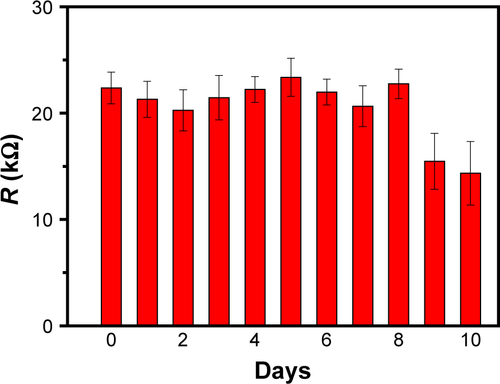
Figure S7 CD spectra of Aβ1–42 monomers, oligomers and fibrils.
Abbreviations: Aβ, amyloid-beta; CD, circular dichroism.
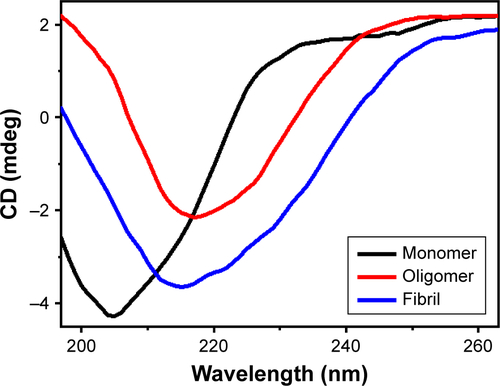
Figure S8 (A) The effect of the incubation time of PrPC probe on the electron-transfer resistance of the GO/GNPs hydrogel electrode. The PrPC probe concentration was 2 mg/mL. (B) The effect of the PrPC probe concentration on the resistance of the electrode. The electrode was incubated with PrPC probe for 15 min. R: electron-transfer resistance. The error bars indicate standard deviation (n=3).
Abbreviations: GNPs, gold nanoparticles; GO, graphene oxide; PrPC, cellular prion protein.
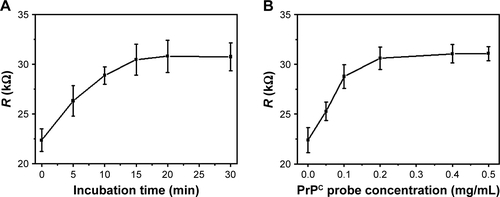
Figure S9 Influences of BSA, glucose, and NaCl on AβO detection.
Notes: The GO/GNPs-PrPC biosensor was used to detect 1 nM aβO at 0.1–0.5 g/L BSA (A), 1–5 mM glucose (B), and 50–250 mM NaCl (C). Curve a represents the control experiment without BSA, glucose, or NaCl. Curves b–f represent the effects of different concentrations of the disturbing substance on the impedance of the biosensor.
Abbreviations: AβO, amyloid-beta oligomers; BSA, bovine serum albumin; GNPs, gold nanoparticles; GO, graphene oxide.
References
- RushworthJVAhmedAGriffithsHHPollockNMHooperNMMillnerPAA label-free electrical impedimetric biosensor for the specific detection of Alzheimer’s amyloid-beta oligomersBiosens Bioelectron201456839024480125
- XiaNWangXZhouBWuYMaoWLiuLElectrochemical detection of amyloid-β oligomers based on the signal amplification of a network of silver nanoparticlesACS Appl Mater Interfaces2016830193031931127414520
- XiaNLiuLWuRAscorbic acid-triggered electrochemical–chemical–chemical redox cycling for design of enzyme-amplified electrochemical biosensors on self-assembled monolayer-covered gold electrodesJ Electroanal Chem20147317883
- XiaNWangXYuJDesign of electrochemical biosensors with peptide probes as the receptors of targets and the inducers of gold nanoparticles assembly on electrode surfaceSens Actuat B Chem2017239834840
- XingYFengXZZhangLHouJHanGCChenZA sensitive and selective electrochemical biosensor for the determination of beta-amyloid oligomer by inhibiting the peptide-triggered in situ assembly of silver nanoparticlesInt J Nanomedicine2017123171317928458538
- XiaNZhouBHuangNJiangMZhangJLiuLVisual and fluorescent assays for selective detection of beta-amyloid oligomers based on the inner filter effect of gold nanoparticles on the fluorescence of CdTe quantum dotsBiosens Bioelectron20168562563227240009
- LiuLXiaNZhangJA graphene oxide-based fluorescent platform for selective detection of amyloid-β oligomersAnal Methods2015787278732
Disclosure
The authors report no conflicts of interest in this work.
References
- Alzheimer’s Association2016 Alzheimer’s disease facts and figuresAlzheimers Dement201612445950927570871
- PrinceMComas-HerreraAKnappMGuerchetMKaragiannidouMWorld Alzheimer Report 2016: Improving Healthcare for People Living with Dementia: Coverage, Quality and Costs Now and in the FutureLondonAlzheimer’s Disease International2016
- BieschkeJHerbstMWiglendaTSmall-molecule conversion of toxic oligomers to nontoxic β-sheet-rich amyloid fibrilsNat Chem Biol20128193101
- GongYChangLViolaKLAlzheimer’s disease-affected brain: presence of oligomeric Aβ ligands (ADDLs) suggests a molecular basis for reversible memory lossProc Natl Acad Sci U S A200310018104171042212925731
- BlennowKHampelHWeinerMZetterbergHCerebrospinal fluid and plasma biomarkers in Alzheimer diseaseNat Rev Neurol20106313114420157306
- YounanNDSarellCJDaviesPBrownDRVilesJHThe cellular prion protein traps Alzheimer’s Aβ in an oligomeric form and disassembles amyloid fibersFASEB J20132751847185823335053
- VelosoAKermanKAdvances in electrochemical detection for study of neurodegenerative disordersAnal Bioanal Chem2013405175725574123529415
- StineWBDahlgrenKNKrafftGALaDuMJIn vitro characterization of conditions for amyloid-β peptide oligomerization and fibrillogenesisJ Biol Chem200327813116121162212499373
- HaassCSelkoeDJSoluble protein oligomers in neurodegeneration: lessons from the Alzheimer’s amyloid β-peptideNat Rev Mol Cell Biol20078210111217245412
- BrugginkKAJongbloedWBiemansEALMAmyloid-β oligomer detection by ELISA in cerebrospinal fluid and brain tissueAnal Biochem2013433211212023022042
- LvGSunAWeiPZhangNLanHYiTA spiropyran-based fluorescent probe for the specific detection of β-amyloid peptide oligomers in Alzheimer’s diseaseChem Commun20165288658868
- XiaNZhouBHuangNJiangMZhangJLiuLVisual and fluorescent assays for selective detection of beta-amyloid oligomers based on the inner filter effect of gold nanoparticles on the fluorescence of CdTe quantum dotsBiosens Bioelectron20168562563227240009
- VoiciukVValinciusGBudvytytėRMatijoškaAMatulaitienėINiauraGSurface-enhanced Raman spectroscopy for detection of toxic amyloid β oligomers adsorbed on self-assembled monolayersSpectrochim Acta A201295526532
- SantosANTorklerSNowakDDetection of amyloid-β oligomers in human cerebrospinal fluid by flow cytometry and fluorescence resonance energy transferJ Alzheimers Dis200711111712517361040
- HaesAJChangLKleinWLVan DuyneRPDetection of a biomarker for Alzheimer’s disease from synthetic and clinical samples using a nanoscale optical biosensorJ Am Chem Soc200512772264227115713105
- MehtaPDPirttiläTMehtaSPSersenEAAisenPSWisniewskiHMPlasma and cerebrospinal fluid levels of amyloid β proteins 1-40 and 1-42 in Alzheimer diseaseArch Neurol200057110010510634455
- LiHXieHCaoYDingXYinYLiGA general way to assay protein by coupling peptide with signal reporter via supermolecule formationAnal Chem20138521047105223237077
- RushworthJVAhmedAGriffithsHHPollockNMHooperNMMillnerPAA label-free electrical impedimetric biosensor for the specific detection of Alzheimer’s amyloid-beta oligomersBiosens Bioelectron201456839024480125
- XiaNWangXZhouBWuYMaoWLiuLElectrochemical detection of amyloid-β oligomers based on the signal amplification of a network of silver nanoparticlesACS Appl Mater Interfaces2016830193031931127414520
- XingYFengXZZhangLHouJHanGCChenZA sensitive and selective electrochemical biosensor for the determination of beta-amyloid oligomer by inhibiting the peptide-triggered in situ assembly of silver nanoparticlesInt J Nanomedicine2017123171317928458538
- ZhouYZhangHLiuLFabrication of an antibody-aptamer sandwich assay for electrochemical evaluation of levels of beta-amyloid oligomersSci Rep201663518627725775
- QiuHJGuanYLuoPWangYRecent advance in fabricating monolithic 3D porous graphene and their applications in biosensing and biofuel cellsBiosens Bioelectron201789pt 1859526711357
- SunLPHuNPengJChenLYWengJUltrasensitive detection of mitochondrial DNA mutation by graphene oxide/DNA hydrogel electrodeAdv Funct Mater2014244469056913
- BotasCÁlvarezPBlancoPGraphene materials with different structures prepared from the same graphite by the Hummers and Brodie methodsCarbon N Y201365156164
- ChenJLiYHuangLLiCShiGHigh-yield preparation of graphene oxide from small graphite flakes via an improved Hummers method with a simple purification processCarbon N Y201581826834
- BarghornSNimmrichVStriebingerAGlobular amyloid β-peptide1-42 oligomer – a homogenous and stable neuropathological protein in Alzheimer’s diseaseJ Neurochem200595383484716135089
- AhmedMDavisJAucoinDStructural conversion of neurotoxic amyloid-β1-42 oligomers to fibrilsNat Struct Mol Biol201017556156720383142
- SheikhAMNagaiALysophosphatidylcholine modulates fibril formation of amyloid beta peptideFEBS J2011278463464221205198
- YangJTWuCSCMartinezHMHirsCHWTimacheVSNMethods in Enzymology130OrlandoPark K Academic Press1986208269
- GaubPLéonAGibonJproBDNF: a new tool for the analysis of pro-brain derived neurotrophic factor receptor signaling and cell biologyPLoS One2016113e015060126950209
- XuYShengKLiCShiGSelf-assembled graphene hydrogel via a one-step hydrothermal processACS Nano2010474324433020590149
- KimJWKangDKimTHMosaic-like monolayer of graphene oxide sheets decorated with tetrabutylammonium ionsACS Nano2013798082808823965037
- FanZWangKWeiTYanJSongLShaoBAn environmentally friendly and efficient route for the reduction of graphene oxide by aluminum powderCarbon N Y201048516861689
- ZhangNQiuHLiuYFabrication of gold nanoparticle/graphene oxide nanocomposites and their excellent catalytic performanceJ Mater Chem2011211108011083
- CittadiniMBersaniMPerrozziFOttavianoLWlodarskiWMartucciAGraphene oxide coupled with gold nanoparticles for localized surface plasmon resonance based gas sensorCarbon N Y201469452459
- LiJHanQWangXReduced aggregation and cytotoxicity of amyloid peptides by graphene oxide/gold nanocomposites prepared by pulsed laser ablation in waterSmall201410214386439425059878
- BogomolovaAKomarovaEReberKChallenges of electrochemical impedance spectroscopy in protein biosensingAnal Chem200981103944394919364089
- LisdatFSchäferDThe use of electrochemical impedance spectroscopy for biosensingAnal Bioanal Chem20083915155518414837
- BardAJFaulknerLRChapter 10 Techniques based on concepts of impedanceAllenJBLarryRElectrochemical Methods, Fundamentals and ApplicationsSecond edNew YorkJohn Wiley & Sons2001368387
- FezouiYTeplowDBKinetic studies of amyloid β-protein fibril assembly: differential effects of α-helix stabilizationJ Biol Chem200227740369483695412149256
- LaurénJGimbelDANygaardHBGilbertJWStrittmatterSMCellular prion protein mediates impairment of synaptic plasticity by amyloid-β oligomersNature200945772331128113219242475
- FluhartyBRBiasiniEStravalaciMAn N-terminal fragment of the prion protein binds to amyloid-β oligomers and inhibits their neurotoxicity in vivoJ Biol Chem2013288117857786623362282
- FreirDBNicollAJKlyubinIInteraction between prion protein and toxic amyloid β assemblies can be therapeutically targeted at multiple sitesNat Commun2011233621654636
- FukumotoHTokudaTKasaiTHigh-molecular-weight β-amyloid oligomers are elevated in cerebrospinal fluid of Alzheimer patientsFASEB J20102482716272620339023
- DoeckeJDLawsSMFauxNGAlzheimer’s Disease Neuroimaging Initiative; Australian Imaging Biomarker and Lifestyle Research GroupBlood-based protein biomarkers for diagnosis of Alzheimer diseaseArch Neurol201269101318132522801742
- EvansRWComplications of lumbar punctureNeurol Clin1998161831059421542