
Abstract
Background
Silver nanoparticles (AgNPs) have attracted considerable attention due to the variety of their applications in medicine and other sciences. AgNPs have been used in vitro for treatment of various diseases, such as hepatitis B and herpes simplex infections as well as colon, cervical, and lung cancers. In this study, we assessed the effect on proliferation, adhesion, and apoptosis in breast cancer cell lines of different molecular profiles (MCF7, HCC1954, and HCC70) exposed to AgNPs (2–9 nm).
Methods
Breast cancer cell lines were incubated in vitro; MTT assay was used to assess proliferation. Adhesion was determined by real-time analysis with the xCELLingence system. Propidium iodide and fluorescein isothiocyanate-Annexin V assay were used to measure apoptosis. The transcriptome was assessed by gene expression microarray and Probabilistic Graphical Model (PGM) analyses.
Results
The results showed a decreased adhesion in breast cancer cell lines and the control exposed to AgNPs was noted in 24 hours (p≤0.05). We observed a significant reduction in the proliferation of MCF7 and HCC70, but not in HCC1954. Apoptotic activity was seen in all cell lines exposed to AgNPs, with an apoptosis percentage of more than 60% in cancer cell lines and less than 60% in the control. PGM analysis confirmed, to some extent, the effects of AgNPs primarily on adhesion by changes in the extracellular matrix.
Conclusion
Exposure to AgNPs causes an antiproliferative, apoptotic, and anti-adhesive effect in breast cancer cell lines cultured in vitro. More research is needed to evaluate the potential use of AgNPs to treat different molecular profiles of breast cancer in humans.
Background
According to the World Health Organization (WHO), the most common cancer among women is breast cancer, which globally represents 29% of all female cancers. It is estimated that, each year, 1.38 million new cases are detected and 450,000 die from this disease.Citation1
Breast cancer is treated with a multidisciplinary approach involving surgical oncology, radiation oncology, and medical oncology.Citation1–Citation5 Most women with early-stage breast cancer are treated with surgery combined with other treatments (radiation, chemotherapy, and hormonal therapy) to reduce the risk of recurrence.Citation2–Citation5
Patients with metastatic disease are primarily treated with a systemic approach based on primary tumor characteristics, such as tumor size, grade, number of involved lymph nodes, the status of estrogen (ER) and progesterone (PR) receptors, and the expression of the human epidermal growth factor receptor 2 (HER2).Citation3–Citation6 Molecular portraits of breast cancer have been used to determine treatment and prognosis after medical diagnosis.Citation6,Citation7
Metal nanoparticles, including AgNPs, have attracted much attention due to their wide variety of applications in medicine and other sciences.Citation8 AgNPs have been used in some biological processes (eg, antibacterial, remediation environmental, therapeutic devices). A number of organic materials are known to work as protective agents for preventing colloid sintering during the synthesis of AgNPs; polyvinylpyrrolidone (PVP) is one of the most widely used agents to this purpose, and acts by controlling the reduction rate of silver ions.Citation9 In reactions where alcohol and ethylene glycol are used, PVP works as a stabilizing agent to ensure dispersion of very small metal particles.Citation10 Recently, the use of AgNPs as anticancer agents has been promising.Citation11 Furthermore, AgNPs have been used in several cancer cells types (eg, colon and cervical cancers, human lung carcinoma).Citation11–Citation13 Although induction of oxidative stress by AgNPs and impairment of DNA repair mechanisms have been observed as a general mode of toxicity, their mechanisms of action are still unclear.Citation11,Citation14 The aim of this study was to evaluate adhesion, proliferation, and apoptosis in different molecular portraits of breast cancer treated with AgNPs as well as its pathway–network analysis.
Materials and methods
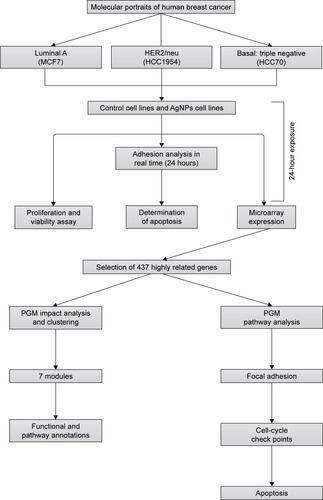
All experiments were conducted in triplicate as independent samples. summarizes the workflow and approach of this study – from sample characterization to the biological and pathway–network analyses.
Figure 1 The flow chart of the whole analysis in this study.
Abbreviation: PGM, probabilistic graphical model.
Characterization of cell lines
The selection of breast cancer cell lines (MCF7, HCC1954, and HCC70) was done according to their molecular portrait.Citation6 All cell lines were obtained from the American Type Culture Collection (ATCC; Manassas, VA, USA). MCF7 (ATCC® HTB-22) is an epithelial-adherent adenocarcinoma cell line obtained from a 69-year-old Caucasian female that expresses ERs and PRs and is HER2/neu-negative, classified as luminal A. HCC1974 (ATCC® CRL 2338) is an epithelial-adherent ductal carcinoma cell line obtained from a 61-year-old Indian female classified as HER2/neu, negative for estrogen and progesterone receptors. HCC70 (ATCC® CRL-2315™) is an epithelial-adherent cell line derived from the primary ductal carcinoma of a 49-year-old Black female that is negative for estrogen and progesterone receptors, and is classified as a triple-negative HER2/neu. All cell lines were stored in the vapor phase of liquid nitrogen.
Synthesis and characterization of colloidal AgNPs
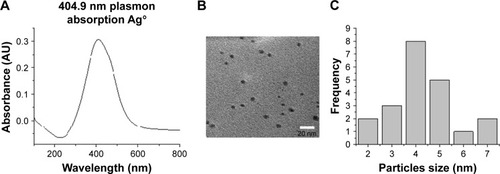
AgNP solutions were prepared using 100 mg silver nitrate (AgNO3) in 100 mL ethanol and 1 g PVP as the stabilizing agent; the weight ratio of PVP to AgNO3 was kept at 10:1. The ethanolic solution containing the metallic salt and PVP was refluxed to 363 K and stirred for 12 hours. The formation of AgNPs can be observed at a glance by a change in color in the solution, because small AgNPs are amber and the addition of PVP prevents aggregation.Citation10 We obtained the ratio 1:10 (AgNO3/PVP) that was best for stabilization of AgNP size. When we increased the PVP concentration, the particle nucleation rate was higher and particle size decreased.Citation15 The complete methodology for preparation of AgNPs can be obtained from a previous work.Citation16 The characterization of AgNPs was undertaken by ultraviolet-visible (UV–Vis) spectrophotometry and transmission electron microscopy (TEM). shows an absorption peak at 412 nm UV–Vis, which indicates the presence of Ag ions in the sample. On the other hand, indicate the presence and size of particles (2–9 nm) in the sample by TEM image and histogram.
Figure 2 Characterization of AgNPs. (A) Ultraviolet–visible spectra of AgNPs. (B) Transmission electron microscopy of AgNPs. (C) Histogram of the size of the particles.
Abbreviations: AgNPs, silver nanoparticles; AU, arbitrary unit.
Exposure to AgNPs
Breast cancer cell lines were adjusted to a concentration of 1×10⁵/mL in RPMI-1640 medium (Thermo Fisher Scientific, Waltham, MA, USA), for HCC1954 and HCC70, and DMEM medium, (Thermo Fisher Scientific), for the MCF7 cell line. Plates were incubated at 37°C with 95% relative humidity and 5% CO2 atmosphere for 24 hours. Then, the AgNPs groups were exposed to a concentration of 12.5 µg/mL of nanoparticles for 24 hours. In control groups, the same conditions were used but without AgNPs. All in vitro tests were conducted under these conditions, with the exception of the real-time adhesion analysis. To observe the adhesion, it was necessary to expose cells to the absence/presence of AgNPs during culture.
Adhesion analysis in real time
Cell adhesion was analyzed in triplicate in independent samples of each cell line in the absence/presence of AgNPs. In total, 1×10⁵ cells were cultured in a 96-well plate containing microelectrodes for the measurement of cell number, which is translated into a value called the cellular index. This value determines how much a cell disrupts flow impedance in real time using the xCELLingence system (Roche Applied Sciences and ACEA Biosciences, Basel, Switzerland). The cellular index was analyzed every 3 hours for 24 hours post-treatment with AgNPs.
Proliferation and viability assay
Proliferation and viability percentages were obtained by a modification of the original Mossman technique.Citation17,Citation18 Cells were incubated for 24 hours in the presence/absence of AgNPs; then, MTT (Sigma-Aldrich, St Louis, MO, USA) was added and allowed to incubate for 2 hours, and, finally, extraction buffer (20% sodium dodecyl sulfate, Sigma-Aldrich) and 50% dimethylformamide (Sigma-Aldrich) were added. The plate was incubated for 24 hours and read at 570/630 nm in an enzyme-linked immunosorbent assay reader (Synergy HT Multi-Mode Microplate Reader, with the Gen5 v2.0; BioTek, Winooski, VT, USA). The result of this assay was expressed as the proliferation index, calculated as the optical densities in stimulated cells divided by the optical densities of cells without stimulation, of each cell line.
Determination of apoptosis
After AgNPs stimulation, cells were washed twice with phosphate-buffered saline (PBS) and 5 µL fluorescein isothiocyanate-Annexin V was added. Cells were incubated for 15 minutes; then, 5 µL propidium iodide was added to evaluate apoptosis by a detection kit (BD Pharmigen, San Diego, CA, USA). Finally, apoptosis was measured on an EPICS XL-MCL Flow Cytometer (Beckman Coulter, Krefeld, Germany), and apoptosis results were expressed as the percentage of total apoptosis.
Nucleic acid isolation
Isolation of DNA and RNA was done with the AllPrep DNA/RNA Mini Kit (Qiagen, Hilden, Germany) from almost a million of cells of each cell line in the absence/presence of AgNPs. After isolation, RNA quality was measured with an RNA 6000 Nano kit (Agilent, Santa Clara, CA, USA) in 2100 Bioanalyzer (Agilent). The acceptable RNA Integrity Number (RIN) was higher than 6.0. We quantified RNA and DNA with a NanoDrop 2000 Spectrophotometer (Thermo Fisher Scientific, Waltham, MA, USA). Acceptable quality DNA should have 260/280 nm ratios 1.8 and 2.0.
Labeling and hybridization
In total, 200 ng total RNA from cell lines was amplified and labeled using the Low Input Two-Color Quick Amp Labeling Kit (Agilent). As internal controls, a Two-Color RNA Spike-In Kit (Agilent) was used. Labeled samples were purified with the RNeasy mini kit (Qiagen, Hilden, Germany). Cell line samples were labeled with Cy5 dye, and a control was labeled with Cy3 dye.
Hybridization was done with a Hi-RPM Gene Expression Hybridization Kit (Agilent) in a Human GE 4×44k v2 microarray AMADID 026652 (Agilent).
Microarray data
The hybridized microarray was scanned with a DNA Microarray Scanner with SureScan High-Resolution Technology, C version (Agilent), and a Feature Extraction software v.11 (Agilent) was used to extract microarray data. Cy3/Cy5 log rates from a gene panel were analyzed in the R Package. Afterwards, we selected genes highly associated with adhesion, proliferation, and apoptosis. We obtained 437 genes, which were processed as follows: data were filtered and nested in centroids using Gene Cluster 3.0 and then adjusted to logarithm base 2; thereafter, genes were centered on the basis of the mean. Heat maps of these genes were generated in the Java program Treeview 1.1.6r2.
Probabilistic Graphical Model impact analysis
The 437 selected genes were analyzed using the probabilistic graphical model (PGM) based on the Markov random field in Reactome FIViz, a Cytoscape plugin (http://www.cytoscape.org/download.php, and this one of ReactomeFIViz [also called Reactome Cytoscape Plugin or ReactomeFIPlugIn] http://apps.cytoscape.org/apps/reactomefiplugin),Citation14,Citation19,Citation20 where an interactome was generated with the top 10% differences.Citation21 Then, we ran a network clustering algorithm on the interactome to identify working subnetworks.Citation20 The tool provides predicted functional impact scores by integrating all observed variations to assess whether the activities of each gene are increased, decreased, or unaffected.Citation14,Citation19,Citation20
Pathway enrichment analysis
The gene modules were subjected to pathway enrichment analyses (hypergeometric testing);Citation22 then, pathway functional annotations were conducted using the Reactome FIViz, a Cytoscape plugin.
PGM pathway analysis
Pathways related to adhesion, proliferation, and apoptosis were analyzed with the PARADIGM; this approach was adapted for Reactome pathways by converting reactions drawn in pathway diagrams into factors; a PGM used in the Reactome FIViz, a Cytoscape plugin.Citation19,Citation23 This was done according to Reactome pathways database and by using their pathways component names in order to analyze the integrated pathway activity (IPA) in each related pathway.
Statistical analysis
Independent samples were analyzed with Student’s t-test and the Mann–Whitney U test, according to the nature of the variable. Statistical significance was set at p-value ≤0.05. Assessment of pathway associations was undertaken by the hypergeometric test using the Benjamini–Hochberg false discovery rate (FDR) correction, with an FDR correction-modified p-value ≤0.05. The analyses were conducted with SPSS version 20 (SPSS, Chicago, IL, USA).
Results
Adhesion in real time
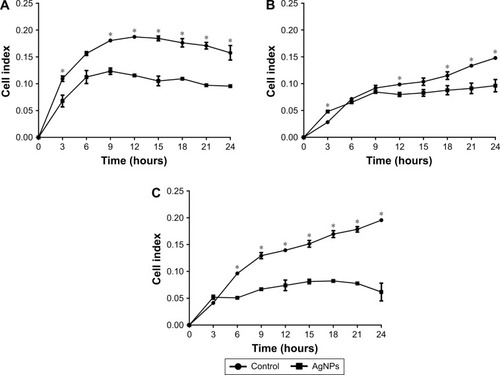
To investigate whether AgNPs had any effect on the ability of cancer cells to adhere and grow, cells were seeded in plates under conditions as explained earlier. Significant decreases in adhesion were observed with AgNPs treatment; the lowest values recorded were for the MCF7 line followed by the HCC70 cell line, as shown in . The first 9 hours of the real-time assay show direct changes in cell adhesion of the treated lines against the controls. MCF7 and HCC70 lines show pronounced decrease compared to the control, whereas the decrease in HCC1954 line is less (). However, the cellular index from 12 hours onwards decreases steadily in all the lines and is maintained until 24 hours.
Figure 3 Adhesion analysis in real time: presented as mean and standard deviation; differences were calculated using Mann–Whitney U-test p<0.05 (*). MCF7 (A), HCC1954 (B), and HCC70 (C) cell lines.
Abbreviation: AgNPs, silver nanoparticles.
Proliferation and viability
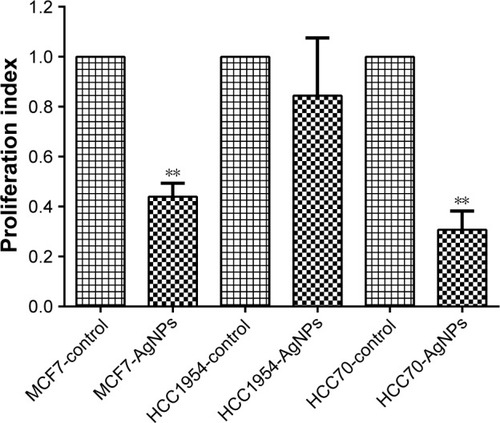
After 24 hours of exposure to the AgNPs, proliferation () was measured in each of the cell lines with the MTT assay. MCF7 and HCC70 showed a significant reduction between the AgNPs group and control group; both lines exhibited a reduction of more than half in the proliferation index. Whereas HCC1954 had a moderate reduction as in the adhesion assay; HCC1954 was least affected by AgNPs.
Figure 4 Proliferation and viability: presented as mean and standard deviation; differences were calculated by the Student’s t-test. P<0.01 (**).
Abbreviation: AgNPs, silver nanoparticles.
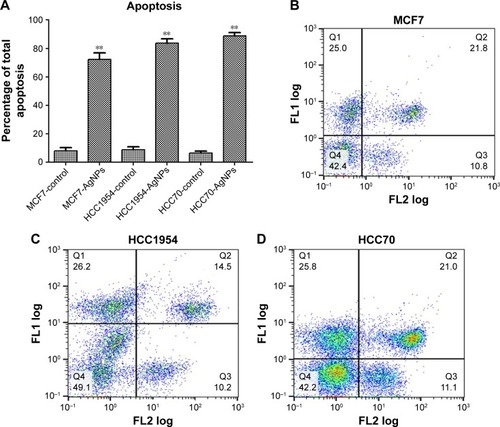
Determination of apoptosis
The total apoptosis percentage was determined in each of the cell lines exposed and not exposed to AgNPs (). shows a representative dot plot of each cell line exposed to AgNPs. All cell lines showed a significant increase in the percentage of apoptosis; HCC70 showed the highest percentage of apoptosis. The increase in percentage is at least five times greater in comparison to the respective controls of each cell line.
Figure 5 Determination of apoptosis: cells were stained with Annexin V-fluorescein isothiocyanate (FLl) and propidium iodide (FL2), and cell apoptosis was analyzed by flow cytometry. (A) Total apoptosis percentage presented as mean and standard deviation; differences were calculated by the Student’s t-test. P<0.01 (**). (B–D) Dot plots representative of each cell line.
Abbreviation: AgNPs, silver nanoparticles.
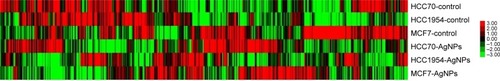
Gene expression
A gene expression microarray assay was conducted for HCC70, HCC1954, and MCF7 cell lines. Both control and AgNP-treated cells were tested. shows the heat map of the expression of 437 genes in each of the different lines of breast cancer. The expression of different genes change in response to the exposure to AgNPs; these changes differ according to the conditions of the original cell (the list of the 437 genes, as well as their expression data, are included in the Supplementary materials).
Figure 6 Gene expression heat map of 437 selected genes in each cell line.
Abbreviation: AgNPs, silver nanoparticles.
PGM impact analysis
We generated an interactome from the 437 genes along with their immediate inferred interaction partners; this provided a network of 12,177 genes. The top 10% of nodes, classified by differences in protein impact score (PIS) were selected to generate a minimal essential network (MEN; ).Citation21 The size of the nodes in the interactome is proportional to their PIS; this value is obtained not only by the expression of the gene but also by their known interactions.Citation14,Citation19 It is important to mention that the app generates a comparison against random samples from its database in order to provide the results. The edges show the interactions between different nodes in the interactome. shows the PIS of the top 10% of the genes and their p-value against random samples, according to the PGM impact analysis. Genes such as cyclin B2 (CCNB2), laminin subunit alpha 1 (LAMA1), matrix metallopeptidase 7 (MMP7), secreted protein acidic and cysteine-rich (SPARC), CDC28 protein kinase regulatory subunit 2 (CKS2), aurora kinase B (AURKB), interleukin 18 (IL18), versican (VCAN), and matrix metallopeptidase 3 (MMP3) were some of the genes that showed statistically significant gene expression from the random samples generated dynamically by the App in the control lines. Meanwhile, in the AgNPs groups, genes that were found to be differently expressed were the MMP3, SPARC, thrombospondin 2 (THBS2), occludin (OCLN), lipoprotein lipase (LPL), interleukin 1 beta (IL1B), serpin peptidase inhibitor, clade F member 1 (SERPINF1), cadherin 1 (CDH1), mutL homolog 1 (MLH1), collagen type VI alpha 1 chain (COL6A1), connective tissue growth factor (CTGF), tumor necrosis factor receptor superfamily member 1A-associated via death domain (TRAF2), and cadherin 6 (CDH6), compared to a random background generated dynamically by the App.
Table 1 PGM impact analysis
Figure 7 MEN of protein impact score. (A) Control cell lines and (B) cell lines treated with AgNPs.
Abbreviations: AgNPs, silver nanoparticles; MEN, minimal essential network.
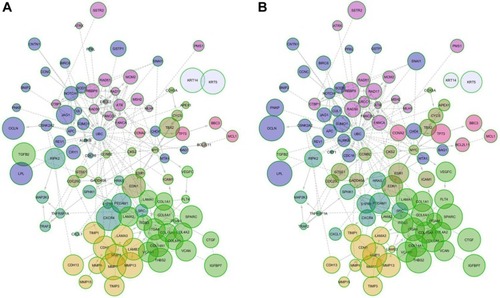
The MEN includes 122 genes and 246 edges cluster by modularity;Citation20 eight modules were identified and mapped onto biological pathways using the Reactome FIViz, a Cytoscape plugin, to ascertain function as shown in (the complete data of is shown in the Supplementary materials). shows that gene sets are significant for adhesion (extracellular matrix organization, focal adhesion, and integrin signaling pathway), proliferation (cell cycle, anaphase-promoting complex [APC/C] mediated degradation of cell-cycle proteins), and apoptosis (direct p53 effectors, the intrinsic pathway for apoptosis, and p53 signaling pathway).
Table 2 Pathways identified in modules
PGM pathway analysis
The results of the PGM pathway analysis are shown in (the complete data of is shown in the Supplementary materials), where functional components of related pathways are displayed by biological activities (adhesion, proliferation, and apoptosis) and the IPA differences in values. There were several significant changes related to the functional components on adhesion, which included the secreted phosphoprotein 1-CD44 antigen (SPP1-CD44), platelet endothelial cell adhesion molecule 1 (PECAM1), SPP1, SPP1-Integrin alpha5beta1-alpha9beta1, SPP1-Integrin alphaVBeta1,3,5, Integrin alphaVbeta3-PECAM1, Integrin alphaVbeta3-Tenascin, Tenascin-C hexamer, and Integrin alpha9beta1-Tenascin-C hexamer. There were no significant changes related to functional components of apoptosis and proliferation. Some components of the apoptosis pathways, such as caspase-8 (CASP8) and catenin beta-1 (CTNNB1), reached significant p-values, but not FDR values, which indicate probable false positives.
Table 3 PGM pathway analysis
Discussion
The use of nanomaterials in medicine has been an important contribution to science; however, the biological risk of using AgNPs has not been clearly established.Citation24,Citation25 As the effect of these AgNPs has been previously tested on murine lymphoma,Citation16 one of the goals of this study was to assess whether the effect was similar in human cancer cell lines. To evaluate this effect on breast cancer cell lines, different molecular portraits were used. The behavior and prognosis of the disease depend, to a large extent, on the molecular presence of the estrogen receptor, progesterone receptor, HER2/neu status, and the genetic profile of the cell lines.Citation6,Citation7 Different molecular samples were included, as specified in the material and methods section, in order to observe the effect of AgNPs on these different cell lines.
We used xCELLigence – an impedance-based live-cell monitoring platform – to determine how AgNPs affect adhesion on breast cancer cell lines.Citation26 Results are expressed in cell index, a complex measurement that can provide data with regard to cellular adhesion, viability, and proliferation;Citation26 however, data displayed during the initial hours of the real-time assay essentially showed cellular adhesion.Citation27,Citation28 The decrease of the cell index caused by AgNPs represents a decrease in cell migration and metastasis of cancerous cells.Citation29 The fact that the greatest decrease was observed in HCC70 shows the potential use of this nanomaterial as a treatment for triple-negative breast cancer, which is commonly associated with a worse prognosis. Although the mechanism of action by which AgNPs produce this effect has not yet been described, it is hypothesized that they affect focal adhesion kinases.Citation27,Citation28 These are large complexes of dynamic macromolecular proteins commonly found on migratory cells that provide the mechanical link between the cell and its binding to the extracellular matrix.Citation28,Citation29 Reported data from 9 to 24 hours of exposure to AgNPs can be used as an indicator of proliferation and cytotoxicity.Citation28 Our data showed a clear decrease in the cell index in all lines, which proves their antiproliferative effect.
Previous studies within our study group showed that these AgNPs have antiproliferative and apoptotic effects and they, moreover, increase the production of reactive oxygen species (ROS) at concentrations of 9.0 µg/mL or higher in the L5178Y lymphoma cell line.Citation16 The proliferation/viability assay by reduction of MTT to formazan crystals showed that AgNPs decrease the proliferation of breast cancer cell lines when compared to the control group – except in the HCC1954 cell line, which in this test, did not show significant differences. The mechanism by which AgNPs generate this reduction in proliferation has not been well described. Asharani et al in 2009 proposed three possible mechanisms: 1) chromosomal aberrations, 2) DNA oxidation, and 3) cytoskeletal damage. Furthermore, the increase in ROS and DNA fracture in several studies has been confirmed so far.Citation11,Citation14,Citation30–Citation33 The MTT assay did not provide the cause by which AgNPs decrease proliferation, although it did demonstrate that they have an antiproliferative effect.
The apoptosis assay showed a clear proapoptotic effect on the AgNP-treated cell lines, regardless of breast cancer molecular portraits. However, this proapoptotic effect increased as the prognosis of the cell line worsened. HCC70, classified as triple negative and the cell line with the worst prognosis in this study, showed the greatest apoptotic effect.Citation6,Citation7 The effect of AgNPs on cells can be proven by antiproliferative and apoptotic effects. Studies conducted on MDA-MB-231 and MCF-7 breast cancer lines have shown that exposure to AgNPs of different size and origin can cause caspase-3 activation, reduced expression of Bcl-2, and fragmentation of DNA that will eventually lead to apoptosis.Citation30–Citation32 There is a difference in the effect of AgNPs shown by the assays of apoptosis and proliferation of HCC1954; this can be mostly explained because apoptosis was reported with the set of cells in early and late apoptosis. Cells in early stages of death could be considered viable cells by the MTT assay because they still have some mitochondrial activity and the number of cells undergoing proliferation could be compared to the number of cells in early and late apoptosis, as determined by Annexin V assay.Citation34,Citation35
In order to assess how AgNPs affect adhesion, proliferation, and apoptosis, the genetic expression of cancer cell lines was analyzed. The expression analysis was only conducted in genes related to the biological tests undertaken in the study (). There was a significant change in the expression of genes between the control and AgNP groups as some genes were overexpressed and others underexpressed in different patterns according to their molecular subtype.
Although knowing the expression values of different genes is useful, it does not provide enough information in its functional form. It has been postulated that a better way to systematically uncover gene function and the higher level organization of proteins into biological pathways is through the analysis of molecular interaction networks.Citation36 In order to carry out this analysis, three different approaches have been proposed: 1) fixed-gene set enrichment analysis, 2) new network construction and clustering, and 3) network-based modeling.Citation37 In this study, the third approach was mainly used in order to obtain a better understanding of the impact of genetic expression at the protein level, and it was undertaken with the PGM analysis and its different algorithms.Citation14,Citation19
The 437 genes were processed using the PGM impact analysis, and an interactome was generated with the top 10% (122 nodes 248 edges).Citation21 Then, they were grouped by modularity,Citation20 and the resulting modules are shown in . The size of the nodes is proportional to the PIS (the complete data of is provided in the Supplementary materials). The interactome is not only a graphic representation of the PIS but also shows functional interactions in the genes involved. Some genes with significantly different protein impact, which have been associated as cancer bio-markers are CCNB2, LAMA1, MMP3, SPARC, CKS2, BNIP2, IGFBP7, APC, LAMB3, LPL, COL8A1, and MTA1. CCNB2 has been primarily described as a marker in colorectal carcinoma; it upregulates and coordinates expression of other cell–cycle-related genes by NF-Y might contribute to tumor cell proliferation.Citation38 LAMA1 promotes cell adhesion, invasion, and migration of tumor and endothelial cells, resulting in tumor growth, angiogenesis, and metastasis.Citation39 MMP3 can cause epithelial–mesenchymal transition and malignant transformation in cultured cells.Citation40 SPARC is overexpressed in many cancers, including breast cancer, and the effects of SPARC seem to be cell-type specific,Citation26 as it can induce MMP-2 activation in two invasive breast cancer cell lines (MDA-MB-231 and BT549), but not in a noninvasive counterpart (MCF-7) which lacks MT1-MMP.Citation29 BNIP3 and BNIP2 have been correlated with cell death and necrosis; these genes are underexpressed in breast cancer lines; however, after exposure to AgNPs, the values of the exposed lines seem to approach the values found in random samples.Citation41 The available information on IGFBP7 is controversial; it has been concluded that its alteration is related to cancer. However, depending on the cell line, this gene is either overexpressed or underexpressed.Citation42,Citation43 APC is an important tumor suppressor gene in breast cancer, and PIS values increase considerably after exposure to AgNPs.Citation44 LAMB3 – a gene expressing the laminin protein known to influence cell differentiation, migration, adhesion, proliferation, and survival – demonstrated in silencing studies that it functioned as an oncogene.Citation45,Citation46 LPL is associated with tumor nutrition and proliferation; its expression and activity varies in different types of cancer. LPL has high PIS values in untreated and AgNPs cell lines, although this is not so in random samples of the in silico analysis. This indicates that treatment with AgNPs does not normalize PIS; instead, it causes PIS to increase.Citation47 The expression of COL8A1 is closely related to tumor cell proliferation, invasion, and tumorigenicity in vivo. However, treatment with AgNPs does not affect PIS values.Citation48 MTA1 overexpression correlates significantly with tumor grade and angiogenesis in human breast cancers; nevertheless, PIS values of this gene are significantly lower than those in random samples generated by Reactome FIViz, and exposure to AgNPs does not seem to have any effect.Citation49
Using the enrichment analysis of the set of genes, we can understand the main routes that would be affected by these genes as those related to the extracellular matrix, such as extracellular matrix organization, focal adhesion, and integrin signaling pathway, and with respect to cell death, the intrinsic pathway for apoptosis and direct p53 effectors ().
The PGM pathway analysis uses the PARADIGM algorithm to obtain an IPA score, where all significant data were related to components of the extracellular matrix, such as SPP1-CD44, PECAM1, SPP1, SPP1-Integrin alpha5beta1-alpha9beta1, SPP1-Integrin alphaVBeta1,3,5 and Integrin alphaVbeta3-PECAM1, that regulate cell communication, adhesion, and migration.Citation50 Interaction of β1 integrins with hERG1 channels in cancer cells stimulated distinct signaling pathways that affect different aspects of tumor progression. However, the role of β1 integrins in tumorigenesis has not been fully resolved.Citation51,Citation52 Our data suggest that a lower IPA value increases the cell rate in breast cancer cell lines.
Results obtained in the two different PGM analyses do not show the same scope as in the biological assays related to adhesion, proliferation, and apoptosis. This could be due to the small sample or the absence of other additional data, such as those on methylations, polymorphisms, and copy number variations, which reduce the representability of RNA expression data.
Conclusion
With these results, we can conclude that AgNPs possess a great therapeutic potential against cancer, by decreasing adhesion and proliferation and increasing the percentage of apoptosis. In addition, some genes by which AgNPs carry out their action were identified. However, more studies that focus on the mechanisms of action are needed before AgNPs can be safely used in the clinical setting.
Data sharing statement
All data generated or analyzed during this study are included in this published article (and its Supplementary materials).
Acknowledgments
This project was supported by the Sectorial Fund for Research for Education, CONACYT CB-2015-254174 and UDG-PRO-SNI-2015-2016. The authors would like to thank Lorena Sánchez-Parada, Pablo Ortiz-Lazareno, and Sofia Gomez-Bautista for their support in this research. Finally, the authors offer special thanks to Lorena M Brennan-Bourdon for her help with English editing.
Disclosure
The authors report no conflicts of interest in this work.
References
- FerlayJSoerjomataramIDikshitRCancer incidence and mortality worldwide: sources, methods and major patterns in GLOBOCAN 2012Int J Cancer20151365E359E38625220842
- KessonEMAllardiceGMGeorgeWDBurnsHJMorrisonDSEffects of multidisciplinary team working on breast cancer survival: retrospective, comparative, interventional cohort study of 13 722 womenBMJ2012344e271822539013
- GeelsPEisenhauerEBezjakAZeeBDayAPalliative effect of chemotherapy: objective tumor response is associated with symptom improvement in patients with metastatic breast cancerJ Clin Oncol200018122395240510856099
- SenkusEKyriakidesSOhnoSESMO Guidelines CommitteePrimary breast cancer: ESMO Clinical Practice Guidelines for diagnosis, treatment and follow-upAnn Oncol201526Suppl 5v8v3026314782
- StocklerMWilckenNRGhersiDSimesRJSystematic reviews of chemotherapy and endocrine therapy in metastatic breast cancerCancer Treat Rev200026315116810814559
- PerouCMSørlieTEisenMBMolecular portraits of human breast tumoursNature2000406679774775210963602
- van ‘t VeerLJDaiHvan de VijverMJGene expression profiling predicts clinical outcome of breast cancerNature2002415687153053611823860
- Marambio-JonesCHoekEMVA review of the antibacterial effects of silver nanomaterials and potential implications for human health and the environmentJ Nanopart Res201012515311551
- CarotenutoGPepeGPNicolaisLPreparation and characterization of nano-sized Ag/PVP composites for optical applicationsEur Phys J B20001611117
- KimJSReduction of silver nitrate in ethanol by poly (N-vinylpyrrolidone)J Ind Eng Chem2007134566570
- AsharaniPVHandeMPValiyaveettilSAnti-proliferative activity of silver nanoparticlesBMC Cell Biol20091016519761582
- VasanthKIlangoKMohanKumarRAgrawalADubeyGPAnticancer activity of Moringa oleifera mediated silver nanoparticles on human cervical carcinoma cells by apoptosis inductionColloids Surf B Biointerfaces201411735435924681047
- DuraiPChinnasamyAGajendranBSynthesis and characterization of silver nanoparticles using crystal compound of sodium para-hydroxybenzoate tetrahydrate isolated from Vitex negundo. L leaves and its apoptotic effect on human colon cancer cell linesEur J Med Chem201484909925016231
- AshaRaniPVLow Kah MunGHandeMPValiyaveettilSCytotoxicity and genotoxicity of silver nanoparticles in human cellsACS Nano20093227929019236062
- DangTMDLeTTTFribourg-BlancEDangMCInfluence of surfactant on the preparation of silver nanoparticles by polyol methodAdv Nat Sci: Nanosci Nanotechnol201233035004
- Yañez-SánchezICarreón-ÁlvarezCDLLVelásquez-OrdóñezCSilver nanoparticles induce apoptosis in L5178Y lymphoma by lipoperoxide activityDig J Nanomater Biostruct20149416811687
- MosmannTRapid colorimetric assay for cellular growth and survival: application to proliferation and cytotoxicity assaysJ Immunol Methods1983651–255636606682
- HansenMBNielsenSEBergKRe-examination and further development of a precise and rapid dye method for measuring cell growth/cell killJ Immunol Methods198911922032102470825
- WuGDawsonEDuongAHawRSteinLReactomeFIViz: a Cytoscape app for pathway and network-based data analysis. Version 2F1000Res2014314625309732
- NewmanTBoehnleinAEckhoffPPeaseAinventorsRemote inspection deviceUnited States patentUS20060281972 A120061214 Google Patents
- StevensAMeyerSHansonDClaytonPDonnRPNetwork analysis identifies protein clusters of functional importance in juvenile idiopathic arthritisArthritis Res Ther2014163R10924886659
- BenjaminiYHochbergYControlling the false discovery rate: a practical and powerful approach to multiple testingJ R Statist Soc B1995571289300
- VaskeCJBenzSCSanbornJZInference of patient-specific pathway activities from multi-dimensional cancer genomics data using PARADIGMBioinformatics20102612i237i24520529912
- BlancoEFerrariMEmerging nanotherapeutic strategies in breast cancerBreast2014231101824215984
- YezhelyevMVGaoXXingYAl-HajjANieSO’ReganRMEmerging use of nanoparticles in diagnosis and treatment of breast cancerLancet Oncol20067865766716887483
- DhanesuanNSharpJABlickTPriceJTThompsonEWDoxycycline-inducible expression of SPARC/Osteonectin/BM40 in MDA-MB-231 human breast cancer cells results in growth inhibitionBreast Cancer Res Treat2002751738512500936
- KielyMHodginsSJMerriganBATormeySKielyPAO’ConnorEMReal-time cell analysis of the inhibitory effect of vitamin K2 on adhesion and proliferation of breast cancer cellsNutr Res201535873674326082424
- DowlingCMHerranz OrsCKielyPAUsing real-time impedance-based assays to monitor the effects of fibroblast-derived media on the adhesion, proliferation, migration and invasion of colon cancer cellsBiosci Rep2014344 pii: e00126
- GillesCBassukJAPulyaevaHSageEHFoidartJMThompsonEWSPARC/osteonectin induces matrix metalloproteinase 2 activation in human breast cancer cell linesCancer Res19985823552955369850090
- LalithaPApoptotic efficacy of biogenic silver nanoparticles on human breast cancer MCF-7 cell linesProg Biomater201542–411312126566469
- JeyarajMSathishkumarGSivanandhanGBiogenic silver nanoparticles for cancer treatment: an experimental reportColloids Surf B Biointerfaces2013106869223434696
- GajendranBChinnasamyADuraiPRamanJRamarMBiosynthesis and characterization of silver nanoparticles from Datura inoxia and its apoptotic effect on human breast cancer cell line MCF7Mater Lett201412298102
- HsinYHChenCFHuangSShihTSLaiPSChuehPJThe apoptotic effect of nanosilver is mediated by a ROS-and JNK-dependent mechanism involving the mitochondrial pathway in NIH3T3 cellsToxicol Lett2008179313013918547751
- Oropesa-ÁvilaMAndrade-TalaveraYGarrido-MaraverJStabilization of apoptotic cells: generation of zombie cellsCell Death Dis201458e136925118929
- Povea-CabelloSOropesa-ÁvilaMde la Cruz-OjedaPDynamic reorganization of the cytoskeleton during apoptosis: the two coffins hypothesisInt J Mol Sci20171811 pii: E2393
- HuPBaderGWigleDAEmiliAComputational prediction of cancer-gene functionNat Rev Cancer200771233417167517
- CreixellPReimandJHaiderSMutation Consequences and Pathway Analysis Working Group of the International Cancer Genome ConsortiumPathway and network analysis of cancer genomesNat Methods201512761562126125594
- ParkSHYuGRKimWHMoonWSKimJHKimDGNF-Y–dependent cyclin B2 expression in colorectal adenocarcinomaClin Cancer Res200713385886717289878
- AlmiñanaNGrau-OlieteMRReigFRivera-FillatMPIn vitro effects of SIKVAV retro and retro-enantio analogues on tumor metastatic eventsPeptides200425225125915063006
- RadiskyDCLevyDDLittlepageLERac1b and reactive oxygen species mediate MMP-3-induced EMT and genomic instabilityNature2005436704712312716001073
- SharmaMApoptosis-antagonizing transcription factor (AATF) gene silencing: role in induction of apoptosis and down-regulation of estrogen receptor in breast cancer cellsBiotechnol Lett201335101561157023801113
- LandbergGOstlundHNielsenNHDownregulation of the potential suppressor gene IGFBP-rP1 in human breast cancer is associated with inactivation of the retinoblastoma protein, cyclin E overexpression and increased proliferation in estrogen receptor negative tumorsOncogene200120273497350511429696
- TanDZhangJNieXHistone 3 trimethylation of IGFBP-7 gene promoter by expression of D5 Stat5a in breast epithelial cellsChin J Physiol201558527528426387651
- HeKZhangLLongXQuantitative assessment of the association between APC promoter methylation and breast cancerOncotarget2016725379203793027191268
- WangXMLiJYanMXIntegrative analyses identify osteopontin, LAMB3 and ITGB1 as critical pro-metastatic genes for lung cancerPLoS One201382e5571423441154
- YamamotoNKinoshitaTNohataNTumor suppressive microRNA-218 inhibits cancer cell migration and invasion by targeting focal adhesion pathways in cervical squamous cell carcinomaInt J Oncol20134251523153223483249
- KuemmerleNBRysmanELombardoPSLipoprotein lipase links dietary fat to solid tumor cell proliferationMol Cancer Ther201110342743621282354
- MaZHMaJHJiaLZhaoYFEffect of enhanced expression of COL8A1 on lymphatic metastasis of hepatocellular carcinoma in miceExp Ther Med20124462162623170115
- BalasenthilSBroaddusRRKumarRExpression of metastasis-associated protein 1 (MTA1) in benign endometrium and endometrial adenocarcinomasHum Pathol200637665666116733204
- SuzukiKZhuBRittlingSRColocalization of intracellular osteopontin with CD44 is associated with migration, cell fusion, and resorption in osteoclastsJ Bone Miner Res20021781486149712162503
- Moreno-LaysecaPUcarASunHThe requirement of integrins for breast epithelial proliferationEur J Cell Biol201796322723928363396
- BecchettiACrescioliSZanieriFThe conformational state of hERG1 channels determines integrin association, downstream signaling, and cancer progressionSci Signal201710473 pii: eaaf3236