
Abstract
Background
DNA methyltransferase 1 (DNMT1), a dominant enzyme responsible for the transfer of a methyl group from the universal methyl donor to the 5-position of cytosine residues in DNA, is essential for mammalian development and closely related to cancer and a variety of age-related chronic diseases. DNMT1 has become a useful biomarker in early disease diagnosis and a potential therapeutic target in cancer therapy and drug development. However, till now, most of the studies on DNA methyltransferase (MTase) detection have focused on the prokaryote MTase and its activity.
Methods
A magnetic fluorescence-linked immunosorbent assay (FLISA) using CdSe/ZnS quantum dots as fluorescent probes was proposed for the rapid and sensitive detection of the DNMT1 level in this study. Key factors that affect the precision and accuracy of the determination of DNMT1 were optimized.
Results
Under the optimal conditions, the limit of detection was 0.1 ng/mL, the linear range was 0.1–1,500 ng/mL, the recovery was 91.67%–106.50%, and the relative standard deviations of intra- and inter-assays were respectively 5.45%–11.29% and 7.03%–11.25%. The cross-reactivity rates with DNA methyltransferases 3a and 3b were only 4.0% and 9.4%, respectively. Furthermore, FLISA was successfully used to detect the levels of DNMT1 in human serum samples, and compared with commercial enzyme-linked immunosorbent assay (ELISA) kits. The results revealed that there was a good correlation between FLISA and commercial ELISA kits (correlation coefficient r=0.866, p=0.001). The linear scope of FLISA was broader than ELISA, and the measurement time was much shorter than ELISA kits.
Conclusion
These indicated that the proposed FLISA method was sensitive and high throughput and can quickly screen the level of DNMT1 in serum samples.
Introduction
According to the latest statistical report of the WHO, a large number of people all over the world are suffering from four main types of chronic diseases including cancer, diabetes, angiocardiopathy, and chronic respiratory diseases. These chronic diseases with poor therapeutic options, adverse prognosis, and high mortality rates have become a major public health problem and kill 40 million people each year, equivalent to 70% of all deaths globally.Citation1 Aside from hereditary factors, researchers have found that early molecular events of cancer and other chronic diseases are closely related to epigenetic modification of genome.Citation2,Citation3
The methylation of DNA is the most well-known epigenetic modification, which is essential for the growth and development of the organism because it can maintain the genomic stability.Citation4 However, hypermethylation or hypomethylation of DNA may influence normal cellular functions and phenotypes in different stages of life, such as X-chromosome inactivation,Citation5 cellular proliferation and differentiation,Citation6 and gene expression.Citation7 Numerous studies have showed that aberrant DNA methylation plays a crucial role in the progression and prognosis of various types of cancers.Citation8–Citation10 DNA methylation is carried out by DNA methyltransferase (MTase) which catalyzes the transfer of a methyl group from S-adenosylmethionine (SAM) to the target adenine or cytosine.Citation11,Citation12 Many studies have revealed that altered levels of DNA methyltransferase 1 (DNMT1) expression or activity have frequently been associated with several types of tumors.Citation13,Citation14 DNA MTase has become a useful biomarker in early disease diagnosis and a potential therapeutic target in cancer therapy and drug development. Therefore, detection of DNA methylation and the level of DNA MTase is important for clinical diagnosis of future genetic diseases.
Till now, most of the studies on DNA MTase detection have focused on its activity, and the methods employed in many laboratories mainly include polymerase chain reaction,Citation15 radioactive labeling assay,Citation16 high-performance liquid chromatography,Citation17 and colorimetric assay.Citation18 Furthermore, in order to simplify the process, shorten the analysis time, improve the sensitivity, and lower the cost, many new techniques and methods such as fluorescence methods based on hairpin DNA probe,Citation19–Citation21 enzyme immunoassay based on gold nanoparticles,Citation22,Citation23 surface-enhanced Raman spectroscopy,Citation24,Citation25 chemiluminescence assay,Citation26,Citation27 electrochemical methods,Citation28–Citation31 and so on have been designed to evaluate the activity of DNA MTase.
However, the target in almost all of the above-mentioned methods is DNA adenine MTase or CpG MTase which is present in the prokaryotes. In mammals, the methyl group from SAM is predominantly added to the carbon-5 position of cytosine in CpG islands, which is catalyzed by DNA MTases including DNMT1, DNA methyltransferase 3a (DNMT3a), and DNA methyltransferase 3b (DNMT3b).Citation32 DNMT1 encodes the maintenance methyltransferase and can be directly involved in DNA damage repair in a DNA methylation-independent manner,Citation33 and it is often regarded as an independent clinical diagnostic and prognostic factor. Among the studies on the determination of DNA MTase, only some have focused on human DNMT1,Citation34,Citation35 and the current methods are limited to laboratory study and have not been applied in the detection of DNMT1 level in serum samples, and hence cannot achieve the high-throughput screening in clinical practice. Therefore, it is necessary to establish another efficient, simple, rapid, and high-throughput method for the detection of DNMT1 level in serum samples to meet the future clinical needs.
Fluorometry including direct fluorescence and amplified fluorescence is one of the most frequently used assays in the detection of DNA MTase activity.Citation36 Compared with conventional organic fluorescent dyes, quantum dots (QDs), a new kind of fluorescent nanoprobes, have wide and continuous excitation spectrum, narrow and symmetric emission spectrum, and high quantum yield. The surface of QDs can be modified on target biomolecules through electrostatic adsorption, hydrophobic interaction, covalent crosslinking, etc. Thus, QDs have been widely favored by scientific researchers and showed broad applications in the analysis of proteins,Citation37 nucleic acids,Citation38 and small biological molecules.Citation39
Herein, taking advantage of good photochemical stability and signal-enhancing effect of QDs, together with rapid separation of magnetic carboxyl beads and specificity of immunoreactions,Citation40 we developed a novel fluorescence-linked immunosorbent assay (FLISA) for detection of human DNMT1 level. This method was further used for the quantitative analysis of DNMT1 in serum samples and compared with the commercial enzyme-linked immunosorbent assay (ELISA) kits. The results of paired sample t-test showed that there was no significant difference between FLISA and commercial ELISA kits. Thus, the method developed in this study is a sensitive, rapid, and high-throughput method for the determination of DNMT1 and can be used in future clinical practice.
Materials and methods
Materials and instruments
DNMT1 was obtained from OriGene Technologies Inc. (Rockville, MD, USA). DNMT1 monoclonal antibody (McAb) was obtained from Beijing Biodragon Immuno-technologies Co., Ltd. (Beijng, People’s Republic of China). DNMT1 polyclonal antibody (PcAb) was obtained from ABclonal Biotechnology Co., Ltd (Chinese agent). Fe3O4 magnetic beads (MBs) grafted with carboxyl groups were supplied by BioMag Scientific Inc. (Wuxi, People’s Republic of China). CdSe/ZnS QDs (Ex =320 nm, Em =520 nm) were purchased from Wuhan Jiayuan Quantum Dots Co., Ltd. (Wuhan, People’s Republic of China). DNMT1 ELISA kits were provided by Kang Lang Biological Technology Co., Ltd (Shanghai, People’s Republic of China). Bovine serum albumin (BSA) was obtained from Solarbio Life Sciences (Beijing, People’s Republic of China). 3-Dimethylaminopropyl-N′-ethylcarbo-diimide hydrochloride (EDC, 98.0%) and N-hydroxysuccinimide (NHS, 98%) were bought from Aladdin Chemistry Co., Ltd (Beijing, People’s Republic of China). Other reagents were of analytical grade. Water used in the experiment was Milli-Q ultrapure water (resistivity was greater than 18.2 MΩ⋅cm). Serum samples were taken from the Department of Respiratory and Critical Care of the First Affiliated Hospital of Zhengzhou University.
The buffers used in the experiment were as follows: (A) 0.01 mol/L phosphate buffer saline (PBS), pH 7.4; (B) 0.01 mol/L phosphate buffer saline with 0.05% Tween-20 (PBST), pH 7.4; (C) 0.05 mol/L carbonate buffer (CB), pH 9.0; (D) 0.01 mol/L borate saline (BS) buffer, pH 7.4; and (E) 0.01 mol/L morpholine ethanesulfonic acid (MES) buffer, pH 6.0.
The fluorescence signal or ELISA absorbance was detected by Multi-Mode Microplate Reader (SpectraMax M2e; Sunnyvale, CA, USA). A transmission electron microscope (H600; Hitachi, Tokyo, Japan) was used to investigate the morphology of MBs and MBs@McAb. Ninety-six-well polystyrene plates were provided by Jet Bio-Filtration Co., Ltd. (Guangzhou, People’s Republic of China). Magnetic panel (used for magnetic separation) was supplied by BioMag Scientific Inc. Centrifuge was provided by Eppendorf China Ltd. (5424R; Shanghai, People’s Republic of China).
Principle and procedure of FLISA
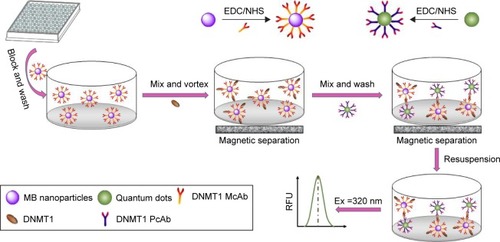
The principle of FLISA is shown in . At first, EDC/NHS agents were used to couple DNMT1 McAb to MBs or PcAb to QDs to obtain MBs@McAb and QDs@ PcAb complexes, respectively. Then, MBs@McAb solution was added into the serum samples to capture and enrich the free DNMT1. After washing and magnetic separation, QDs@PcAb was added into the system to combine with DNMT1 on MBs@McAb and form the sandwich complex. The amount of the QDs@PcAb bound to MBs@McAb depended on the quantity of free DNMT1 in the sample. At the end, we analyzed the content of DNMT1 in serum through monitoring the fluorescence intensity of QDs in the solution ().
The concrete operating procedure of FLISA was as follows. At first, the 96-well plate was blocked by 300 μL PBS with 1% (w/v) BSA at 37°C for 1.5 h. MBs@McAb was diluted 50-fold with CB, and 100 μL of this solution was added into each well of the black 96-well plate. The 96-well plate was placed on a magnet panel for a while, and the supernatant was discarded. Then, the microplate was washed three times with PBST, and all the supernatants were discarded again. After that, 100 μL of DNMT1 standard solutions or serum samples was added to the microplate, and the mixture was incubated at 37°C for 60 min followed by magnetic separation and washing three times with PBST. Subsequently, QDs@PcAb was diluted 30-fold with PBST, and 100 μL of this solution was added into each well of the same microplate. After incubation at 37°C for 120 min, the mixture was magnetically separated, the supernatant was dumped, and the precipitates were washed five times with PBST. Finally, the magnet panel was removed, 100 μL of PBST was added into each well to suspend the solution, and the fluorescence intensity was measured using Multi-Mode Microplate Reader.
Preparation of MBs@McAb bioconjugates
EDC/NHS was used to immobilize DNMT1 McAb on the surface of Fe3O4 magnetic carboxyl beads. The detailed steps were as follows. First, 100 μL of 10 mg/mL EDC and NHS solution was added into 1 mg MBs solution sequentially in a tube, and the mixture was allowed to react for 15 min at room temperature by vortexing. Then, the solution was successively washed on a magnet with MES buffer and PBS three times, and the supernatant was abandoned. Following this, 50 μL of 1.0 mg/mL DNMT1 McAb was added into the tube to react for 120 min at room temperature by vortexing, and rinsed with PBST five times on a magnet again to remove the free McAb. Then, blocking buffer was added into the solution and kept at room temperature for 60 min to block the uncoated active sites on MBs. The final concentration of MBs@McAb was 1.0 mg/mL (calculated by Fe3O4 MBs).
Preparation of QDs@PcAb bioconjugates
Immobilization of DNMT1 PcAb on the surface of QDs was also carried out using EDC/NHS. For this, 10 μL QDs and 44 μL of 1 mg/mL DNMT1 PcAb were added into BS buffer (pH 7.4) in a tube and vibrated for sufficient mixing. Then, 3 μL of 10 mg/mL EDC and NHS solution was added into the mixture and reacted for 2 h at room temperature by vortexing. After that, 20 μL PBS including 0.5% BSA was added into the mixture and kept at room temperature for 30 min to block the uncoated active sites on QDs. Then, redundant EDC was removed by ultrafiltration at 4°C five times (12,000 rpm, each time for 5 min). Finally, the QDs@ PcAb was stored at 4°C for use, and the final concentration was 1 μmol/L (calculated by QDs).
Characterization of the MBs@McAb and QDs@PcAb
Transmission electron microscopy (TEM) was employed to characterize the external feature of MBs and MBs@McAb. Sandwich ELISA was employed to characterize the biological activity of MBs@McAb. Firstly, we added 100 μL of MBs@ McAb into the wells of the microtiter plates followed by washing and magnetic separation. Then, 400 ng/mL DNMT1 solution was injected into MBs@McAb for immune response. After washing and magnetic separation, the HRP@PcAb was added into the mixed solutions to cause a sandwich reaction, and the optical density (OD) of each well was measured. The biological activity of QDs@PcAb was characterized by sandwich fluorescence immunoassay. First, we added 100 μL MBs@McAb and DNMT1 solution into the wells of the black microtiter plates followed by washing and magnetic separation, and then 100 μL of QDs@PcAb of different concentrations was added into the mixed solutions to cause sandwich reaction. After washing and magnetic separation to remove free QDs@PcAb, the fluorescence intensity (relative fluorescence units, RFU) of each well was measured.
Preparation of serum sample
All serum samples were collected in the morning after overnight fasting. Three milliliters of venous blood was drawn and placed in a non-anticoagulant tube. After placing for 30 min in 37°C water bath, the serum was separated by centrifugation under low temperature at 3,000 rpm for 5 min, and then stored at −80°C. The serum samples with hemolysis were abandoned. This study was approved by the Ethical Committee of the Zhengzhou University.
Results and discussion
Characterization of MBs@McAb and QDs@PcAb
The TEM images of MBs and MBs@McAb are shown in . From , we could see the MBs were well-defined spherical particles and the average size was about 300 nm. The TEM image of MBs@McAb () showed distinctly that the average size of the spherical particles was still about 300 nm, but the margins were not clear due to modification by McAb.
Figure 1 (A) TEM image of the bare MBs. (B) TEM image of MBs coated with DNMT1 McAb (MBs@McAb). (C) Characterization of biological activity of MBs@McAb. (D) Characterization of biological activity of QDs@PcAb.
Abbreviations: TEM, transmission electron microscopy; MBs, magnetic beads; DNMT1, DNA methyltransferase 1; McAb, monoclonal antibody; QDs, quantum dots; PcAb, polyclonal antibody; OD, optical density; RFU, relative fluorescence units.
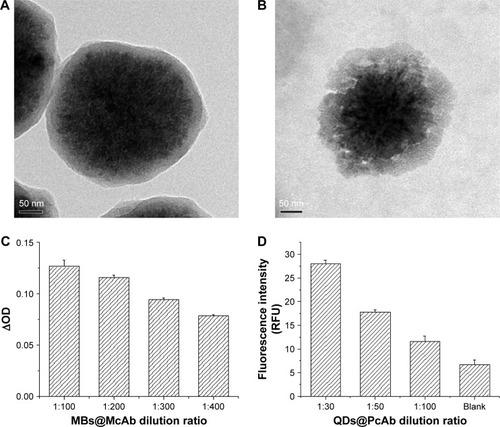
The activity identification results of MBs@McAb are shown in , from which we could see the final ODs of MBs@McAb with 400 ng/mL DNMT1 were higher than that without DNMT1, and the ∆ODs declined with the increase of the MBs@McAb dilution ratio, which showed that the McAb was successfully added on the surface of MBs, and the immobilized McAb still possessed the immunoreactivity to DNMT1 ().
The activity identification results of QDs@PcAb are shown in , from which we could see the fluorescence intensity decreased with the increase of the QDs@ PcAb dilution ratio. It indicated that the QDs@PcAb compound was successfully prepared and the immunoreactivity of antibody labeled on QDs still existed.
Optimization of the FLISA method
Dilution ratio of MBs@McAb
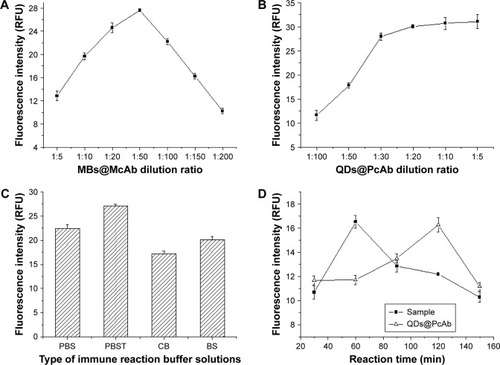
The dilution ratio of MBs@McAb was optimized because the concentration of MBs@McAb was a key factor for the sensitivity of the FLISA method. MBs@McAb was serially diluted by CB, and then the experiments were conducted according to the procedure of FLISA. From , we could see the fluorescence intensity of the system increased first and then decreased rapidly. This phenomenon can be explained by the following two reasons. First, MB particles could cause fluorescence due to QDs quenching, and the quenching effect enhanced with the increase of MBs@McAb concentration. Second, the fluorescence quenching may be a false-negative signal due to the hook effect. So, 1:50 dilution of MBs@McAb with the highest fluorescence intensity was chosen for further experiments.
Figure 2 (A) The effect of MBs@McAb dilution ratio on fluorescence intensity. (B) The effect of QDs@PcAb dilution ratio on fluorescence intensity. (C) The effect of different immune reaction buffers on fluorescence intensity. (D) The best reaction time of MBs@McAb and QDs@PcAb with DNMT1 in serum sample.
Abbreviations: MBs, magnetic beads; McAb, monoclonal antibody; QDs, quantum dots; PcAb, polyclonal antibody; DNMT1, DNA methyltransferase 1; RFU, relative fluorescence units; PBS, phosphate buffer saline; PBST, phosphate buffer saline with 0.05% Tween-20; CB, carbonate buffer; BS, borate saline.
Dilution ratio of QDs@PcAb
The concentration of QDs@PcAb would influence the fluorescence intensity and thus the sensitivity of the method. So, the effect of QDs@PcAb concentration on the fluorescence intensity was studied. As shown in , fluorescence intensity was increased at first and remained at a steady state after 1:20 dilution. The ascending trend of fluorescence intensity was not obvious when the dilution ratio of QDs@ PcAb was less than 1:30. So, 1:30 dilution of QDs@PcAb was selected for further experiments.
Buffers of immune reaction
The following buffers were studied and optimized: 0.01 mol/L pH 7.4 PBS, 0.01 mol/L pH 7.4 PBST, 0.01 mol/L pH 7.4 BS, and 0.05 mol/L pH 9.6 CB. From the results shown in , we could see that the best fluorescence intensity could be obtained with the 0.01 mol/L pH 7.4 PBST because surfactant Tween-20 contained in PBST could improve the dispersion of the QDs and reduce the fluorescence quenching caused by aggregation. So, 0.01 mol/L pH 7.4 PBST was selected as the optimal immune reaction buffer.
Reaction time of DNMT1 and QDs@PcAb
The reaction times between MBs@McAb and DNMT1 and between QDs@PcAb and DNMT1 were optimized. shows that the reaction of MBs@McAb capturing DNMT1 and the sandwich fluorescence immunoassay with QDs@ PcAb achieved the best effects at 60 min and 120 min, respectively. So, 60 min for MBs@McAb reaction with DNMT1 and 120 min for sandwich immunoassay with QDs@PcAb were selected for further experiments ().
Performance of FLISA
Calibration curve and linear range
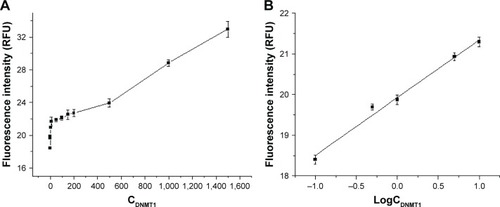
Under the selected conditions, a calibration curve for DNMT1 was developed. The linear range of FLISA was 0.1–1,500 ng/mL and could be divided into two sections (). The standard curve equation of 0.1–10.0 ng/mL was Y =1.421X +19.92 (X was logCDNMT1, Y was fluorescence intensity) with a correlation coefficient of 0.9948 (), while the standard curve equation of 10–1,500 ng/mL was Y =0.0076X +21.25 (X was CDNMT1, Y was fluorescence intensity) with a correlation coefficient of 0.9933. The detection limit of FLISA was 0.1 ng/mL ().
Figure 3 (A) The relationship between fluorescence intensity and DNMT1 concentration (0.1–1,500 ng/mL). (B) The relationship between fluorescence intensity and logCDNMT1 (0.1–10 ng/mL).
Abbreviations: DNMT1, DNA methyltransferase 1; RFU, relative fluorescence units.
Scheme 1 The principle of FLISA.
Abbreviations: FLISA, fluorescence-linked immunosorbent assay; EDC, 3-dimethylaminopropyl-N′-ethylcarbo-diimide hydrochloride; NHS, N-hydroxysuccinimide; MBs, magnetic beads; DNMT1, DNA methyltransferase 1; McAb, monoclonal antibody; PcAb, polyclonal antibody; RFU, relative fluorescence units.
Precision and accuracy
Different concentrations (100, 200, and 500 ng/mL) of standard DNMT1 samples were detected simultaneously in the same microplate for three times to evaluate the intra-assay precision, and determined in different microplates for three times to evaluate the inter-assay precision. The relative standard deviations of intra- and inter-assays were 5.45%–11.29% and 7.03%–11.25%, respectively.
Three spiked samples (50, 500, and 1,000 ng/mL) were prepared by adding DNMT1 to serum samples to evaluate the accuracy by recovery, and the detection was repeated three times. The results revealed that the recoveries of FLISA were 91.67%–106.50% ().
Table 1 The results of comparison between FLISA and ELISA kits
Specificity
DNMT3a and DNMT3b were used to evaluate the specificity of FLISA. The detection was repeated three times, and the cross-reactivity rates of DNMT3a and DNMT3b were calculated to be 4.0% and 9.4%, respectively.
Sample analysis and methods comparison
DNMT1 is a potent tumor marker, and though there are several methods available at present for detecting the concentration of human DNMT1, the only commercial high-throughput method is ELISA. So, we compared the FLISA with the conventional ELISA in detecting DNMT1 in serum samples to evaluate the efficacy of the method proposed in this study. Ten serum samples were taken to detect the concentration of DNMT1 using FLISA and commercial ELISA kits (detection in each sample was repeated three times). Paired sample t-test was employed to evaluate the difference between the two methods. The results revealed that there was a good correlation between FLISA and commercial ELISA kits (correlation coefficient r=0.866, p=0.001) and no significant difference between the two methods in the detection of DNMT1 content in serum samples (t=0.644, p=0.536; and ). The limit of detection of the FLISA developed in this study was the same as that of ELISA kits, the linear scope of FLISA was broader than ELISA, and measurement time was shorten by 40% than ELISA kits for detection of nearly 80 samples. These indicated that the proposed FLISA method was a sensitive, high-throughput, and time-saving method for the determination of DNMT1 in serum samples, and could be used in research and clinical practice ().
Table 2 The results of serum samples detection by FLISA and ELISA kits
Conclusion
We developed a novel fluorescence immunoassay for sensitive detection of the level of DNMT1 based on the CdSe/ZnS QDs and magnetic separation technology. Taking advantage of the good photochemical stability of QDs, rapid separation ability of MBs, and specificity of immunoreactions, this method could detect the level of DNMT1 in serum as low as 0.1 ng/mL with a good accuracy. The analysis was performed in a 96-well microplate, and the method could analyze more than 90 serum samples at one time within few hours, which meant that it is a high-throughput screening method and is more time-saving than most other methods. The successful application in human serum further demonstrated that the assay would be of great potential for the detection of DNMT1 in complex biological samples. Compared with commercial ELISA kits, the proposed FLISA method exhibited linear scope, and high sensitivity and specificity, which indicated the proposed strategy has potential application in detection of DNMT1 level in serum samples in future clinical practice.
Acknowledgments
This work was supported by the National Natural Science Foundation of China (Nos 81402721, 81573203, 21605131) and Science and Technology Department of Henan Province (No 22170004).
Disclosure
The authors report no conflicts of interest in this work.
References
- HaySIJayaramanSPManzanoAGCGBD 2015 Risk Factors CollaboratorsGlobal, regional, and national comparative risk assessment of 79 behavioural, environmental and occupational, and metabolic risks or clusters of risks, 1990–2015 a systematic analysis for the Global Burden of Disease Study 2015Lancet201738910064E1
- QiuJEpigenetics: unfinished symphonyNature2006441709014314516688142
- JonesPABaylinSBThe fundamental role of epigenetic events in cancerNat Rev Genet20023641542812042769
- SchübelerDFunction and information content of DNA methylationNature2015517753432132625592537
- CottonAMLamLAffleckJGChromosome-wide DNA methylation analysis predicts human tissue-specific X inactivationHum Genet2011130218720121597963
- LakerRCRyallJGDNA methylation in skeletal muscle stem cell specification, proliferation, and differentiationStem Cells Int20162016572592726880971
- InabaYSchwartzCEBuiQMEarly detection of fragile X syndrome: applications of a novel approach for improved quantitative methylation analysis in venous blood and newborn blood spotsClin Chem201460796397324778142
- ClarkeMALuhnPGageJCDiscovery and validation of candidate host DNA methylation markers for detection of cervical precancer and cancerInt J Cancer2017141470171028500655
- ZhouCCLiJYLiQCDKN2A methylation in esophageal cancer: a meta-analysisOncotarget2017830500715008328637022
- HuangJLiouYLKangYNTanZRPengMJZhouHHReal-time colorimetric detection of DNA methylation of the PAX1 gene in cervical scrapings for cervical cancer screening with thiol-labeled PCR primers and gold nanoparticlesInt J Nanomed20161153355347
- FarooqiAATangJYLiRNEpigenetic mechanisms in cancer: push and pull between kneaded erasers and fate writersInt J Nanomed20151031833191
- KrejcovaLRichteraLHynekDLabudaJAdamVCurrent trends in electrochemical sensing and biosensing of DNA methylationBiosens Bioelectron20179738439928641203
- WangHCChenCWYangCTumor-associated macrophages promote epigenetic silencing of gelsolin through DNA methyltransferase 1 in gastric cancer cellsCancer Immunol Res201751088589728835422
- YangANSunYGaoYReciprocal regulation between miR-148a/152 and DNA methyltransferase 1 is associated with hyperhomocysteinemia-accelerated atherosclerosisDNA Cell Biol201736646247428472596
- WangHQLiuWYWuZHomogeneous label-free genotyping of single nucleotide polymorphism using ligation-mediated strand displacement amplification with DNAzyme-based chemiluminescence detectionAnal Chem20118361883188921348511
- GrosCChauvignéLPouletADevelopment of a universal radioactive DNA methyltransferase inhibition test for high-throughput screening and mechanistic studiesNucleic Acids Res20134119e185e19623980028
- Iglesias GonzálezTBlanco-GonzálezEMontes-BayonMNew strategy to address DNA-methyl transferase activity in ovarian cancer cell cultures by monitoring the formation of 5-methylcytosine using HPLC-UVJ Chromatogr B Analyt Technol Biomed Life Sci201610281624
- LiZMZhongZHLiangRPQiuJDThe colorimetric assay of DNA methyltransferase activity based on strand displacement amplificationSens Actuators B Chem2017238626632
- LiJYanHFWangKTanWHZhouXWHairpin fluorescence DNA probe for real-time monitoring of DNA methylationAnal Chem20077931050105617263334
- XueQLvYWXuSQHighly sensitive fluorescence assay of DNA methyltransferase activity by methylation-sensitive cleavage-based primer generation exponential isothermal amplification-induced G-quadruplex formationBiosens Bioelectron20156654755325506903
- WangGLLuoHQLiNBGold nanorods-based FRET assay for ultra-sensitive detection of DNA methylation and DNA methyltransferase activityAnalyst2014139184572457725028809
- LiuTZhaoJZhangDLiGNovel method to detect DNA methylation using gold nanoparticles coupled with enzyme-linkage reactionsAnal Chem201082122923319954204
- LiWLiuZLinHLabel-free colorimetric assay for methyl-transferase activity based on a novel methylation-responsive DNAzyme strategyAnal Chem20108251935194120148579
- HuPPLiuHZhenSJLiCMHuangCZNanosilver-based surface-enhanced Raman spectroscopic determination of DNA methyltransferase activity through real-time hybridization chain reactionBiosens Bioelectron20157322823326086442
- LiXSongTGuoXDNA methylation detection with end-to-end nanorod assembly-enhanced surface plasmon resonanceAnalyst2015140186230623326238553
- ChenCLiBChemiluminescence resonance energy transfer biosensing platform for site-specific determination of DNA methylation and assay of DNA methyltransferase activity using exonuclease III-assisted target recycling amplificationBiosens Bioelectron201454485424240168
- LiYYanZZhengJQiHLabel-free and amplified electrogenerated chemiluminescence biosensing method for the determination of DNA methyltransferase activity using signal reagent-assembled graphene oxideElectrochim Acta2014137454461
- BaekSWonBYParkKSParkHGAn electrochemical one-step system for assaying methyltransferase activity based on transport of a quantum dot signaling tracerBiosens Bioelectron2013491054254623777705
- HeXSuJWangYWangKNiXChenZA sensitive signal-on electrochemical assay for MTase activity using AuNPs amplificationBiosens Bioelectron201128129830321820304
- ZhangLWeiMGaoCWeiWZhangYLiuSLabel-free electrochemical detection of methyltransferase activity and inhibitor screening based on endonuclease HpaII and the deposition of polyanilineBiosens Bioelectron20157318819426070170
- WangGLZhouLYLuoHQLiNBElectrochemical strategy for sensing DNA methylation and DNA methyltransferase activityAnal Chim Acta20137681768123473252
- RobertsonKDDNA methylation, methyltransferases, and cancerOncogene200120243139315511420731
- JinBRobertsonKDDNA methyltransferases, DNA damage repair, and cancerAdv Exp Med Biol201375432922956494
- MurenNBBartonJKElectrochemical assay for the signal-on detection of human DNA methyltransferase activityJ Am Chem Soc201313544166321664024164112
- ZhangHDongHLYangGQChenHFCaiCXSensitive electrochemical detection of human methyltransferase based on a dual signal amplification strategy coupling gold nanoparticle-DNA complexes with Ru(III) redox recyclingAnal Chem20168822111081111427730812
- PohWJWeeCPGaoZQDNA methyltransferase activity assays: advances and challengesTheranostics20166336939126909112
- YezhelyevMVAl-HajjAMorrisCIn situ molecular profiling of breast cancer biomarkers with multicolor quantum dotsAdv Mater2007192031463151
- ZhangCYYehHCKurokiMTWangTHSingle-quantum-dot-based DNA nanosensorNat Mater200541182683116379073
- ZhangWHanYChenXSurface molecularly imprinted polymer capped Mn-doped ZnS quantum dots as a phosphorescent nanosensor for detecting patulin in apple juiceFood Chem201723214515428490057
- ParkHHwangMPLeeKHImmunomagnetic nanoparticle-based assays for detection of biomarkersInt J Nanomed2013845434552