
Abstract
Background
Poly lactide (PLA) was proved in the last years to be good for use in sustained drug delivery and as carriers for vaccine antigens. In our previous research, pachyman (PHY)-encapsulated PLA (PHYP) nanospheres were synthesized and their function of controlling drug release was demonstrated.
Purpose
In order to modify the fast drug-release rate of PHY when inoculated alone, the maturation of bone marrow dendritic cells (BMDCs) in vitro and their immunological enhancement in vivo were explored using PHYP nanospheres.
Methods
The maturation and antigen uptake of BMDCs were evaluated, both alone and with formulated antigen PHYP nanospheres, ie, ovalbumin (OVA)-loaded PHYP nanospheres, as an antigen delivery system, to investigate antigen-specific humoral and cellular immune responses.
Results
The results indicated that, when stimulated by PHYP, the BMDCs matured as a result of upregulated expression of co-stimulatory molecules; the mechanism was elucidated by tracing fluorescently labeled antigens in confocal laser scanning microscopy images and observing the uptake of nanospheres by transmission electron microscopy. It was further revealed that mice inoculated with OVA-PHYP had augmented antigen-specific IgG antibodies, increased cytokine secretion by splenocytes, increased splenocyte proliferation, and activation of cluster of differentiation (CD)4+ and CD8+ T cells in vivo. Elevated immune responses were produced by OVA-PHYP, possibly owing to the activation and maturation of dendritic cells (in draining lymph nodes).
Conclusion
It was corroborated that PHY- and/or OVA-encapsulated PLA nanospheres elicited prominent antigen-presenting effects on BMDCs and heightened humoral and cellular immune responses compared with other formulations.
Introduction
Pachyman (PHY), a linear β-d-(1→3)-linked polysaccharide, is composed of ribose, arabinose, xylose, mannose, glucose, and galactose, with corresponding molar contents of 1.49, 1.17, 0.62, 10.34, 86.39, and 1.31 µM, respectively.Citation1 PHY, a naturally occurring fungal polysaccharide with a molecular weight ranging from 64.6 to 4,360 kDa,Citation2 has been found to have many pharmaceutical applications, owing to its diuretic, complement-activating, immunoactive, and anti-inflammatory properties, and has proved to be a candidate for use in drug delivery systems.Citation3–Citation5 Poly(d,l-lactic acid) (PLA) has been widely used in controlled drug delivery as a vaccine carrier,Citation6,Citation7 owing to its controlled biodegradability, distinct biocompatibility, and non-toxic properties.Citation8 Several techniques have been applied for the formulation of PLA-based micro- and nanoparticlesCitation9–Citation11 for use in sustained drug delivery and as carriers for vaccine antigens (proteins, peptides, and DNA).Citation12,Citation13
As the most potent antigen-presenting cells (APCs),Citation14 dendritic cells (DCs) can initiate the adaptive immune response and are promising tools for capturing and presenting antigens.Citation15,Citation16 When DCs are activated by stimuli at the site of inflammation, they capture antigens, transform them into smaller fragments, and then emerge them on the cell surfaces.Citation17 DCs can engulf and process antigens, bringing them into the local T cell clusters from distant sites. After transferring to the draining lymph nodes (DLNs) and submitting pieces of antigen to T-lymphocytes with high expression levels of adhesion and co-stimulatory molecules, major histocompatibility complex (MHC) class I and II proteins, and secretion of inflammatory cytokines,Citation18 DCs activate T cells, thereby initiating and regulating Th1 and Th2 immune responses.Citation19,Citation20 The phagocytosis of PLA micro- and nanoparticles by murine bone marrow-derived cells has previously been demonstrated in vitro.Citation21 Similarly, there is evidence that particles can accelerate antigen uptake by APCs and promote antigen presentation to T cells, thereby eliciting potent cellular and humoral immune responses.Citation22,Citation23
Vaccination is a highly efficient way of preventing viral and other infectious diseases and remains one of the most effective health care measures introduced into medical practice.Citation24 Numerous materials have been considered as vaccine adjuvants in the development of modern vaccines,Citation25 with important roles in drug delivery systems.Citation26 The vaccine adjuvant activities of several kinds of nanomaterials, including carbon nanotubes, gold nanoparticles, and biodegradable polymeric particles, have been investigated and found to be key ingredients for improving and regulating antigen-specific humoral and cellular immune responses.Citation23,Citation27–Citation29 There was evidence that polylactide-co-glycolide (PLGA) nanoparticles were able to transform immune responses stimulated by the Th2-biased antigen into Th1-type immune responses.Citation30 It was also proved that nanomaterials regulate antigen delivery and cross-presentation, decrease adjuvant dose, and reduce clinical side effects.Citation31
In our previous research, optimal PHY-encapsulated PLA (PHYP) nanospheres were synthesized, their function of controlling drug release was demonstrated, and the immunological enhancement of splenic lymphocytes by PHYP was investigated in vitro.Citation32 It is now hypothesized that encapsulating antigens into PLA nanospheres would augment their persistence in vivo, to reach a sustained-release state, and thereby permit the generation of more potent and prolonged antigen-specific immune responses, which may be attributed to the antigen-presenting effect of DCs. Our present study aims to incorporate PHY and ovalbumin (OVA, a model antigen) into PLA nanospheres, to explore their ingestion and excitation effects on bone marrow DCs (BMDCs) in vitro, and to examine antibody generation, cytokine secretion, T cell proliferation, and DC activation in mice after inoculation in vivo.
Materials and methods
Preparation of OVA-loaded PHYP (OVA-PHYP) nanospheres
OVA-PHYP nanospheres were synthesized using a double emulsion solvent evaporation method, as described in a previous publication.Citation33 Briefly, an internal aqueous phase (IAP), including 8 mg PHY (75%, No CY150310; Shanxi Ciyuan Biotechnology Co., Ltd., Xian, People’s Republic of China) and OVA (Sigma-Aldrich Co., St Louis, MO, USA) dissolved in 0.4 mL deionized water, was emulsified into the organic phase (OP) (30 mg mL−1 PLA in 4 mL acetone solution) (PLA, molecular weight =50 kDa; Shandong Daigang Biotechnology Co., Ltd., Jinan, People’s Republic of China) by magnetic stirring for 0.5 h. The obtained primary emulsion (W/O) was added dropwise into the external aqueous phase (EAP) including 0.33% (w/v) of F68 (molecular weight =8,350±1,000; Shanghai Yuanye Biotechnology Co., Ltd., Shanghai, People’s Republic of China) in 44 mL deionized water by magnetic stirring to produce the double emulsion. The resulting coarse double emulsion was magnetically stirred for 1.5 h to homogenize the nanospheres for a narrow size distribution. The strong volatile organic solvent (acetone) in the resulting formulation was removed by rotary evaporation under reduced pressure to form a colloidal solution (100 rpm, 55°C, 30 min). The obtained PHYP nanospheres encapsulating OVA were collected by centrifugation at 3,500 rpm for 8 min, and the supernatant was gathered. The formulation was freeze-dried to obtain a free-flowing powder for protein encapsulation efficiency assay and stored at 4°C prior to use. To prepare controlled nanospheres, 0.4 mL of deionized water was used as the internal water phase, without drug, for the in vivo study, and without OVA or drug, for the in vitro study.
Characterization of nanospheres
The mean size, size distribution, and zeta potential of the freshly prepared OVA-loaded or empty nanosphere formulations were measured by dynamic light scattering (DLS) using an analyzer (Hydro2000Mu, MAL1009117; Malvern Instruments, Malvern, UK). Before determination, freshly manufactured nanospheres were suitably diluted to 1 mL in phosphate-buffered saline (PBS). The data were acquired by taking the average of three measurements.
To quantify the loaded OVA, 1 mL of OVA-PHYP formulation was dissolved in 1 mL of 0.1 M NaOH containing 0.1% sodium dodecyl sulfate (SDS), cultivated for 12 h at room temperature, and determined using a Micro-BCA protein assay kit (Pierce Biotechnology, Rockford, IL, USA) according to the manufacturer’s protocol.Citation34 The standard curve was obtained from OVA dissolved in 0.1 M NaOH with 0.1% SDS, with blank PLA nanospheres as a control.
In vitro study
Isolation and stimulation of mouse BMDCs
BMDCs were prepared according to the method documented previously.Citation35 Bone marrow cells acquired from the femurs and tibias of BALB/c mice (4–6 weeks old) were wiped off erythrocytes with lysis buffer solution and washed twice in PBS. Approximately 2.0×10⁶ cells/mL were seeded in round-bottomed six-well plates containing Roswell Park Memorial Institute-1640 (Thermo Fisher Scientific, Waltham, MA, USA) medium enriched with 10% fetal bovine serum (FBS; Thermo Fisher Scientific), 100 IU/mL penicillin, 100 µg/mL streptomycin, 15 ng/mL recombinant interleukin-4 (rmIL-4), and 15 ng/mL recombinant murine granulocyte-macrophage colony-stimulating factor (GM-CSF; both from Peprotech, Rocky Hill, NJ, USA), 2 mL per well. Cells were cultivated at 37°C in a 5% CO2 humidified atmosphere for 7 days to acquire immature DCs. After incubation for 48 h, non-adherent cells in the culture were removed and replaced with an equal amount of fresh medium. The half dose of nutrient medium was changed every other day over the next 6 days.
On day 7, the immature DCs were stimulated with free PHY, empty or loaded PLA, and lipopolysaccharide (LPS; Sigma-Aldrich Co.) for 48 h at 31.25 and 10 µg mL−1, respectively. The stimulants were prelabeled with fluorescein isothiocyanate (FITC)-OVA (BD Biosciences, San Jose, CA, USA) at 4°C overnight in dark conditions, and sterile cover slips were positioned into wells prior to the addition of bone marrow cells for antigen presentation assessment. BMDCs treated with LPS were used as positive controls and as a reference for matured BMDCs, while untreated BMDCs for the immature state were used as the negative control. All experiments were performed in triplicate.
Maturation of BMDCs
At the end of the stimulation, the maturation status of BMDCs was assessed. In brief, the co-cultured and undisposed BMDCs were gathered, rinsed twice with PBS, and three fold-labeled for half an hour at 4°C, protected from light, with APC-anti-mouse CD11c, FITC-anti-mouse CD80, and PE-anti-mouse CD86 monoclonal antibodies (BD Biosciences) as DC maturation markers. The corresponding isotype control antibodies were used as controls. After thorough rinsing by washing twice with PBS, expression levels of associated surface molecules in labeled BMDCs were determined by flow cytometry in a FACS Calibur cytometer (BD Biosciences). The data were analyzed using FlowJo software (version 7.6).
Impact on ability of antigen uptake assessment of PHYP on BMDCs
The antigen-presenting abilities of BMDCs excited by PHYP, PHY, and PLA at safe concentrations were evaluated by confocal laser scanning microscopy (CLSM). Briefly, when cultivated with drugs and LPS for 48 h, pulsed and unpulsed BMDCs were washed with nutrient solution and fixed in 0.5 mL 4% paraformaldehyde on cover slips for 10 min at 4°C in the dark. After washing twice with sterile PBS, the cell nuclei were labeled with 50 µL 4′,6-diamidino-2-phenylindole (DAPI; Thermo Fisher Scientific) at 37°C for 5 min and again rinsed three times with PBS (pH 7.4). The handled cover slips were transferred to glass slides, which had been predripped with a small amount of 50% glycerin, and were then evaluated using CLSM (LSM 710; Zeiss, Oberkochen, Germany). The images were analysed with ZEN lite 2014 software.
Cellular uptake studies of PHYP
In order to testify whether PHYP was ingested by BMDCs, at day 9, the cells were collected, centrifuged down, resuspended in 0.5 mL, 0.1 M, pH 7.2 PBS, and fixed overnight in 2.5% glutaraldehyde. The cell pellets, dehydrated through a graded acetone series, were embedded in Epon resin to polymerize at 60°C for 24 h. Ultrathin sections prepared with an ultramicrotome (EM UC6; Leica Microsystems, Wetzlar, Germany) were gathered on copper grids, and then stained in distilled water with 1% uranyl acetate and 1% lead citrate. The ultrathin sections were observed with a transmission electron microscope (TEM, CM 100; Philips Co., Ltd, Amsterdam, the Netherlands).
In vivo study
Animals and immunizations
Experiments were performed on 90 BALB/c mice (4–6 weeks old, 45 males/45 females, specific-pathogen-free), which were obtained from the Comparative Medicine Centre of Yangzhou University and housed for 1 week prior to vaccination. All mice were housed in the Nanjing Agricultural University Laboratory Animal Centre and maintained throughout the study in climate-controlled (temperature: 25°C±1°C; relative humidity: 50%±10%) and photoperiod-controlled (12 h light–dark cycles) housing with free access to water and food. Each mouse was treated according to the National Institutes of Health guidelines for the care and use of laboratory animals. All procedures and the use of animals in this experiment were carried out in accordance with the guidelines issued by Nanjing Agricultural University Animal Care and Use Committee, and this committee specifically approved this study. Ninety 4–6-week-old BALB/c mice were randomly divided into six groups with 15 mice in each group, and injected subcutaneously twice at a 2-week interval, with 50 µg OVA in a 200 µL formulation of each vaccine, as follows: OVA-PHYP (50 µg PHY encapsulated), physical mixture of OVA and PHY (OVA-PHY) (50 µg PHY solution physically blended with OVA), OVA-encapsulated PLA (OVA-PLA), OVA-Freund’s incomplete adjuvant (FIA) (positive control), free OVA (dissolved in deionized water), and normal saline (negative control). Mice were sacrificed on days 7, 14, 21, 28, and 35 after the second immunization. Popliteal lymph nodes were gathered 24 h after the first vaccination, and splenocytes were harvested at desired time points. Blood samples were collected through the retro-orbital plexus, and sera were separated and stored at −70°C for later analysis.
Determination of OVA-specific IgG and IgG subclasses
To quantitatively evaluate OVA-specific serum antibodies (OVA-specific IgG and IgG1, IgG2a subtypes), collected serum samples were diluted and determined by enzyme-linked immunosorbent assay (ELISA). In brief, 96-well plates were coated overnight with OVA (2 µg/well) at 4°C. Unbound antigen was removed by washing six times with PBST (0.01 M PBS containing 0.1% Tween 20, pH =7.4), and the plates were blocked by 2% (m/v) bovine serum albumin (BSA) in PBST at 37°C for 90 min. After washing twice with PBST, 100 µL per well of sera dilutions, which were serially diluted in buffer (PBST containing 0.1% [m/v] BSA), were added to the plates and incubated at 37°C for 1 h. After the washing steps, the plates were cultivated with 100 µL horseradish peroxidase (HRP)-conjugated anti-mouse IgG, IgG1, or IgG2a antibodies (Beyotime Institute of Biotechnology, Shanghai, People’s Republic of China) for 30 min at 37°C. Finally, HRP was quantified by adding tetramethylbenzidine (TMB) substrate solution and incubating for 20 min at room temperature. The enzymatic reaction was stopped with 2 M H2SO4. The OD450 values, which were taken as the results, were measured with a microplate reader. Samples were measured in duplicate.
Determination of cytokine levels by ELISA
One week after the second immunization, splenocytes were harvested from vaccinated mice and restimulated with OVA (50 µg/mL) for 72 h at 37°C with 5% CO2 in a humid atmosphere, and the supernatant was collected. To evaluate the cytokine levels, IL-4, IL-6, IL-2, and interferon (IFN)-γ levels in the collected supernatant (prestored at −70°C) were assayed with cytokine ELISA kits (Multisciences; IL-2, CY220260823; IL-4, CY220460753; IL-6, CY220660753; and IFN-γ, CY228060734) according to the manufacturer’s instructions.
Splenocyte proliferation assay
The splenocyte proliferation assay was performed according to previously described methodsCitation36 to demonstrate antigen-specific splenocyte activation. Fresh separated splenocytes (2.5×10⁶ cells/mL), which were stimulated with OVA (50 µg mL−1), LPS (as B-cell mitogen, 20 µg mL−1), or phytohemagglutinin (PHA, as T cell mitogen, 20 µg/mL) (both LPS and PHA were from Sigma-Aldrich Co.), were seeded in triplicate (100 µL/well) per group in 96-well plates and incubated in a humid atmosphere with 5% CO2 at 37°C. An aliquot of 30 µL MTT (Sigma-Aldrich Co.) solution (5 mg mL−1) was added to each well at 72 h, and the plates were cultured for an additional 4 h. The reaction was stopped by dissolving the formazan crystals in 100 µL per well of dimethyl sulfoxide (DMSO), and the plates were vibrated for 10 min until the crystals were fully dissolved. The absorbance was evaluated at a wavelength of 570 nm with a microliter ELISA reader (Multiskan FC; Thermo Fisher Scientific). The results were presented as the proliferation index (PI), expressed by the following formula: PI = OD (570 nm) for stimulated cultures/OD (570 nm) for non-stimulated cultures.
PHYP enhances the proliferation of cluster of differentiation (CD)4+ and CD8+ T cells
Lymphocytes (1×10⁶ cells/mL) were isolated from spleens 7 days after the second immunization, seeded in triplicate (1 mL/well) in 24-well plates, and cultivated with 50 µg mL−1 OVA at 37°C in a humid atmosphere for 72 h with 5% CO2. To assess the percentages of CD3+CD4+ and CD3+CD8+ T cells, the cells were then stained with anti-CD3e-FITC, anti-CD4-APC, and anti-CD8a-PE antibodies (Thermo Fisher Scientific). The stained cells were analyzed using fluorescence-activated cell sorting (FACS).
Expression of MHC and co-stimulatory molecules on DCs in DLNs
Sciatic and popliteal lymph nodes were cultured from vaccinated mice 24 h post-immunization with various vaccine formulations, as described in the Isolation and stimulation of mouse BMDCs section, and prepared as a single cell suspension. Cells were then washed, blocked, and stained with a mixture of anti-mouse antibodies (PerCP-Cyanine5.5-anti-CD11c, APC-anti-MHC II, FITC-anti-CD80, and PE-anti-CD86; Thermo Fisher Scientific). Expression of MHC II, CD80, and CD86 on CD11c+ DCs was determined by a FACS Calibur flow cytometer (BD Biosciences), and data were analyzed using FlowJo software (version 7.6).
Statistical analysis
All experiments were performed in triplicate, and data are expressed as mean ± standard error of the mean (SEM). Statistical differences between groups were determined by one-way analysis of variance (ANOVA) followed by Duncan’s multiple range test with IBM SPSS Statistics 20.0 for analysis. Differences regarded as statistically significant between the groups are presented as follows: *p<0.05, **p<0.01, and ***p<0.001 (compared with the PHY group); and #p<0.05, ##p<0.01, and ###p<0.001 (compared with the PLA group).
Results
Characterization of nanospheres
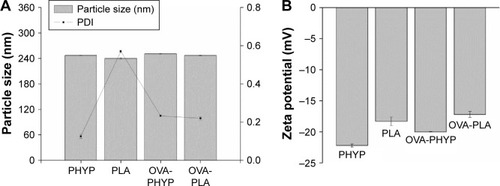
In order to manufacture different nanosphere-adjuvanted vaccine formulations, PLA nanospheres were prepared by a double emulsion solvent evaporation method as described previously. As indicated in , the particle size of the formulation encapsulated by both OVA and PHY was 250.8±1.368 nm, similar to that of formulations encapsulated by PHY only (246.9±0.351 nm). Based on the low polydispersity values, it was deduced that all these nanospheres followed a narrow size distribution. All the formulations were coated with negative charge, which became a little higher when OVA was present. The OVA contents of OVA-PHYP and OVA-PLA were 56.50±6.124 µg/mg and 74.00±2.887 µg/mg, respectively (data not shown).
Figure 1 Comparison of particle size, PDI (A) and zeta potential (B) of OVA-loaded nanospheres.
Abbreviations: OVA, ovalbumin; OVA-PHYP, OVA-loaded PHYP; OVA-PLA, OVA-encapsulated PLA; PHY, pachyman; PHYP, PHY-encapsulated PLA; PLA, poly(D,L-lactic acid); PDI, polymer dispersity index.
Maturation of BMDCs induced by PHYP nanospheres
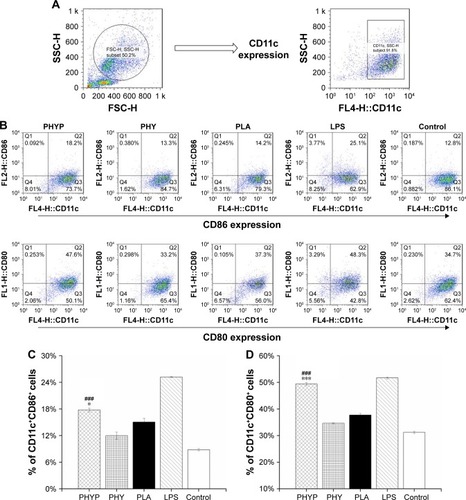
To assess the influence of free PHY, empty or loaded PLA, and LPS stimulation on the immune phenotypes of BMDCs, the expression of the cell surface markers CD11c, CD86, and CD80 were evaluated by immunofluorescence and flow cytometry 48 h post-stimulation. The DC population was selected; the percentages of CD11c+CD86+ cells and CD11c+CD80+ cells in different experimental groups are displayed in . As shown in , when PHYP was added, the expressions of these two co-stimulatory molecules presented were upregulated, and they showed a significantly higher percentage of cells expressing certain markers in comparison with PHY, blank PLA, and the control group, which indicated direct maturation signals. The effect of LPS represented the absolutely highest percentage in stimulating both CD86 and CD80 surface markers. In contrast, PHY or blank nanospheres alone induced little effect on cell surface molecule expression.
Figure 2 Surface expression of co-stimulatory molecules by BMDCs upon exposure to PHYP, empty PLA nanospheres and free PHY, determined by flow cytometry (Dot plot representation).
Notes: (A) Gated CD11c-positive BMDC population analyzed. (B) Phenotypes of BMDCs after 48 h of stimulation. (C and D) Percentage of CD11c+CD86+ and CD11c+CD80+ cells upon exposure to PHYP, empty PLA nanospheres, and free PHY; consider LPS as positive control of maturation, and untreated BMDCs as negative controls. Data are expressed as mean ± SEM (n=3). ###p<0.001 vs PHY, *p<0.05 and ***p<0.001 vs the PLA group.
Abbreviations: BMDCs, bone marrow dendritic cells; CD, cluster of differentiation; LPS, lipopolysaccharide; PHY, pachyman; PHYP, PHY-encapsulated PLA; PLA, poly(D,L-lactic acid); SEM, standard error of the mean.
Impact of PHYP on antigen uptake by BMDCs
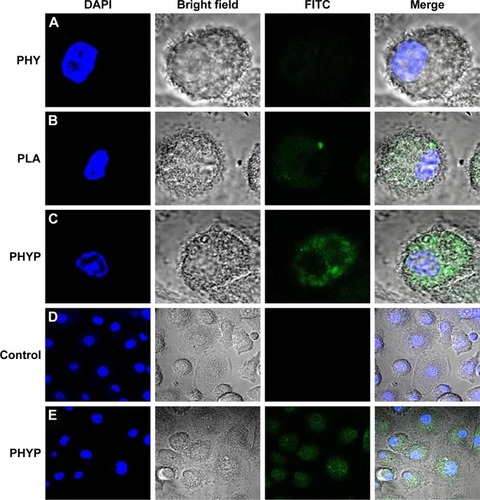
To investigate the role of PHYP nanospheres in mediating the ingestion of the OVA antigen by BMDCs, FITC-labeled OVA was pre-disposed with the drug, or with empty or loaded PLA nanospheres, overnight and analyzed by CLSM. A representative cell was selected randomly and a series of optical sections in dual filter mode were taken to obtain the required images. As illustrated in , antigens were observed by phagocytosed or absorbed by the BMDCs. The antigen cultured with PHY induced slight antigen ingestion by the BMDCs, while FITC-OVA cultivated with PHYP caused substantial antigen uptake. In comparison with cells without any treatment, BMDCs excited with PHYP formulation manifested a distinct antigen uptake (see regional images in ).
Figure 3 The antigen uptake assessment of FITC-OVA-labeled nanospheres by bone marrow dendritic cells.
Notes: Green: FITC-OVA; blue: cell nucleus stained with DAPI. Second panel is phase image, and fourth panel is merged image of all channels. Images of cells stimulated with PHY (A), blank PLA nanospheres (B), and PHYP nanospheres (C). Scale size: 5 µm. Regional images of cells as control group (D) and PHYP nanospheres (E). Scale size: 20 µm.
Abbreviations: DAPI, 4′,6-diamidino-2-phenylindole; FITC, fluorescein isothiocyanate; OVA, ovalbumin; PHY, pachyman; PHYP, PHY-encapsulated PLA; PLA, poly(D,L-lactic acid).
Uptake of PHYP by BMDCs
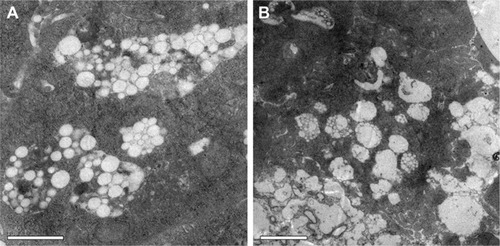
To determine whether PHYP nanospheres were taken up by BMDCs, PHYP nanospheres at a safe concentration were incubated for a couple of days with BMDCs; these were then disposed through a series of procedures to obtain ultrathin sections, which were observed using TEM. It was distinctly demonstrated that a large density of PHYP nanospheres were accumulated in endosomal compartments (), which were observed partially by membrane degradation without disrupting the nanosphere structures. These data show the strong potential of immature BMDCs to engulf nanospheres as antigens to reach maturation. The nanospheres not only motivated immature BMDCs but also were ingested by the cells previously cultivated with BMDCs.
Figure 4 Intracellular accumulation of nanospheres in BMDCs treated with PHYP under TEM. Scale bar (A and B) represents 1 and 2 µm, respectively.
Abbreviations: BMDCs, bone marrow dendritic cells; PHY, pachyman; PHYP, PHY-encapsulated PLA; TEM, transmission electron microscope.
Systemic antibody responses in vaccinated mice
In order to evaluate the influence of various nanosphere formulations on OVA-specific IgG antibody responses, serum was collected at various time points from mice subcutaneously immunized with OVA-PHYP, OVA-PHY, OVA-PLA, OVA-FIA, soluble OVA, and normal saline. Serum IgG, IgG1, and IgG2a levels were evaluated by ELISA, 7, 14, 21, 28, and 35 days after the boost immunization. As shown in , OVA-PHYP nanospheres induced significantly higher OVA-specific IgG antibody responses in comparison with other control groups on days 14, 21, 28, and 35, but not on day 7. As the positive control group, OVA-FIA generated more potent IgG responses than other formulations except for OVA-PHYP after immunization, while the negative control group presented the lowest OD450 value (below 0.2 for all measurements; data not shown).
Figure 5 OVA-specific IgG antibody responses in BALB/c mice subcutaneously inoculated with various vaccine formulations.
Notes: Ninety mice were randomly divided into six groups with 15 mice in each, were injected subcutaneously twice, at day 0 and day 14, with 50 µg OVA in 200 µL formulation of each vaccine as follows: OVA-PHYP (50 µg PHY encapsulated) and OVA-PHY (50 µg PHY solution physical blended with OVA), OVA-PLA, OVA-FIA, free OVA (OVA dissolved in deionized water), and normal saline. Mice were sacrificed on days 7, 14, 21, 28, and 35, and sera were collected. (A) OD (450 nm) values of IgG in the serum at the indicated time points after the second immunization. (B) IgG2a/IgG1 ratios in the serum of immunized mice (serum diluted 1:5). Data are expressed as mean ± SEM (n=3). #p<0.05, and ###p<0.001 vs OVA-PHY group, while *p<0.05, **p<0.01, and ***p<0.001 vs the OVA-PLA group.
Abbreviations: OVA, ovalbumin; OVA-PLA, OVA-encapsulated PLA; OVA-PHY, physical mixture of OVA and PHY; OVA-PHYP, OVA-loaded PHYP; PHY, pachyman; PHYP, PHY-encapsulated PLA; PLA, poly(D,L-lactic acid); SEM, standard error of the mean; IgG, immunoglobulin G.
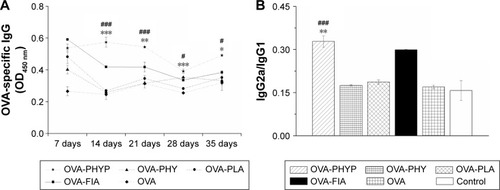
It was proved that the levels of IgG2a and IgG1 determined the types of T helper (Th) cell immune responses, and high levels of IgG2a are indicative of a Th1-biased immune response.Citation37 In comparison with other formulations, OVA-PHYP generated a significantly higher ratio of IgG2a/ IgG1 than OVA-PHY (p<0.001) and OVA-PLA (p<0.01) (), that both displayed no differences when compared to OVA and control groups.
Overall, PHY encapsulated in PLA nanospheres elicited long and lasting immune responses compared with PHY and empty PLA alone. Furthermore, OVA-PHYP presented a Th-1-biased immune response according to the ratio of IgG2a/IgG1, which was significantly larger than blank controls (OVA-PHY and OVA-PLA) and soluble antigen alone.
Determination of cytokine levels by ELISA
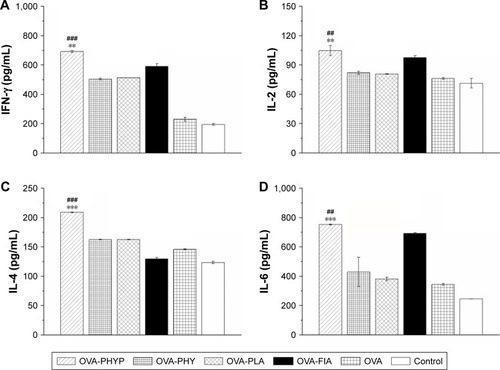
As PHY-encapsulated PLA nanosphere formulations generated a Th1-biased antibody response in serum collected from mice in comparison with other formulations, we next explored whether these vaccines also transformed the cytokine profiles to Th1 bias. Splenocytes were restimulated by OVA (50 µg mL−1) obtained from vaccinated mice, and Th1 (IFN-γ and IL-2) and Th2 (IL-4 and IL-6) cytokines in the supernatant were collected on day 7 after the second immunization and analyzed by ELISA. According to , OVA-PHYP generated considerably higher Th1 (IFN-γ and IL-2) cytokine levels than blank controls (IFN-γ level vs OVA-PHY, p<0.001; IFN-γ level vs OVA-PLA, p<0.01; IL-2 level vs OVA-PHY, p<0.01; IL-2 level vs OVA-PLA, p<0.01), which induced higher levels than OVA and control groups in IFN-γ instead of IL-2. Interestingly, the Th2 (IL-4 and IL-6) cytokine levels generated by OVA-PHYP were both significantly greater than those for OVA-PHY (for IL-4 level, p<0.001; for IL-6 level, p<0.01) and OVA-PLA (for IL-4 level, p<0.001; for IL-6 level, p<0.001); the same results were obtained with Th1 cytokine levels. On the whole, OVA-PHYP could induce higher secretion of both Th1 and Th2 cytokines compared with other formulations, indicating stronger immune responses.
Figure 6 Cytokine secretion levels in splenocytes.
Notes: Splenocytes were restimulated with OVA (50 µg mL−1) and harvested 7 days after the second immunization. IFN-γ (A), IL-2 (B), IL-4 (C), and IL-6 (D) levels in the supernatant were measured by ELISA. ##p<0.01 and ###p<0.001 vs OVA-PHY group, while **p<0.01 and ***p<0.001 vs the OVA-PLA group.
Abbreviations: ELISA, enzyme-linked immunosorbent assay; IFN, interferon; IL, interleukin; OVA, ovalbumin; OVA-PLA, OVA-encapsulated PLA; OVA-PHY, physical mixture of OVA and PHY; OVA-PHYP, OVA-loaded PHYP; PHY, pachyman; PHYP, PHY-encapsulated PLA; PLA, poly(D,L-lactic acid).
Lymphocyte proliferation assay
As shown in , upon restimulation by OVA, OVA-PHYP induced significantly higher proliferation effects on days 14 and 35 compared with blank controls (both vs OVA-PHY, p<0.01; and vs OVA-PLA, p<0.01). There was no obvious difference between blank controls and OVA-FIA, which was considered a positive control. When synergistically stimulated with PHA or LPS, splenocytes of the OVA-PHYP group proliferated more efficiently than other formulations, even in the initial period of vaccination, and no differences were found between the effects of the two stimuli ().
Figure 7 Results of lymphocyte proliferation assay.
Notes: Fresh separated splenocytes stimulated with OVA, LPS (as B-cell mitogen), or PHA (as T-cell mitogen) were seeded in triplicate (100 µL/well), each group in 96-well plates, and incubated in a humid atmosphere with 5% CO2 for 72 h at 37°C. Lymphocyte proliferation assays after stimulation (A) and on synergistic stimulation with LPS (B) or PHA (C) were measured by MTT assay. Data represent mean ± SEM of triplicate experiments. #p<0.05, ##p<0.01 and ###p<0.001 vs OVA-PHY group, while *p<0.05, **p<0.01 and ***p<0.001 vs the OVA-PLA group.
Abbreviations: LPS, lipopolysaccharide; OVA, ovalbumin; OVA-PLA, OVA-encapsulated PLA; PHA, phytohemagglutinin; OVA-PHY, physical mixture of OVA and PHY; OVA-PHYP, OVA-loaded PHYP; PHY, pachyman; PHYP, PHY-encapsulated PLA; PLA, poly(D,L-lactic acid); SEM, standard error of the mean.
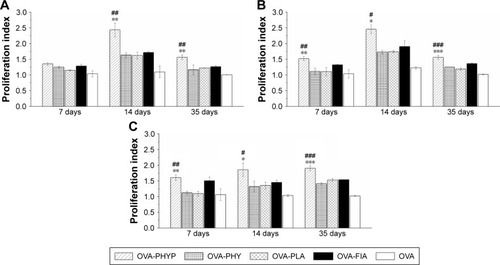
It was concluded that OVA-PHYP formulation elicited more potent immune responses than other groups. Meanwhile, the positive control group, OVA-FIA, could not elicit sustainable and stable immune responses, especially in the later immune period.
PHYP enhances the proliferations of CD4+ and CD8+ T cells
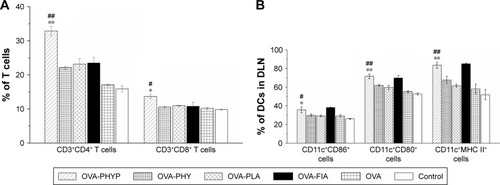
As the activation of antigen-specific CD4+ T cells and CD8+ cytotoxic T-lymphocytes (CTLs) is indicative of a cell-mediated immune response, the percentages of CD4+ and CD8+ T cells in the spleens of vaccinated mice given different vaccinations were evaluated. As can be clearly seen in , OVA-PHYP induced a higher percentage of CD3+CD4+ T cells compared with OVA-PHY or OVA-PLA (p<0.01). Equally, a significantly increased percentage of CD3+CD8+ T cells was found in mice vaccinated with OVA-PHYP in comparison with control groups (p<0.05). Furthermore, the positive control, OVA-FIA, presented lower T cell percentages than OVA-PHYP, which corresponded to the results of the splenocyte proliferation evaluation. These results indicated that mice stimulated with OVA-PHYP vaccination formulation instead of OVA-PHY, OVA-PLA alone, or other controlled formulations had stronger cellular immune responses.
Figure 8 The activation of CD3+CD4+ cells and CD3+CD8+ cells in splenic splenocytes (A); expression of MHC II and co-stimulatory molecules on DCs in draining lymph nodes (B).
Notes: (A) The percentage of CD3+CD4+ T cells and CD3+CD8+ T cells in splenic splenocytes cultivated from vaccinated mice and restimulated with OVA (50 µg mL−1). Data are expressed as the mean ± SEM. #p<0.05 and ##p<0.01 vs OVA-PHY group, while *p<0.05 and **p<0.01 vs the OVA-PLA group. (B) Expression of MHC II and co-stimulatory molecules on DCs in draining lymph nodes of mice immunized with different vaccine formulations 24 h after the first vaccination. The percentages of expression of CD11c+CD86+, CD11c+CD80+, and CD11c+MHC II+ of DCs in DLNs were determined by flow cytometry. Data are expressed as mean ± SEM (n=3). #p<0.05 and ##p<0.01 vs OVA-PHY group, while *p<0.05 and **p<0.01 vs the OVA-PLA group.
Abbreviations: CD, cluster of differentiation; DCs, dendritic cells; DLN, draining lymph node; FIA, Freund’s incomplete adjuvant; OVA, ovalbumin; OVA-PLA, OVA-encapsulated PLA; OVA-PHY, physical mixture of OVA and PHY; OVA-PHYP, OVA-loaded PHYP; PHY, pachyman; PHYP, PHY-encapsulated PLA; PLA, poly(D,L-lactic acid); SEM, standard error of the mean.
Expression of MHC and the co-stimulatory molecules on DCs in DLNs
As it was observed that OVA-PHYP nanospheres induced the strongest immune response in comparison with other control groups, we next wondered whether they influenced vaccine potency by means of activating DCs in the DLNs. To test this hypothesis, the expressions of MHC II and co-stimulatory molecules (CD86 and CD80) on DCs in DLNs were evaluated 24 h after the first immunization by flow cytometry. As shown in , the percentage of CD11c+CD86+ cells was significantly higher for the OVA-PHYP formulation compared with the OVA-PHY and OVA-PLA formulations (p<0.05). With respect to CD80 expression, OVA-PHYP generated higher levels (vs OVA-PHY, p<0.01; vs OVA-PLA, p<0.01). Additionally, DCs elicited significantly higher levels of MHC II expression 24 h after the first vaccination with the OVA-PHYP (vs OVA-PHY, p<0.01; vs OVA-PLA, p<0.01) nanosphere formulation. Overall, the OVA-PHYP vaccine formulation could elicit valid expression of MHC II and co-stimulatory molecules on DCs in the DLNs, in contrast to a physical mixture or empty nanosphere formulations.
Discussion
Controlled delivery systems, composed of biodegradable micro- and/or nanospheres, can serve as promising adjuvant– vaccine carriers, owing to their ability to deliver antigens to the intended locations at predetermined rates and durations to generate optimal immune responses.Citation38 Among these particulate compounds, PLA-based nanospheres have been proved to be easily taken up by APCs (such as DCs) and to modulate immunity to elicit immune responses in vivo. They are able to induce both humoral and cellular responses, in terms of presenting antigens to both MHC class I and class II pathways. Not only their chemical nature and inner backbone structures but also a variety of physical properties including surface charge, particle size, and antigen load enable these polymeric particles to elicit immune responses and affect differential uptake by DCs, which also had an impact on the type of immune response.Citation39 In the current study, PHYP nanospheres (encapsulating OVA as a model antigen for in vivo study) were formulated to explore their effects on the expression of surface markers, enhancement of antigen presentation, and ingestion of PHYP by BMDCs in vitro. Antigen-specific antibody generation, cytokine secretion, T cell proliferation, and DC activation from mice after inoculation were also investigated in vivo.
Using the prepared PHYP and OVA-PLA nanospheres, the physicochemical characteristics that affect the physical stability, structure, and content of the encapsulated drug or protein were determined. These were confirmed by the results of DLS and zeta potential assays, which indicated the narrow size distribution and polarity of zeta potential of all the formulations (). PHYP and OVA-PHYP, with particle sizes of 246.9±0.351 nm and 250.8±1.368 nm, respectively, were beneficial for the passive targeting of APCs, owing to their elevated permeability and retention effects. Furthermore, the zeta potentials, of around −20 mV, were high enough for nanospheres to repel each other, thus averting particle aggregation and allowing long-term stability.
According to previous research, the interaction between the T cell receptor (TCR) and a specific antigen enables T cell activation; such antigens including peptides can be processed by APCs. CD11c, a key marker for DCs involved in antigen capture and presentation directly to T-cells, can confer adaptive immunity.Citation40 It was suggested that the interaction between T cells and APCs may result in T cell allergies, owing to the absence of co-stimulatory molecules on the APCs. In this study, our results showed that BMDCs stimulated by PLA nanospheres incorporating PHY in their core induced significantly elevated expression of CD86 and CD80 membrane molecules in comparison with the empty nanospheres or the drug alone (), which was evidently associated with the maturation of BMDCs. The high levels of co-stimulatory molecules (CD86 and CD80) observed suggested the possible involvement of these molecules in antigen uptake and presentation for the generation of specific immune responses. As the bridge between innate and adaptive T cell-dependent immunity,Citation41 DC maturation was affected by the existence of co-cultured particulates, which enhanced antigen uptake. Electron microscopy images revealed that PHYP nanospheres were internalized by BMDCs (), where they were surrounded by an endosomal membrane. Consequently, as illustrated by , blank PLA nanospheres or PHY alone did not generate distinct antigen uptake, while a cluster of model antigens was observed inside or absorbed on the cells treated with PHYP, by means of particle engulfment. Consequently, it was determined that activated DCs augment antigen processing and presentation to CD4+ and CD8+ T cells with the help of co-stimulatory molecules.
Vaccinations delivered by microparticles have been highly successful for preventing many infectious diseases. As mentioned before, polymeric micro/nanoparticles with core-embedded antigens represent a promising method for in vivo delivery of subunit vaccines, as they offer a viable alternative to current delivery systems containing viral vectors.Citation42 Indeed, these particles, including PLA and PLGA, can function not only as a delivery system but also as an adju-vant.Citation43 As they can simultaneously enhance both humoral and cellular immune responses, the various adjuvant formulations were first formulated, encapsulating or simply blended with OVA, and evaluated regarding their potential to generate the antibody-specific response for humoral responses following primary and boost immunization in mice through the subcutaneous administration route. OVA-specific IgG antibody levels, detected from serum at 4 consecutive weeks after boost immunization, were observed to be distinctly potent compared with all the other formulations at days 7, 14, 21, 28, and 35 (). The levels of IgG2a and IgG1 of each formulation were also assessed to investigate the types of Th cell immune responses. Generally, Th1 cells secrete IgG2a antibody, and Th2 cells secrete IgG1 antibody, and the ratio of IgG2a/IgG1 directs a Th1-biased immune response.Citation44 In our study, OVA-PHYP elicited the highest IgG2a/IgG1 ratio, as illustrated in , which indicated an intensive bias toward Th1 compared with the empty PLA nanospheres or drug alone. Furthermore, the cellular immune responses by splenocytes and DCs from mice being inoculated were also investigated. The potential for nanospheres to induce a (pro-) inflammatory cellular response was investigated by assessing cytokine secretion. Th1 cytokines in mice, for instance, IL-2 and IFN-γ, not only evoke proliferation of activated B cells and stimulate CTL responses through surface receptors but also directly cause IgG2a secretion. On the other hand, IL-4 and IL-6 are considered to be primarily Th2 cytokines; IL-4 can promote B cell proliferation/viability, IL-6 enables activation of T and B lymphocytes and development of APCs,Citation45,Citation46 and both predominantly regulate IgG1 production. As shown in , both Th1 (IFN-γ and IL-2) and Th2 (IL-4 and IL-6) cytokines exhibited higher secretion in comparison with other control formulations, which, in combination with the results from IgG2a/IgG1 ratio, led to the conclusion that PLA nanospheres encapsulating both PHY and OVA induced a mixed Th1/Th2 immune response with a greater bias toward Th1 compared with the PLA nanospheres or PHY alone. The proliferation of T and B lymphocytes is a direct indicator of cellular immunity, which can be used to indirectly explore the immune states of the organism. Splenocyte proliferation was explored by MTT assessment, and the splenocyte PI of OVA-PHYP was found to be highest on days 7, 14, and 35 for all formulations synergistically stimulated with PHA or LPS (). These results demonstrated that OVA-PHYP enabled splenocyte proliferation via antigen specificity. As key indicators of cellular immune response, CD4+ T cells regulate immune responses by secreting cytokines necessary for fighting infections and by providing help to other immune cells through cell-to-cell interactions.Citation47,Citation48 In addition, CD8+ T cells perform a cytotoxic function via the quality of antigen presentation.Citation49 To evaluate whether the OVA-PHYP was able to elicit the activation of antigen-specific CD3+ CD4+ T cells and CD3+ CD8+ T cells, the potential adjuvant effects of the various PLA formulations were compared. As illustrated in , the percentages of CD3+ CD4+ T cells and CD3+ CD8+ T cells were both greater in mice inoculated with OVA-PHYP than in those inoculated with OVA-PLA or OVA-PHY alone, suggesting the possibility that the T cells may regulate B cell and CTL activity by proliferation after immunization with PHYP. Based on the results for different antigen formulations, it appears that the improved immunogenicity of a particulate is mostly due to its interactions with APCs, along with continuous release of antigen. In addition, various vaccine formulations may influence antigen movement to secondary lymphatic organs, including the lymph nodes or spleen, to regulate adaptive immune responses by effectively activating DCs. Therefore, the effective expressions of MHC-II and co-stimulatory molecules (CD80+ and CD86+) on DCs in the DLN were further measured 24 h after the first inoculation. Immunization experiments suggested that entrapment of both OVA and PHY in polymeric particles induced distinct DC activation and increased maturation level in comparison with OVA-PLA and OVA-PHY formulations (). These results provide direct evidence that using PLA as an adjuvant can stimulate both potent humoral and cellular immune responses against antigens, suggesting that PHYP should be considered as a forceful adjuvant for polymer particle-based vaccines.
Based on the results described earlier, the following model was proposed to describe the underlying mechanism for the actions observed in both the in vitro and in vivo studies. On the one hand, in the in vitro study, BMDCs were co-cultured with PHYP and the model antigen under defined conditions. It could be clearly seen that the cell engulfed both the nanospheres and the antigen ( and ), consequently upregulating the expression of the co-stimulatory molecules (). On the other hand, in the in vivo study, mice were subcutaneously inoculated with OVA-PHYP and control formulations at predetermined times. Upon injection, the adjuvant–vaccine caused the recruitment of DCs, which took up antigen-encapsulated nanospheres and promoted antigen transport into DLNs by upregulating MHC and co-stimulatory molecules (CD86 and CD80) (). Since most vaccine adjuvants exert their functions on T cells indirectly via effects on APCs, the activated DCs then initiate and amplify both the cellular and humoral immune responses (–). Overall, our results demonstrated that PHYP and/or OVA-PLA nanospheres not only enable the maturation of BMDCs but also elicit a potent immune response, making them promising potential adjuvants.
Conclusion
In conclusion, this study developed PHYP nanospheres as stimuli to evaluate the maturation of BMDCs in vitro and formulated OVA-PHYP nanospheres as a new vaccine adjuvant to enhance humoral and cellular immune responses in vivo. It was found that PHYP could efficiently promote BMDCs to reach maturation and enhance antigen uptake of BMDCs by engulfing the nanospheres. In vivo experiments revealed that mice immunized with OVA-PHYP elicited more potent antigen-specific IgG antibodies, higher cytokine secretion level, more splenocyte proliferation, and enhanced CD4+ and CD8+ T cell proliferations than blank PLA nanospheres or PHY alone. The enhanced immune responses of OVA-PHYP might be accounted for by the promotion of antigen transfer to DLNs, with successful DC activation in DLNs. The current work demonstrated that PHYP and/or OVA-encapsulated PLA nanospheres promoted the maturation of BMDCs and significantly improved humoral and cellular immune responses, suggesting PHYP to be a good adjuvant candidate for rational vaccine design.
Acknowledgments
This project was supported by the National Natural Science Foundation of China (grant numbers 31672596 and 31372472), Special Fund for Agro-scientific Research in the Public Interest (grant numbers 201303046 and 201403051), and the Project Funded by the Priority Academic Program Development of Jiangsu Higher Education Institutions (PAPD). We are grateful to all other staff in the Institute of Traditional Chinese Veterinary Medicine of Nanjing Agricultural University for their assistance in the experiments.
Disclosure
The authors report no conflicts of interest in this work.
References
- KeRDLinSFChenYJiCRShuQGAnalysis of chemical composition of polysaccharides from Poria cocos wolf and its anti-tumor activity by NMR spectroscopyCarbohydr Polym2010803134
- WangYFZhangLNLiYQHouXHZengFBCorrelation of structure to antitumor activities of five derivatives of a β-glucan from Poria cocos sclerotiumCarbohydr Res2004339152567257415476718
- NaruiTTakahashiKKobayashiMShibataSA polysaccharide produced by laboratory cultivation of Poria cocos wolfCarbohydr Res19808711611637438140
- SchinellaGRTournierHAPrietoJMMordujovich de BuschiazzoPRiosJLAntioxidant activity of anti-inflammatory plant extractsLife Sci20027091023103311860151
- WangSXWenYYHuCXImmunoactivities of the polysaccharides from Morus-alba, Chlamydomonas-mexicana and Poria-cocosPhytother Res19959448451
- ChoHGaoJMKwonGSPEG-b-PLA micelles and PLGA-b-PEG-b-PLGA sol–gels for drug deliveryJ Control Release201624019120126699425
- HouZQLiLZhanCMPreparation and in vitro evaluation of an ultrasound-triggered drug delivery system: 10-hydroxycamptothecin loaded PLA microbubblesUltrasonics201252783684122542992
- LeeBKYunYParkKPLA micro- and nano-particlesAdv Drug Deliv Rev201610717619127262925
- MainardesRMGremiaoMPBrunettiILda FonsecaLMKhalilNMZidovudine-loaded PLA and PLA-PEG blend nanoparticles: influence of polymer type on phagocytic uptake by polymorphonuclear cellsJ Pharm Sci200998125726718425813
- GaoHWangYNFanYGMaJBSynthesis of a biodegradable tadpole-shaped polymer via the coupling reaction of polylactide onto mono(6-(2-aminoethyl)amino-6-deoxy)-beta-cyclodextrin and its properties as the new carrier of protein delivery systemJ Control Release2005107115817316095747
- LeoEBrinaBForniFVandelliMAIn vitro evaluation of PLA nanoparticles containing a lipophilic drug in water-soluble or insoluble formInt J Pharm2004278113314115158956
- TylerBGullottiDMangravitiAUtsukiTBremHPolylactic acid (PLA) controlled delivery carriers for biomedical applicationsAdv Drug Deliv Rev201610716317527426411
- LassaleWFerreiraMLPLA nano- and microparticles for drug delivery: an overview of the methods of preparationMacromol Biosci20077676778317541922
- CampisanoSKeonSMGazzanigaSAnti-melanoma vaccinal capacity of CD11c-positive and -negative cell populations present in GM-CSF cultures derived from murine bone marrow precursorsVaccine201331235436123146677
- CherayilBJHow not to get bugged by bugs: mechanisms of cellular tolerance to microorganismsCurr Opin Gastroenterol200319657257715703607
- LeonePTacchioMDBerardiSDendritic cell maturation in HCV infection: altered regulation of MHC class I antigen processing-presenting machineryJ Hepatol201461224225124732300
- WangYCaoYMengYMYouZYLiuXWLiuZHThe novel role of thymopentin in induction of maturation of bone marrow dendritic cells (BMDCs)Int Immunopharmacol201421225526024861251
- VilladangosJACardosoMSteptoeRJMHC class II expression is regulated in dendritic cells independently of invariant chain degradationImmunity200114673974911420044
- FytianosKRodriguez-LorenzoLCliftMJDUptake efficiency of surface modified gold nanoparticles does not correlate with functional changes and cytokine secretion in human dendritic cells in vitroNanomedicine201511363364425555350
- BakhruPSirisaengtaksinNSoudaniEMukherjeeSKhanAJagannathCBCG vaccine mediated reduction in the MHC-II expression of macrophages and dendritic cells is reversed by activation of toll-like receptors 7 and 9Cell Immunol20142871536124384074
- ElamanchiliPDiwanMCaoMSamuelJCharacterization of poly(d,l-lactic-co-glycolic acid) based nanoparticulate system for enhanced delivery of antigens to dendritic cellsVaccine200422192406241215193402
- ZhangZPTongchusakSMizukamiYInduction of anti-tumor cytotoxic T cell responses through PLGA-nanoparticle mediated antigen deliveryBiomaterials201132143666367821345488
- MoonJJSuhHBershteynAInterbilayer-crosslinked multilamellar vesicles as synthetic vaccines for potent humoral and cellular immune responsesNat Mater201110324325121336265
- RubinLGLevinMJLjungmanP2013 IDSA clinical practice guideline for vaccination of the immunocompromised hostClin Infect Dis201458330931824421306
- HuangYELiuZGBoRNThe enhanced immune response of PCV-2 vaccine using Rehmannia glutinosa polysaccharide liposome as an adjuvantInt J Biol Macromol20168692993626851361
- UlmerJBValleyURappuoliRVaccine manufacturing: challenges and solutionsNat Biotech2006241113771383
- XuLGLiuYChenZYMorphologically virus-like fullerenol nanoparticles act as the dual-functional nanoadjuvant for HIV-1 vaccineAdv Mater201325415928593623963730
- ReddySTvan der VliesAJSimeoniEExploiting lymphatic transport and complement activation in nanoparticle vaccinesNat Biotechnol200725101159116417873867
- KasturiSPSkountzouIAlbrechtRAProgramming the magnitude and persistence of antibody responses with innate immunityNature2011470733554355021350488
- XuLGLiuYChenZYSurface-engineered gold nanorods: promising DNA vaccine adjuvant for HIV-1 treatmentNano Lett20121242003201222372996
- HubbellJAThomasSNSwartzMAMaterials engineering for immu-nomodulationNature2009462727244946019940915
- ZhengSSLuoLBoRNEvaluation of optimum conditions for pachyman encapsulated in poly(d,l-lactic acid) nanospheres by response surface methodology and results of a related in vitro studyInt J Nanomedicine2016114891490427729787
- AnishCGoswamiDGKanchanVMathewSPandaAKThe immunogenic characteristics associated with multivalent display of Vi polysaccharide antigen using biodegradable polymer particlesBiomaterials201233286843685722748669
- HeitASchmitzFHaasTBuschDHWagnerHAntigen co-encapsulated with adjuvants efficiently drive protective T cell immunityEur J Immunol20073782063207417628858
- FanYZChangHYuYThymopentin(TP5), an immunomodulatory peptide, suppresses proliferation and induces differentiation in HL-60 cellsBiochim Biophys Acta20061763101059106616952408
- YuanLWuLHChenJAWuQAHuSHPaclitaxel acts as an adjuvant to promote both Th1 and Th2 immune responses induced by ovalbumin in miceVaccine201028274402441020434553
- WoofJMImmunology. Tipping the scales toward more effective antibodiesScience200531057531442144316322444
- RautaPRNayakBParenteral immunization of PLA/PLGA nanoparticle encapsulating outer membrane protein (Omp) from Aeromonas hydrophila: evaluation of immunostimulatory action in Labeo rohita (rohu)Fish Shellfish Immunol201544128729425689492
- MundargiRCBabuVRRangaswamyVPatelPAminabhaviTMNano/micro technologies for delivering macromolecular therapeutics using poly(D, L-lactide-co-glycolide) and its derivativesJ Control Release2008125319320918083265
- KamphuisWKooijmanLSchettersSOrreMHolEMTranscriptional profiling of CD11c-positive microglia accumulating around amyloid plaques in a mouse model for Alzheimer’s diseaseBiochim Biophys Acta20161862101847186027425031
- SteinmanRMDecisions about dendritic cells: past, present, and futureAnnu Rev Immunol20123012222136168
- WhaleyKJHanesJShattockRConeRAFriendDRNovel approaches to vaginal delivery and safety of microbicides: biopharmaceuticals, nanoparticles, and vaccinesAntiviral Res201088suppl 1S55S6621109069
- AlineFBrandDPierreJDendritic cells loaded with HIV-1 p24 proteins adsorbed on surfactant-free anionic PLA nanoparticles induce enhanced cellular immune responses against HIV-1 after vaccinationVaccine200927385284529119450633
- GirvanRCKnightDAO’LoughlinCJHaymanCMHermansIFWebsterGAMIS416, a non-toxic microparticle adjuvant derived from Propionibacterium acnes comprising immunostimulatory muramyl dipeptide and bacterial DNA promotes cross-priming and Th1 immunityVaccine201129354555721034827
- KeswaniTSarkarSSenguptaABhattacharyyaARole of TGF-b and IL-6 in dendritic cells, Treg and Th17 mediated immune response during experimental cerebral malariaCytokine20168815416627632786
- GuiLZengQYXuZGIL-2, IL-4, IFN-γ or TNF-α enhances BAFF-stimulated cell viability and survival by activating Erk1/2 and S6K1 pathways in neoplastic B-lymphoid cellsCytokine201684374627235588
- O’GarraAGabrysovaLSpitsHQuantitative events determine the differentiation and function of helper T cellsNat Immunol201112428829421423225
- SwainSLMcKinstryKKStruttTMExpanding roles for CD4+ T cells in immunity to virusesNat Rev Immunol201212213614822266691
- GhoshSSarkarMGhoshTAbsence of CD4+ T cell help generates corrupt CD8+ effector T cells in sarcoma-bearing Swiss mice treated with NLGP vaccineImmunol Lett2016175313927178306