
Abstract
Background
Erythrocyte aggregation, a cardiovascular risk factor, is increased by high plasma fibrinogen levels. Here, the effect of different fibrinogen mutations on binding to its human erythrocyte receptor was assessed in order to identify the interaction sites.
Methods
Three fibrinogen variants were tested, specifically mutated in their putative integrin recognition sites on the Aα chain (mutants D97E, D574E and D97E/D574E) and compared with wild-type fibrinogen.
Results
Atomic force microscopy-based force spectroscopy measurements showed a significant decrease both on the fibrinogen–erythrocyte binding force and on its frequency for fibrinogen with the D97E mutation, indicating that the corresponding arginine–glycine–aspartate sequence (residues 95–97) is involved in this interaction, and supporting that the fibrinogen receptor on erythrocytes has a β3 subunit. Changes in the fibrin clot network structure obtained with the D97E mutant were observed by scanning electron microscopy.
Conclusion
These findings may lead to innovative perspectives on the development of new therapeutic approaches to overcome the risks of fibrinogen-driven erythrocyte hyperaggregation.
Plain language summary
Currently, cardiovascular diseases are the leading cause of mortality worldwide, accounting for about one third of all deaths. Erythrocyte aggregation, which may lead to the formation of thrombus on the bloodstream, is associated with an increase in the concentration of fibrinogen. However, it is not known which binding sites on the fibrinogen protein structure are involved on the interaction with its specific receptor on the erythrocyte membrane, contributing to erythrocyte aggregation.
Here, the effect of different fibrinogen mutations on binding to its human erythrocyte receptor was assessed in order to identify the interaction sites. Using atomic force microscopy, a nanotechnology technique, we were able to use mutated fibrinogen molecules as “bait” to “fish” its receptor on the surface of red blood cells. It was shown that the force required to break the binding between fibrinogen (the “bait”) and red blood cell (the “fish”), as well as the frequency of this binding, were lower for the proteins with the D97E mutation on the Aα chain, indicating that the corresponding arginine–glycine–aspartate sequence is involved in this interaction. Changes on fibrin clot network for the D97E mutant were also observed.
This study opens new perspectives on the development of novel therapeutic approaches to overcome the risks of fibrinogen-driven erythrocyte hyperaggregation.
Introduction
Fibrinogen has a crucial role in blood clotting.Citation1 The increase in fibrinogen plasma concentration leads to increased erythrocyte aggregation, one of the most important factors affecting blood flow and a significant cardiovascular risk factor.Citation2 It has been reported that there is specific binding between fibrinogen and a previously unknown erythrocyte receptor.Citation3
The fibrinogen molecule contains multiple binding motifs for different cellular receptors, acting as a molecular link between coagulation, inflammation and immunity. Particularly, fibrinogen binds to the αIIbβ3 integrin on activated platelets, leading to the platelet aggregation necessary for blood coagulation.Citation4,Citation5 Three potential binding sites for this integrin on the fibrinogen molecule have been identified, which are structural RGD (arginine–glycine–aspartate) sequences on each Aα chain (amino acid residues 572–574 and 95–97) and one dodecapeptide sequence on the γ chain, yielding a total of six potential binding sites per fibrinogen molecule (formed by two Aα, two Bβ and two γ chains).Citation6
Maeda et al proposed a model for a possible location of the erythrocyte-binding regions of fibrinogen in its Aα chain and tried to explain how it may affect erythrocyte aggregation and deformability.Citation7 The Aα 207–303 domain was found to include one of the possible erythrocyte-binding sites.Citation7 Using atomic force microscopy (AFM)-based force spectroscopy measurements, we demonstrated the existence of a single-molecule interaction between fibrinogen and a receptor on the erythrocyte membrane, with a lower but comparable affinity relative to platelet binding.Citation8 Fibrinogen binding to this receptor is inhibited by calcium depletion and by eptifibatide (an inhibitor considered to be specific for the receptor of fibrinogen on platelets, the glycoprotein αIIbβ3), but not as strongly as the platelet receptor. The results from a Glanzmann thrombasthenia (a rare hereditary bleeding disease caused by αIIbβ3 deficiency) patient showed an impaired fibrinogen–erythrocyte binding. Correlation with genetic sequencing data demonstrated that one of the units of the fibrinogen receptor on erythrocytes is a product of the expression of the β3 gene.Citation8,Citation9 To further assess the specificity of the fibrinogen–erythrocyte binding, as well as to complete its identification, we recently measured the inhibition of the fibrinogen–erythrocyte interaction using specific antibodies against integrins.Citation10 We also demonstrated that younger erythrocytes bind more fibrinogen than the older ones, being therefore the main cells responsible for the cardiovascular risk associated with an increase in the fibrinogen content in blood.Citation11 More recently, we showed that the interaction between fibrinogen and erythrocytes is modified in chronic heart failure (CHF) patients. The average force necessary to break the bond between fibrinogen and erythrocytes from CHF patients is higher than for erythrocytes from the control group.Citation10 Also using AFM, we showed that increasing fibrinogen levels lead to an increase in erythrocyte–erythrocyte adhesion in essential arterial hypertension patients.Citation12 Thus, AFM-based force spectroscopy is an approach with a high potential for applicability on biomedical research, inclusively on the study of cardiovascular diseases.Citation10–Citation14
Here, three stable fibrinogen variants were obtained according to previously established procedures,Citation4,Citation15 specifically altered in the described integrin binding sites on the Aα chain (D97E, D574E and the D97E/D574E double mutant). Using these variants, we conducted force spectroscopy measurements to determine the force necessary to break the bond between each fibrinogen variant (attached to the AFM tip) and erythrocytes. For the sake of comparison, identical measurements were conducted with wild-type (WT) fibrinogen. The analysis of the structure of the fibrin fibers in the blood clot was done using scanning electron microscopy (SEM). The results shed light on which integrin binding sites of the fibrinogen molecule are involved on the binding to the erythrocyte receptor. Knowledge of these aspects may lead to innovative perspectives on the development of new therapeutic drugs to overcome the risks of fibrinogen-driven erythrocyte hyperaggregation.
Methods
Fibrinogen mutants
The constructs for the fibrinogen variants were produced as previously described.Citation4,Citation15 We performed DNA sequence analysis, constructed the expression vectors and conducted site-directed mutagenesis according to established procedures. Briefly, baby hamster kidney cells, purchased from ATCC, were used to produce three stable fibrinogen mutants (Aα chain mutants D97E, D574E and the D97E/D574E double mutant) and the WT fibrinogen. Aα chain mutations have a single-nucleotide change, resulting in a codon for a different amino acid residue (aspartate changed to glutamate).
Erythrocyte isolation
Blood from adult healthy donors was collected into K3EDTA anticoagulant tubes with their previous written informed consent, following a protocol with the Portuguese Blood Institute (Lisbon), approved by the joint Ethics Committee of the Faculty of Medicine of the University of Lisbon and the Santa Maria Hospital. The experimental work was carried out in accordance with the Declaration of Helsinki of the World Medical Association. Erythrocytes were isolated from the blood samples according to established procedures.Citation8,Citation10,Citation11 Briefly, erythrocytes were separated from the other blood components by centrifugation at 200 g for 10 min, at 10°C. Plasma and buffy-coat were removed, and the erythrocytes were washed three times with buffered saline glucose citrate (1.6 mM KH2PO4, 8.6 mM Na2HPO4, 120 mM NaCl, 13.6 mM sodium citrate, 11.1 mM glucose, pH 7.3) supplemented with 1 mM CaCl2. Erythrocytes (0.1% hematocrit) were attached to a clean poly-L-lysine-treated glass slide after 30 min of deposition, at room temperature. Nonadherent cells were removed by sequential washes with buffer. Samples were loaded into the AFM and allowed to equilibrate in buffer for 15 min before force spectroscopy measurements.
AFM tip functionalization
A previously optimized procedure was used for the covalent attachment of fibrinogen to the AFM tips (functionalization) and for blood cells deposition on a solid substrate.Citation8,Citation10,Citation11 Briefly, cleaned AFM silicon nitride tips were silanized with 3-aminopropyl-triethoxysilane. Then, the probes were treated with a glutaraldehyde solution 2.5% (v/v) and finally immersed in a 0.5 mg/mL final concentration of fibrinogen (WT or mutant).
AFM-based force spectroscopy
Force spectroscopy measurements were performed on a NanoWizard II atomic force microscope (JPK Instruments, Berlin, Germany), mounted on an Axiovert 200 inverted optical microscope (Zeiss, Jena, Germany), using fibrinogen functionalized OMCL TR-400-type silicon nitride AFM tips (Olympus, Tokyo, Japan), as previously described.Citation8 The spring constant of the tips was calibrated by the thermal fluctuation method, resulting in values of 19±7 mN/m. The applied force was adjusted to 0.8 nN before retraction. Molecular recognition was searched by intermittently pressing the cantilevers on each erythrocyte adsorbed on the glass slide. Data collection for each force–distance cycle was performed at 2 µm/s, leading to a loading rate of 4 nN/s. Force curves were analyzed using the JPK image processing software v. 4.2.61. For any given experiment, ~5,000 force–distance curves were collected, analyzed and adjusted by polynomial fit.Citation16 Each experiment was performed at least three times, each time on different blood samples and with different functionalized tips.
SEM
SEM was used to investigate the differences on structure of clots formed from WT and D97E recombinant fibrinogen, especially in the presence of erythrocytes.
WT or D97E recombinant fibrinogen (0.5 mg/mL final concentration) and CaCl2 (final concentration 10 mM) were diluted in TBS (50 mM Tris–HCl, 100 mM NaCl, pH 7.5) and premixed. Human thrombin (Calbiochem, Nottingham, UK; final concentration 1 U/mL) was then added to initiate clotting. The mixtures were immediately transferred to Eppendorf lids, which were pierced with a syringe to assist solvent permeation. Clots were formed in a moist chamber, at room temperature, for 120 min. Clots were then washed with saline solution to remove excess salt, followed by fixation in 2% (v/v) glutaraldehyde (120 min). Clots were further washed extensively with sodium cacodylate buffer and dehydrated in a series of increasing acetone concentrations (30%–100%). Clots were critical-point dried with CO2, mounted onto stubs and sputter-coated with platinum, using a Cressington 208 HR (Watford, UK). Clots were also prepared with the appropriate amount of erythrocytes for a final hematocrit of 20%. They were observed and photographed digitally on at least three different areas per clot, using a scanning electron microscope Hitachi SU8230 FESEM (Tokyo, Japan), at five different magnifications (2,500× [data not shown], 5,000×, 10,000× [data not shown], 25,000× and 50,000×). At least, duplicates of each type of clot were performed. Fiber diameters were measured from 20 random fibers of each image in high magnification (25,000×), using ImageJ software (National Institutes of Health, Bethesda, MD, USA). Each cross-section measurement was performed over a single fibrin fiber and values of fiber diameter were extracted and averaged. All cross-section analysis were performed away from the branching points, in order to avoid biased results.
Statistical analysis
Unpaired samples Student’s t-test was used for statistical analysis. Differences were considered statistically significant for p<0.05. For AFM, each experiment was performed at least three times, each time with different blood samples and with different functionalized tips. At least 15 erythrocytes were tested on each blood sample. For SEM, at least duplicates of each type of clot were performed. Average fiber diameters were measured from 20 random fibers of each image, at high magnification (25,000×).
Results and discussion
AFM-based force spectroscopy studies, conducted at the single-molecule level, yielded force vs distance curves, acquired after the binding of mutant or WT fibrinogen to the receptor on erythrocytes (). The repeated measurements of the adhesion events, as the one shown in , allowed us to build up rupture force histograms for each fibrinogen variant and cell population studied.
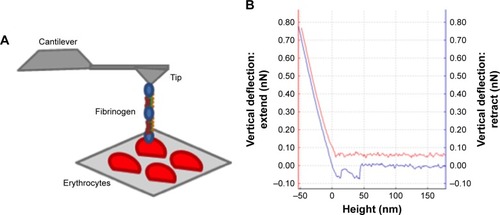
Figure 1 AFM-based force spectroscopy experiments and force–distance curve.
Notes: (A) Schematic representation of the erythrocytes deposited on a poly-L-lysine-coated glass slide and an AFM tip chemically functionalized with different fibrinogen variants. The vertical movement approaching the tip to the sample until contact enables the binding of fibrinogen to the erythrocyte. The subsequent retraction progresses until a certain force (and distance) is reached and the fibrinogen molecule detaches from the erythrocyte surface. The (un)binding frequency corresponds to the fraction of these approach–retraction cycles in which binding and subsequent unbinding occur. (B) Example of a force–distance curve. When approaching the tip to the sample (red line), the fibrinogen molecule may contact with cell receptor(s) and the binding between them can occur. By retracting the tip away from the sample (blue line), as the cantilever moves upward, the tip bends down to negative force values. In some surface distance point, the bond breaks and the cantilever jumps back to its neutral force position. At this point, the binding force necessary to break the bond, at the fibrinogen single-molecule level, can be measured.
Abbreviation: AFM, atomic force microscopy.
shows the rupture force histograms for the three different fibrinogen mutants and WT fibrinogen. It can be noticed that, in the presence of the D97E or D97E/D574E mutant, the histogram is shifted to lower binding forces, when compared with those obtained for WT fibrinogen. The opposite variation trend was obtained for the rupture force histogram of D574E, which is shifted to higher and stronger binding forces.
Figure 2 AFM force spectroscopy data for the binding between different fibrinogen variants and erythrocytes.
Notes: (A) Rupture force histograms of the interactions between the three different fibrinogen mutants (D97E, D574E and D97E/D574E: light gray) or WT fibrinogen (dark gray) and erythrocytes. On the rupture force histograms, each count represents a single-molecule binding between one fibrinogen molecule and one of its cell receptors. (B) Average (un)binding force of the interactions. Values are shown as mean ± standard error of mean (SEM). There were statistically significant variations (***p<0.0001) of the rupture forces between WT fibrinogen and the three fibrinogen variants with mutations on the Aα chain (D97E, D574E and D97E/D574E). (C) Variation of the fibrinogen–erythrocyte (un)binding frequency of the different fibrinogen variants relative to WT fibrinogen. (Un)binding frequency variations were calculated based on the ratio between the frequency of (un)binding events determined for the fibrinogen mutants and the frequency of (un)binding events obtained for WT fibrinogen.
Abbreviations: AFM, atomic force microscopy; WT, wild-type.
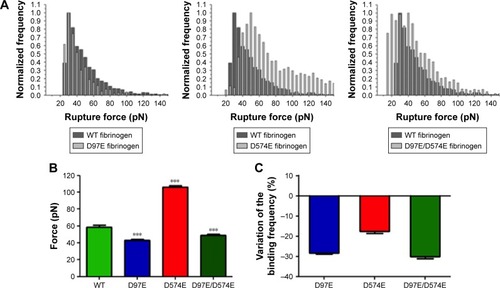
As it can be observed in , the average force necessary to break the bond between the D97E fibrinogen mutant (43.2±1.1 pN) or the D97E/D574E double mutant (49.2±0.8 pN) and erythrocytes is significantly lower than for WT fibrinogen (58.8±2.3 pN; p<0.0001 for both pairs). On the other hand, the average force necessary to break the bond between erythrocytes and the D574E mutant (105.9±1.7 pN) was significantly higher than for the WT (p<0.0001).
Decreases on the frequency (probability) of fibrinogen– erythrocyte binding and subsequent unbinding for the D97E (11.4%), D574E (13.1%) or D97E/D574E (11.1%) mutants in comparison with the WT fibrinogen (15.9%) were observed. The variation of the binding frequency of the different mutants relative to the WT is presented in .
Our results indicate that the RGD sequence corresponding to amino acid residues 95–97 of the fibrinogen Aα chain is involved in the binding to the erythrocyte membrane receptor. It has previously been reported that this RGD sequence is also involved in the binding to the β3 subunit of the αVβ3 receptor in endothelial cells.Citation17 These results further support our recent findings regarding the fibrinogen receptor on erythrocytes.Citation8,Citation10
The force necessary to break the bond between D574E fibrinogen and the erythrocyte membrane receptor was significantly higher than for WT fibrinogen, while the frequency of (un)binding events for this mutant was lower. These apparently opposite effects might be explained by the location of the specific binding site. As it is located close to the C-terminus of the α chain, the domain may eventually change conformation, leading to a stabilization of the complex formed upon binding to the erythrocyte receptor.
It is worth to mention that during the conversion of fibrinogen to fibrin, thrombin cleaves fibrinogen Aα chain at Arg-16 and the Bβ chain at Arg-14, releasing the fibrino-peptides A and B, respectively, and forming the so-called fibrin monomers.Citation18,Citation19 In the fibrinogen structure, the thrombin cleavage regions are distant from the mutated regions of fibrinogen variants produced here. Therefore, these mutations on the fibrinogen molecule do not interfere with the thrombin-induced conversion of fibrinogen to fibrin.
The existence of a specific binding mechanism in fibrinogen-induced erythrocyte hyperaggregation suggests the possibility of developing new treatments to decrease erythrocyte aggregation, therefore potentially decreasing cardiovascular risk. Fibrinogen is considered an independent risk factor on screening programs aimed at identifying individuals at high risk for cardiovascular diseases.Citation20 Our results show that, in addition to the assessment of the plasma fibrinogen concentration itself, it may also be important to identify mutations in the fibrinogen molecules that may change the binding to erythrocytes as a risk assessment strategy.
Moreover, in order to see if this fibrinogen variant induces changes on the structure of the fibrin blood clot, SEM analysis was also performed. From the micrographs obtained for the D97E and WT fibrin clots, we observed that there were no differences in fibrin clot structure (). Clots were also evaluated in the presence of 20% of erythrocytes (). The clots formed with WT fibrin have a more homogeneous structure than those formed with the D97E mutant. The D97E fibrin clots seem to have a more disorganized structure, with higher number of clusters that entrap erythrocytes. The clots appear to be more loosely packed, eventually leading to a higher risk of embolism. SEM images correlate well with the AFM data, where a decrease in both the binding force and the binding frequency were observed for this mutant, when compared with the WT fibrinogen.
Figure 3 Clots made from WT (A–C) or D97E (D–F) fibrinogen (0.5 mg/mL), imaged by scanning electron microscopy.
Notes: Magnifications: A, D, 5,000×; B, E, 25,000×; C, F, 50,000×.
Abbreviation: WT, wild-type.
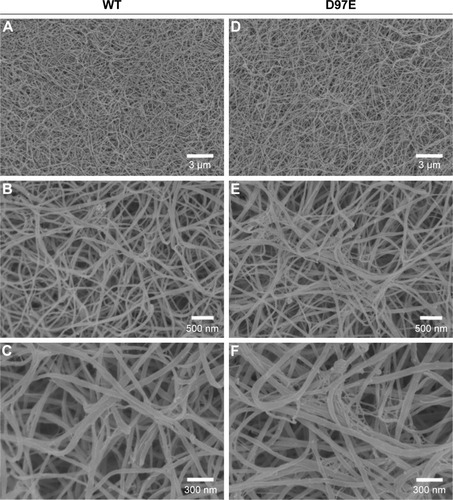
Figure 4 Fibrin clots formed in the presence of erythrocytes (20%), with WT (A–C) or D97E (D–F) fibrinogen, imaged by scanning electron microscopy.
Notes: Magnifications: A, D, 5,000×; B, E, 25,000×; C, F, 50,000×.
Abbreviation: WT, wild-type.
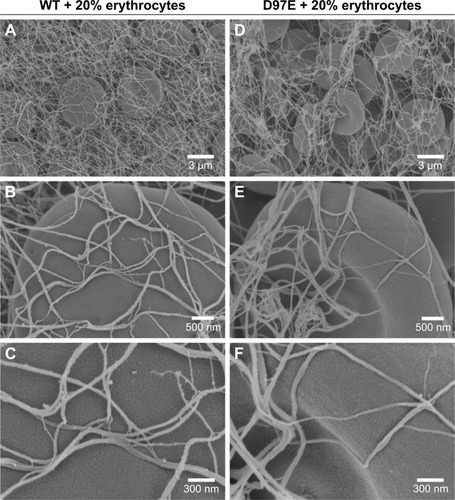
After analyzing the SEM micrographs shown in and , the diameters of the fibers were calculated (). No differences in fiber diameter between both fibrinogen variants were observed in the absence of erythrocytes, but statistically significant differences were found in the presence of these cells. The addition of 20% of erythrocytes to the D97E fibrin clot caused a decrease in fiber thickness (37.7±2.0 nm without erythrocytes vs 18.9±1.1 nm with erythrocytes; p<0.0001) and led to an extensive network rearrangement. A statistically significant variation of the fibers’ diameters was also observed between WT fibrin and D97E fibrin, both in the presence of erythrocytes (30.8±1.8 nm vs 18.9±1.1 nm, respectively; p<0.0001).
Figure 5 Diameter of fibers from WT or D97E fibrin clots, in the absence or presence of erythrocytes.
Notes: Data are presented as a box-and-whiskers plot. Fiber diameters were measured from 20 random fibers from each condition, imaged with 25,000× magnification (***p<0.0001).
Abbreviation: WT, wild-type.
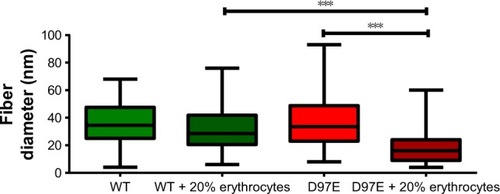
The difference in the D97E fibrin fibers’ diameter in the presence of erythrocytes is clear. This should be due to the mutant fibrin(ogen) interaction with erythrocytes, and not due to any difference in the polymerization of this fibrinogen variant itself, as the structure of the mutant fibrin without these cells seems the same as for the WT. Only when erythrocytes are present, the clot D97E fibrin structure becomes different.
The architecture of the clot may affect its stability, viscoelastic and mechanical properties, as well as its fibrinolytic characteristics.Citation21,Citation22 These characteristics may determine if a clot breaks down by fibrinolysis, or if it will lead to blood vessel occlusion or embolization.Citation23 Moreover, it has been previously reported that tightly packed and rigid clots, with thinner fibers and low porosity, are less susceptible to the action of thrombolytic agents.Citation24,Citation25
This work yields valuable new information on the identification of the fibrinogen domains that interact with its erythrocyte membrane receptor, contributing to the erythrocyte hyperaggregation in the bloodstream induced by increased levels of fibrinogen. Moreover, in this study, AFM-based force spectroscopy demonstrated its potential as an important nanotechnology approach for biomedical research application, important to measure the interaction forces between fibrinogen (or other plasma proteins) and human blood cells. Future studies using animal models would be important to test the binding between the fibrinogen variants and erythrocytes in vivo, in order to develop new therapeutic approaches to treat fibrinogen-driven erythrocyte hyperaggregation.
Acknowledgments
The authors thank Teresa Freitas (IMM, FM, UL) for excellent technical assistance. This work was supported by Fundação para a Ciência e a Tecnologia – Ministério da Ciência, Tecnologia e Ensino Superior (FCT-MCTES, Portugal) grants PTDC/QUI-BIQ/119509/2010 and PTDC/BBB-BMD/6307/2014, FEDER, through POR Lisboa 2020 - Pro-grama Operacional Regional de Lisboa, PORTUGAL 2020 and FCT-MCTES (LISBOA-01-0145-FEDER-007391), and by the Calouste Gulbenkian Foundation (Portugal). AFG also acknowledges FCT-MCTES PhD fellowship SFRH/ BD/84414/2012.
Disclosure
Oregon Health and Science University (OHSU) and Dr David Farrell have a significant interest in Gamma Therapeutics, a company that may have a commercial interest in the results of this research and technology. This potential individual and institutional conflict of interest has been reviewed and managed by OHSU. The authors report no other conflicts of interest in this work.
References
- KamathSLipGYFibrinogen: biochemistry, epidemiology and determinantsQJM2003961071172914500858
- LominadzeDDeanWLTyagiSCRobertsAMMechanisms of fibrinogen-induced microvascular dysfunction during cardiovascular diseaseActa Physiol (Oxf)20101981113
- SokolovaIAMuravyovAVKhokhlovaMDAn effect of glycoprotein IIb/IIIa inhibitors on the kinetics of red blood cells aggregationClin Hemorheol Microcirc201457329130224081313
- FarrellDHThiagarajanPBinding of recombinant fibrinogen mutants to plateletsJ Biol Chem199426912262318276798
- HolmbackKDantonMJSuhTTDaughertyCCDegenJLImpaired platelet aggregation and sustained bleeding in mice lacking the fibrinogen motif bound by integrin alpha IIb beta 3EMBO J19961521576057718918453
- SalsmannASchaffner-ReckingerEKiefferNRGD, the Rho’d to cell spreadingEur J Cell Biol2006853–424925416546569
- MaedaNSeikeMKumeSTakakuTShigaTFibrinogen-induced erythrocyte aggregation: erythrocyte-binding site in the fibrinogen moleculeBiochim Biophys Acta1987904181912959322
- CarvalhoFAConnellSMiltenberger-MiltenyiGAtomic force microscopy-based molecular recognition of a fibrinogen receptor on human erythrocytesACS Nano2010484609462020731444
- CarvalhoFAMartinsICSantosNCAtomic force microscopy and force spectroscopy on the assessment of protein folding and functionalityArch Biochem Biophys20135311–211612723228596
- GuedesAFCarvalhoFAMalhoILousadaSargentoLSantosNCAtomic force microscopy as a tool to evaluate the risk of cardiovascular diseases in patientsNat Nanotechnol201611868769227183056
- CarvalhoFAde OliveiraSFreitasTGonçalvesSSantosNCVariations on fibrinogen-erythrocyte interactions during cell agingPLoS One201163e1816721464904
- GuedesAFCarvalhoFAMoreiraCNogueiraJBSantosNCEssential arterial hypertension patients present higher cell adhesion forces, contributing to fibrinogen-dependent cardiovascular riskNanoscale2017939148971490628949356
- GuedesAFCarvalhoFADominguesMMMacraeFLMcPhersonHRSantosNCAriёnsRASSensing adhesion forces between erythrocytes and γ’ fibrinogen, modulating fibrin clot architecture and functionNanomedicine201814390991829410160
- CarvalhoFASantosNCAtomic force microscopy-based force spectroscopy – biological and biomedical applicationsIUBMB Life201264646547222550017
- StandevenKFCarterAMGrantPJFunctional analysis of fibrin gamma-chain cross-linking by activated factor XIII: determination of a cross-linking pattern that maximizes clot stiffnessBlood2007110390290717435113
- RattoTVRuddRELangryKCBalhornRLMcElfreshMWNonlin-early additive forces in multivalent ligand binding to a single protein revealed with force spectroscopyLangmuir20062241749175716460101
- ThiagarajanPRipponAJFarrellDHAlternative adhesion sites in human fibrinogen for vascular endothelial cellsBiochemistry19963513416941758672453
- BlombackBHesselBHoggDTherkildsenLA two-step fibrinogen – fibrin transition in blood coagulationNature19782755680501505692730
- Hurlet-JensenACumminsHZNosselHLLiuCYFibrin polymerization and release of fibrinopeptide B by thrombinThromb Res19822744194277147212
- MeadeTWNorthWRChakrabartiRHaemostatic function and cardiovascular death: early results of a prospective studyLancet198018177105010546103391
- UndasAAriensRAFibrin clot structure and function: a role in the pathophysiology of arterial and venous thromboembolic diseasesArterioscler Thromb Vasc Biol20113112e88e9921836064
- WeiselJWStructure of fibrin: impact on clot stabilityJ Thromb Haemost20075Suppl 111612417635717
- WeiselJWThe mechanical properties of fibrin for basic scientists and cliniciansBiophys Chem20041122–326727615572258
- BridgeKIPhilippouHAriensRClot properties and cardiovascular diseaseThromb Haemost2014112590190824899357
- ColletJPSoriaJMirshahiMDusart syndrome: a new concept of the relationship between fibrin clot architecture and fibrin clot degradability: hypofibrinolysis related to an abnormal clot structureBlood1993828246224697691261